. 2020 Jun 1;11(1):2722.
doi: 10.1038/s41467-020-16598-7.

Dynamics of the 4D genome during in vivo lineage specification and differentiation

Affiliations

Dynamics of the 4D genome during in vivo lineage specification and differentiation

A Marieke Oudelaar et al. Nat Commun. .

Abstract

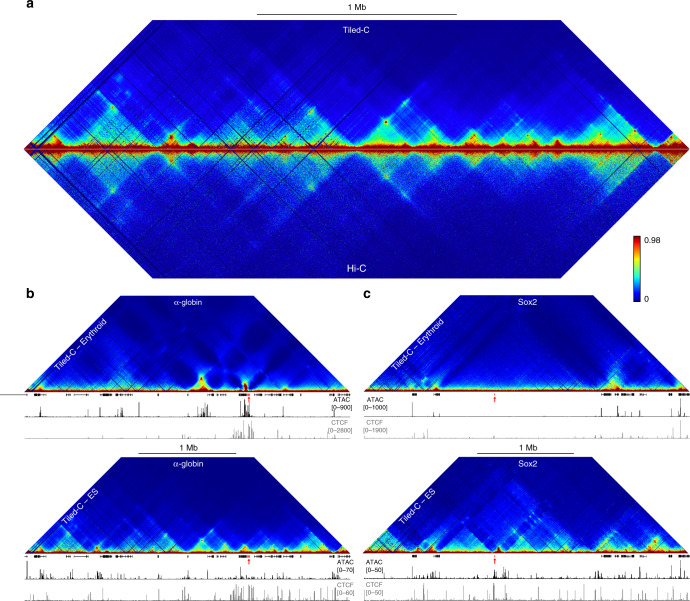
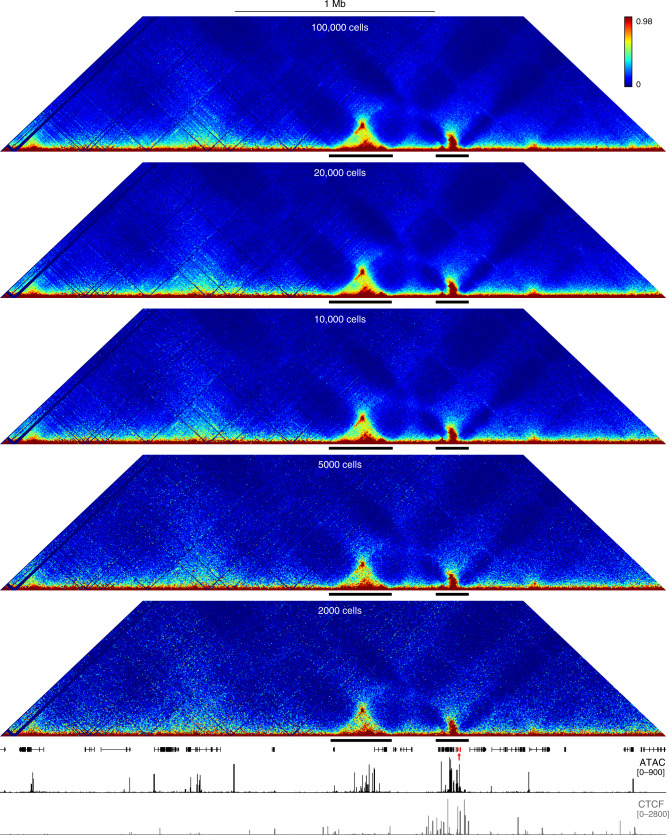
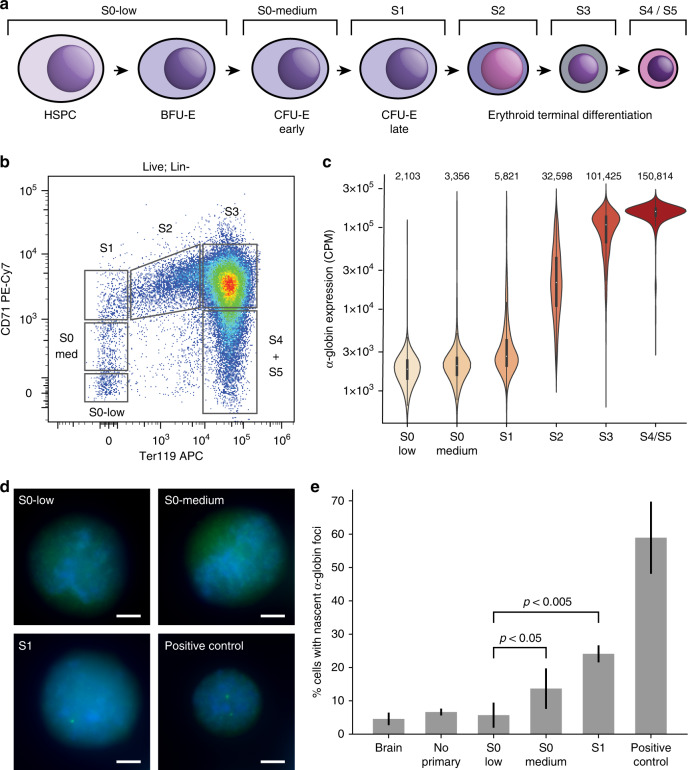
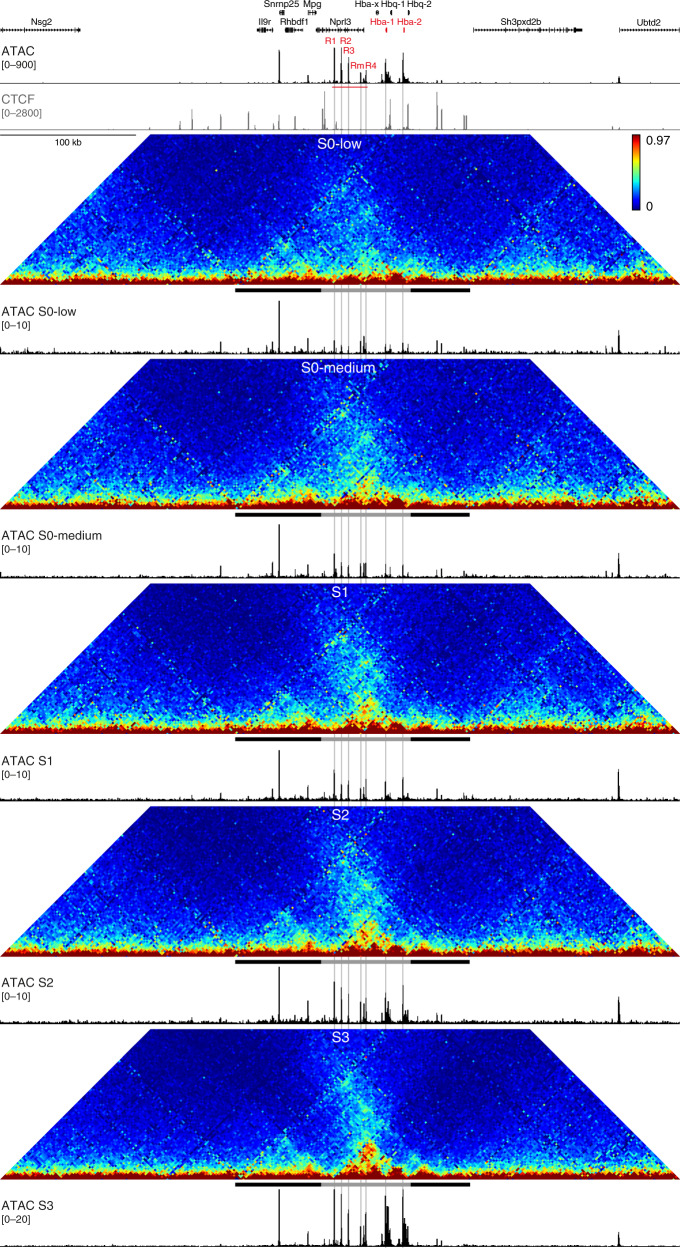
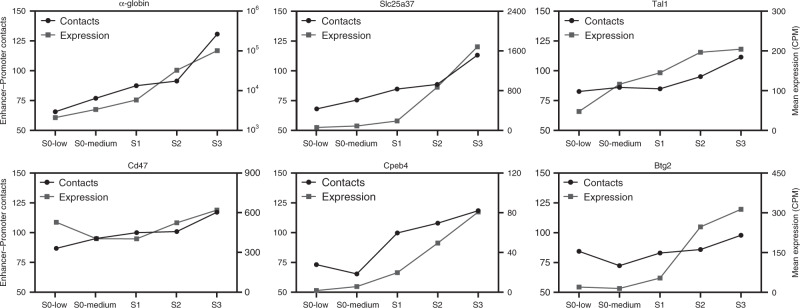
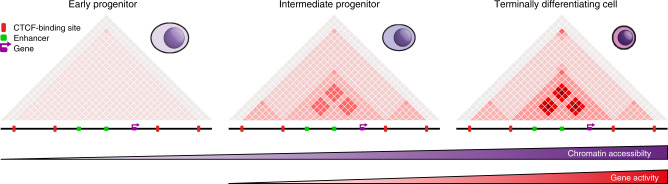
Mammalian gene expression patterns are controlled by regulatory elements, which interact within topologically associating domains (TADs). The relationship between activation of regulatory elements, formation of structural chromatin interactions and gene expression during development is unclear. Here, we present Tiled-C, a low-input chromosome conformation capture (3C) technique. We use this approach to study chromatin architecture at high spatial and temporal resolution through in vivo mouse erythroid differentiation. Integrated analysis of chromatin accessibility and single-cell expression data shows that regulatory elements gradually become accessible within pre-existing TADs during early differentiation. This is followed by structural re-organization within the TAD and formation of specific contacts between enhancers and promoters. Our high-resolution data show that these enhancer-promoter interactions are not established prior to gene expression, but formed gradually during differentiation, concomitant with progressive upregulation of gene activity. Together, these results provide new insight into the close, interdependent relationship between chromatin architecture and gene regulation during development.


Conflict of interest statement

J.R.H. is founder and shareholder of Nucleome Therapeutics.

Figures

Fig. 1
Fig. 1. Tiled-C generates deep all vs all 3C data at regions of interest.
a Comparison of Tiled-C and Hi-C contact matrices at 2 kb resolution in mouse ES cells. Contact frequencies represent normalized, unique interactions in three and four replicates for Tiled-C and Hi-C data, respectively. Coordinates (mm9): chr11:29,902,000–33,228,000. b Tiled-C contact matrices of ~3.3 Mb spanning the mouse α-globin locus in primary mature erythroid cells (top) and ES cells (bottom) at 2 kb resolution. Contact frequencies represent normalized, unique interactions in three replicates. Gene annotation (α-globin genes highlighted in red), open chromatin (ATAC), and CTCF occupancy are shown below the matrices. Coordinates (mm9): chr11:29,902,000–33,228,000. c Tiled-C contact matrices of ~3.4 Mb spanning the mouse Sox2 locus in primary mature erythroid cells (top) and ES cells (bottom) at 5 kb resolution. Contact frequencies represent normalized, unique interactions in four replicates. Gene annotation (Sox2 gene highlighted in red), open chromatin (ATAC), and CTCF occupancy are shown below the matrices. Coordinates (mm9): chr3:33,200,000–36,565,000.
Fig. 2
Fig. 2. Tiled-C generates high-resolution contact matrices from small numbers of cells.
Tiled-C contact matrices of ~3.3 Mb spanning the mouse α-globin locus at 5 kb resolution, generated from small aliquots of primary mature erythroid cells. Contact frequencies represent normalized, unique interactions in three replicates. TADs are indicated below each matrix with a black bar. Gene annotation (α-globin genes highlighted in red), open chromatin (ATAC), and CTCF occupancy are shown below the matrices. Coordinates (mm9): chr11:29,900,000–33,230,000.
Fig. 3
Fig. 3. Expression of α-globin is gradually upregulated during in vivo erythroid differentiation.
a Scheme of erythroid differentiation showing the various populations analyzed. b Example FACS plot showing the gating strategy used to isolate erythroid progenitors from mouse fetal liver. c Expression (in counts per million) of α-globin transcripts in each population as determined by single-cell RNA-seq. Mean expression for each population is given at the top of each bar. d Representative RNA-FISH images showing detection of nascent α-globin transcripts in sorted early erythroid progenitors. Scale bar is 3 μM for each image. e RNA-FISH quantification, showing the mean ± s.d. of n = 3 independent experiments (except for brain and “no primary” negative controls, which have n = 2). P-values were calculated by two-tailed paired t-tests (S0-low vs S0-medium P = 0.041, S0-low vs S1 P = 0.002). Source data are provided as a Source Data file.
Fig. 4
Fig. 4. Upregulation of α-globin expression correlates with increased chromatin accessibility and enhancer-promoter interactions.
Tiled-C contact matrices of 500 kb spanning the mouse α-globin locus in sequential stages of in vivo erythroid differentiation at 2 kb resolution. Contact frequencies represent normalized, unique interactions in two replicates. The black and gray bar below each matrix represent the pre-existing TAD (chr11:32,080,000-32,245,000) and erythroid-specific sub-TAD (chr11:32,136,000-32,202,000), respectively. Matched open chromatin (ATAC) profiles are shown underneath the matrices and represent normalized data from 3 S0-low, S0-medium, and S1 replicates and 2 S2 and S3 replicates. The ATAC profiles are shown at different scales to highlight changes in accessibility in early stages of differentiation. Gene annotation (α-globin genes highlighted in red), open chromatin (ATAC; α-globin enhancers highlighted in red), and CTCF occupancy in mature mouse erythroblast cells are shown at the top. Coordinates (mm9): chr11:31,900,000–32,400,000.
Fig. 5
Fig. 5. Enhancer-promoter interactions are formed progressively during erythroid differentiation and correlate with upregulation of gene expression.
Quantification of enhancer-promoter interactions and gene expression during in vivo erythroid differentiation at six erythroid gene loci. Contact frequencies (black circles; left Y-axis) represent unique interactions normalized for the total number of contacts in the matrix. Expression counts (gray squares; right Y-axis) represent mean expression in counts per million (CPM) for each population as determined by single-cell RNA-seq. Expression of α-globin, Slc25a37 and Tal1, is upregulated early in differentiation, concomitant with increased enhancer-promoter interactions. Cd47 is expressed in hematopoietic stem cells and further upregulated later in erythroid differentiation when enhancer-promoter interactions are strengthened. Cpeb4 and Btg2 become robustly expressed in the S1 stage and are further upregulated as enhancer-promoter interactions increase later in differentiation.
Fig. 6
Fig. 6. Graphical Summary.
Based on our findings, we propose a model in which TADs are established very early in differentiation. During lineage commitment, tissue-specific open chromatin sites are established within these domains. This is followed by the formation of smaller sub-domains within TADs, in which enhancers and promoters form interactions. Through differentiation, accessibility and specific interactions between enhancers and promoters are gradually increased, concomitant with upregulation of gene expression.

References

    1. Furlong EEM, Levine M. Developmental enhancers and chromosome topology. Science. 2018;361:1341–1345. - PMC - PubMed
    1. Schoenfelder S, Fraser P. Long-range enhancer-promoter contacts in gene expression control. Nat. Rev. Genet. 2019;20:437–455. - PubMed
    1. Stadhouders R, Filion GJ, Graf T. Transcription factors and 3D genome conformation in cell-fate decisions. Nature. 2019;569:345–354. - PubMed
    1. Andrey G, Mundlos S. The three-dimensional genome: regulating gene expression during pluripotency and development. Development. 2017;144:3646–3658. - PubMed
    1. de Laat W, Duboule D. Topology of mammalian developmental enhancers and their regulatory landscapes. Nature. 2013;502:499–506. - PubMed

Publication types

MeSH terms