. 2020 Jul;52(7):719-727.
doi: 10.1038/s41588-020-0635-0. Epub 2020 Jun 1.

Selective Mediator dependence of cell-type-specifying transcription

Affiliations

Selective Mediator dependence of cell-type-specifying transcription

Martin G Jaeger et al. Nat Genet. 2020 Jul.

Abstract

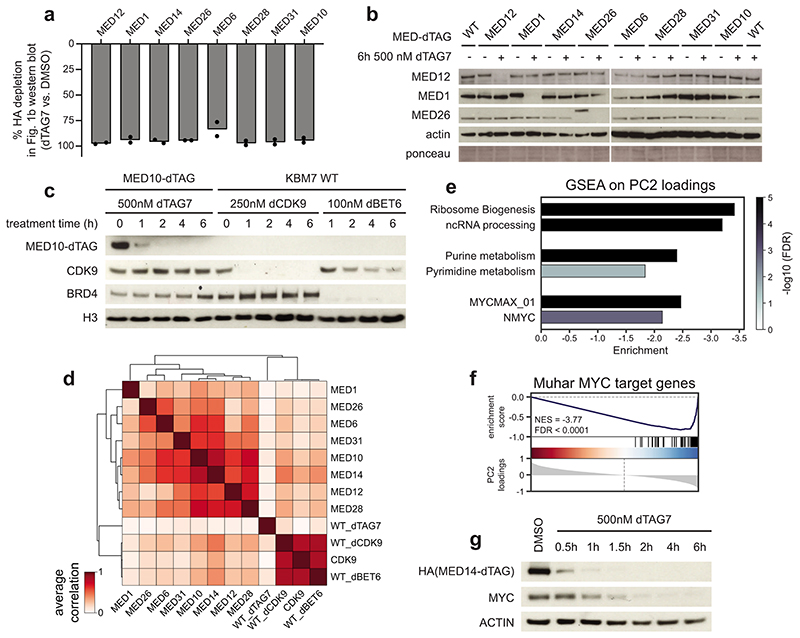
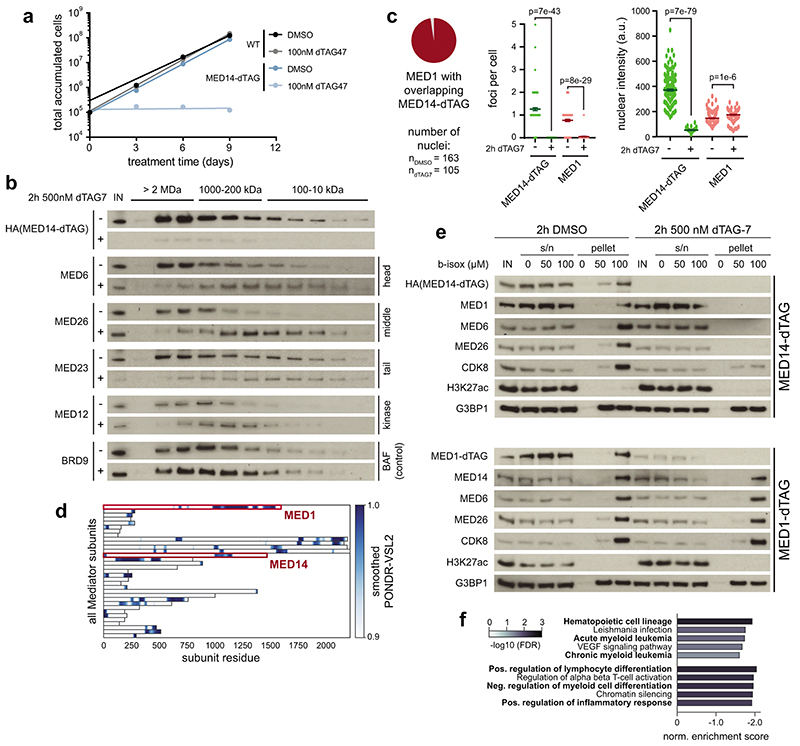
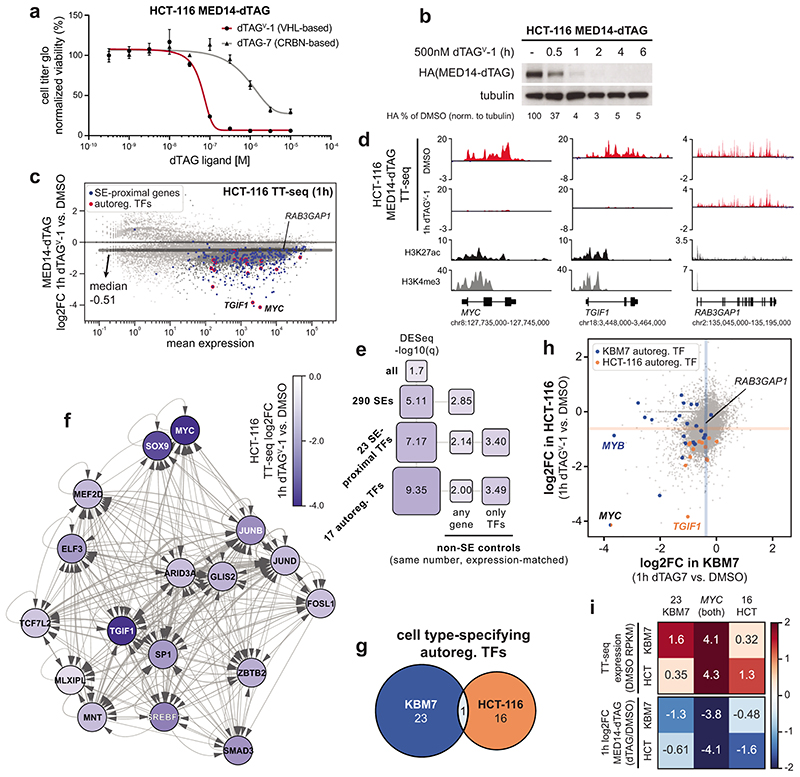
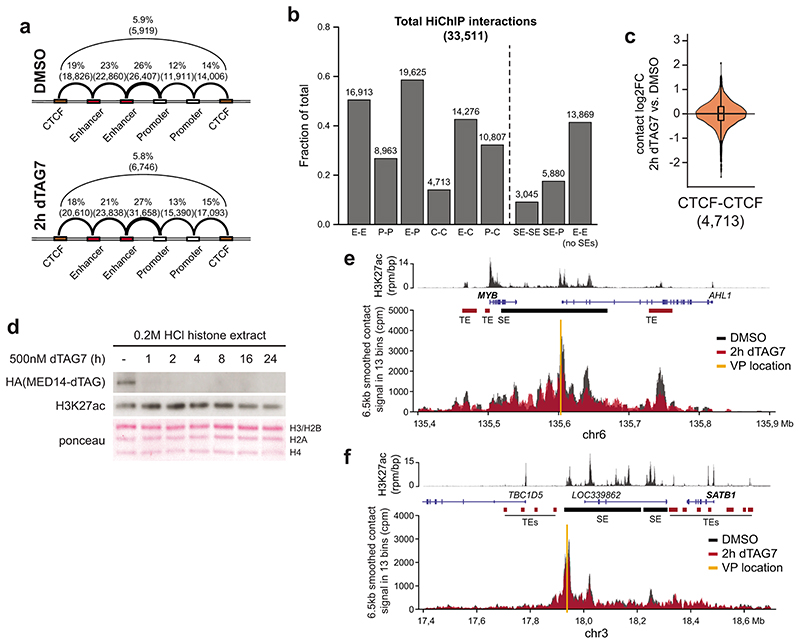
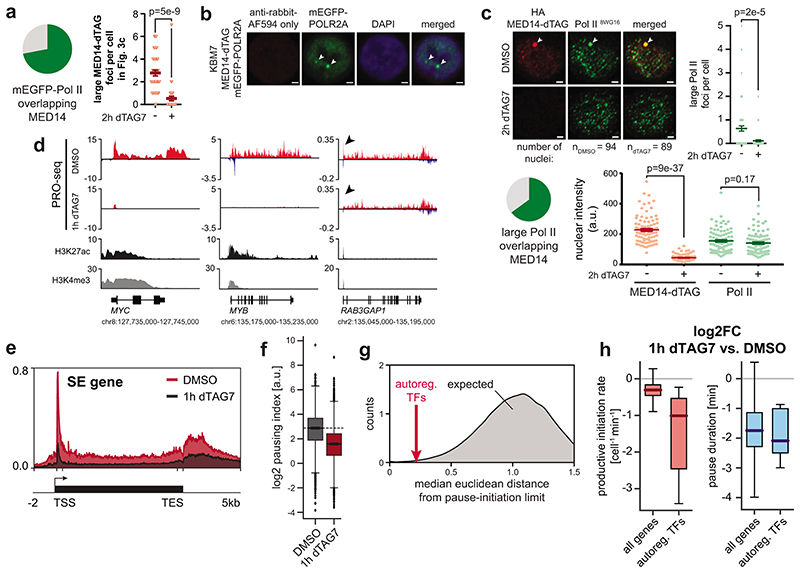
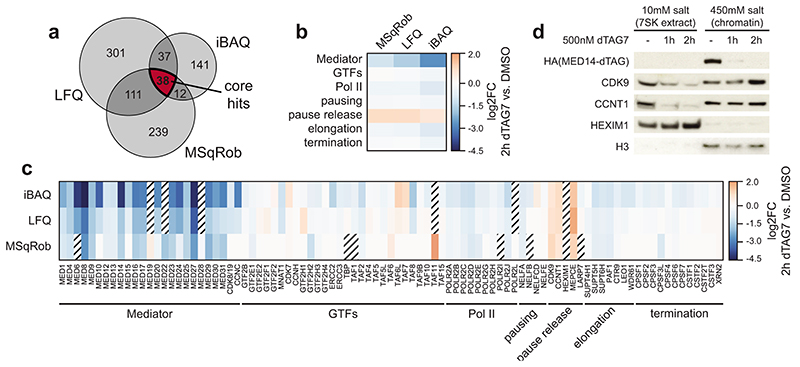
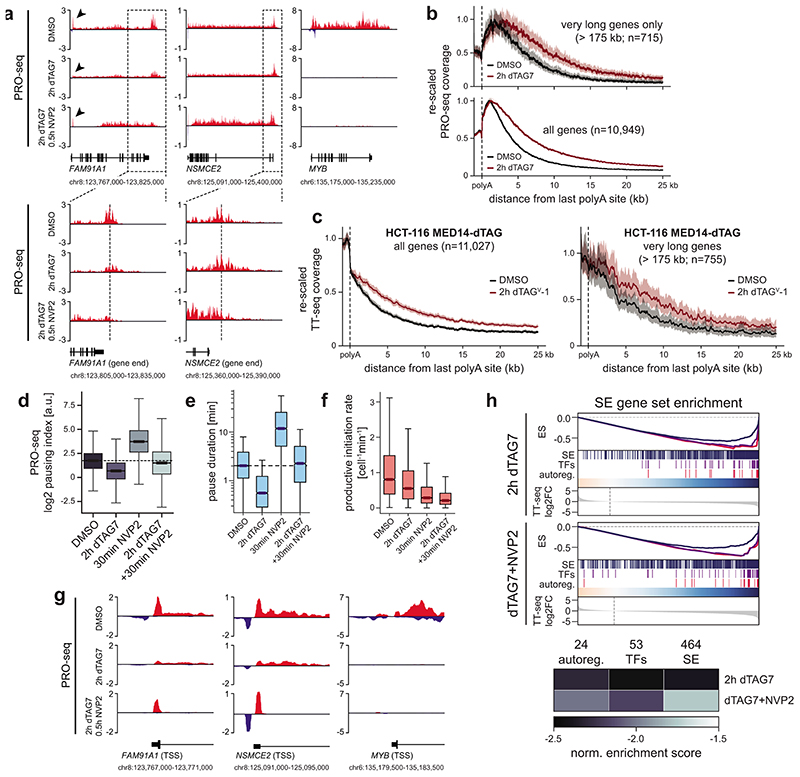
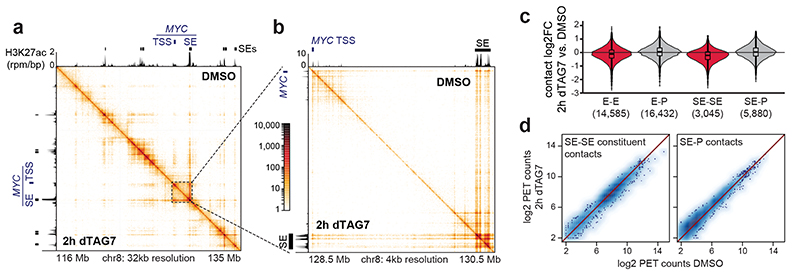
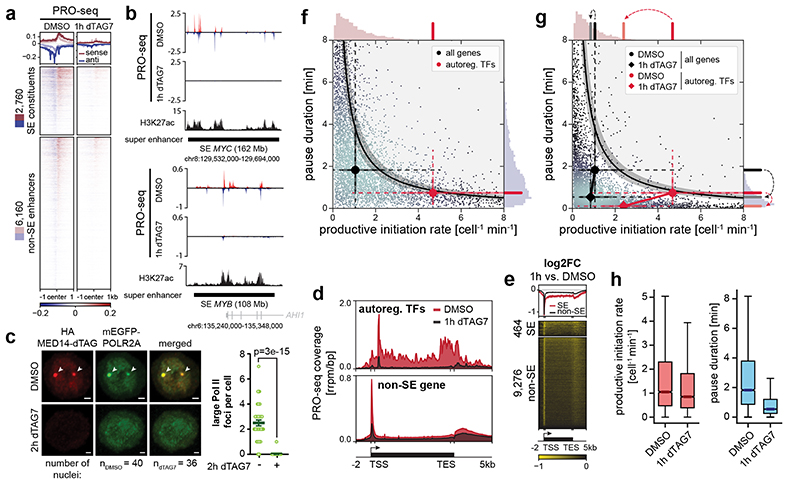
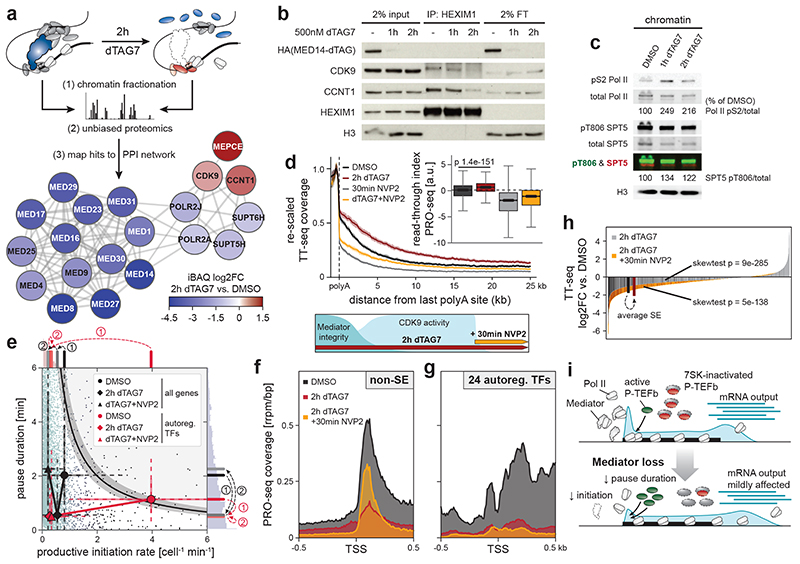
The Mediator complex directs signals from DNA-binding transcription factors to RNA polymerase II (Pol II). Despite this pivotal position, mechanistic understanding of Mediator in human cells remains incomplete. Here we quantified Mediator-controlled Pol II kinetics by coupling rapid subunit degradation with orthogonal experimental readouts. In agreement with a model of condensate-driven transcription initiation, large clusters of hypophosphorylated Pol II rapidly disassembled upon Mediator degradation. This was accompanied by a selective and pronounced disruption of cell-type-specifying transcriptional circuits, whose constituent genes featured exceptionally high rates of Pol II turnover. Notably, the transcriptional output of most other genes was largely unaffected by acute Mediator ablation. Maintenance of transcriptional activity at these genes was linked to an unexpected CDK9-dependent compensatory feedback loop that elevated Pol II pause release rates across the genome. Collectively, our work positions human Mediator as a globally acting coactivator that selectively safeguards the functionality of cell-type-specifying transcriptional networks.


Conflict of interest statement

Competing interests

G.E.W., J.E.B., and B.N. are inventors on patent applications related to the dTAG system (WO/2017/024318, WO/2017/024319, WO/2018/148443, WO/2018/148440). The dTAGV-1 molecule is the subject of a patent application filed by Dana-Farber Cancer Institute. N.S.G. is a Scientific Founder, member of the Scientific Advisory Board (SAB) and equity holder in C4 Therapeutics, Syros, Soltego, B2S, Gatekeeper and Petra Pharmaceuticals. The Gray lab receives or has received research funding from Novartis, Takeda, Astellas, Taiho, Janssen, Kinogen, Voroni, Her2llc, Deerfield and Sanofi. J.E.B. is now an executive and shareholder of Novartis AG, and has been a founder and shareholder of SHAPE (acquired by Medivir), Acetylon (acquired by Celgene), Tensha (acquired by Roche), Syros, Regenacy, and C4 Therapeutics.

Figures

Extended Data Fig. 1
Extended Data Fig. 1. Extended characterization of chemically degradable MED-dTAG alleles.
a, MED-dTAG depletion mean of two independent image quantifications of the Fig. 1b immunoblot. b, Degrader treatment selectively destabilizes the tagged Mediator subunit without affecting other complex members. c, Time-resolved immunoblot of MED10-dTAG and direct pharmacologic degradation of CDK9 (dCDK9; THAL-SNS-032) or BRD4 (dBET6). d, Pearson correlation of average 3’ mRNA-seq log2 fold changes after 6h (n=3 independent drug treatments). For dTAG-carrying cell lines (only gene names shown), we compare dTAG7 vs. vehicle control in the same cell line. Other conditions represent drug vs. vehicle control in wild-type cells. e, Gene ontology (GO) terms enriched among negative PC2 loadings in Fig. 1c. Enrichment was calculated using the GSEAPreranked tool. Negative enrichment indicates a strong influence of these terms on PC2 diversity and that the underlying genes are downregulated. f, Gene set enrichment analysis of top 100 core MYC target genes from (ref. ) among PC2 loadings. g, Time-resolved immunoblot of MED14-dTAG degradation kinetics and its influence on MYC protein levels. Unprocessed western blots shown in Source Data.
Extended Data Fig. 2
Extended Data Fig. 2. MED14 degradation disrupts overall Mediator complex integrity.
a, Influence of long-term MED14 degradation on cell growth. b, Size-exclusion chromatography and western blotting of nuclear extracts after MED14 degradation. Mediator subunits of each submodule shifted to lower apparent molecular weight, indicating complex disassembly. BAF complex member BRD9 serves as negative control. c, Image quantification related to Fig. 1f. Pie chart: percent of n=125 MED1 foci with overlapping MED14-dTAG foci. Middle dot plot: mean±s.e.m number of foci per cell. Swarm plot: mean±s.e.m integrated nuclear fluorescence intensity. Unpaired, two-sided t-tests. 163 nuclei were quantified for DMSO and 105 for dTAG7. d, 20-residue running average-smoothed PONDR-VSL2 disorder prediction for human Mediator. Subunits are ordered by ascending index numbers from MED1 to MED31, followed by CDK8, CDK19, and CCNC. e, Influence of MED14 or MED1 degradation on co-precipitation of other Mediator subunits with biotinylated isoxazole pellets. MED14, but not MED1 degradation, prevents Mediator co-precipitation with IDR-enriching hydrogels. f, Cell identity gene sets enriched among downregulated transcription units in TT-seq after 1h MED14 degradation. Enrichment was calculated using the GSEAPreranked tool. Unprocessed western blots shown in Source Data.
Extended Data Fig. 3
Extended Data Fig. 3. Acute transcriptional consequences of MED14 degradation in HCT-116 cells.
a, CellTiter-Glo viability-based 72h dose-response of dTAG7 and dTAGV-1 in HCT-116 MED14-dTAG cells. Mean±s.d. of n=3 drug treatments. b, Time-resolved immunoblot of MED14-dTAG degradation. c, Differences in TT-seq nascent transcript levels (n=2 independent treatments). Significantly deregulated (DESeq2 q < 0.01; dark grey), SE-proximal (blue), and auto-regulatory TF genes (red) are highlighted. Dark grey line: median log2 fold change of all n=21,629 transcription units. d, TT-seq signal of two auto-regulatory TFs, and an expression-matched control gene. H3K27ac and H3K4me3 ChIP-seq signals are from publically available data (GSE72622; see Supplementary Table 7). e, Fold-change (color) and significance (size) of SE-driven HCT-116 cell identity and expression-matched control gene sets (data as in c). f, Regulatory wiring of 17 auto-regulatory TFs in the HCT-116 cell type-specifying gene regulatory network. Arrows: the given TF has binding motifs in the target TF’s SE region(s). Edge weight mirrors number of motifs. g, Overlap of KBM7 and HCT-116 auto-regulatory TFs. h, Cell type-specific impact of 1h MED14 degradation. Auto-regulatory TFs in KBM7 (blue, e.g. MYB), HCT-116 (orange, e.g. TGIF1), or MYC (black) as the only shared TF are highlighted. Colored lines: median log2FC in the respective cell line. i, Mean steady state expression of auto-regulatory TFs in merged 1h and 2h DMSO TT-seq conditions and transcriptional defects after 1h MED14 degradation. Unprocessed western blot shown in Source Data.
Extended Data Fig. 4
Extended Data Fig. 4. Impact of MED14 degradation on overall chromatin architecture.
a, Genomic feature classes at H3K27ac HiChIP contact anchors. Only significant interactions called by hichipper/mango were used for anchor identification. Arcs indicate the percentage of anchor-anchor pairs annotated with the indicated feature in each of the samples. b, Total number of interactions common to DMSO and dTAG7 samples, which were used for quantification (E: enhancer, P: promoter, SE: constituent). c, Impact of Mediator loss on CTCF-CTCF contact strength as negative control. Bracket: number of quantified contacts. Violin plot elements: approximated density distribution with internal box plots showing medians with interquartile range and 1.5x whiskers. d, Impact of MED14 degradation on H3K27 acetylation. e, Pulldown-independent 4C-seq analysis of MYB SE constituent viewpoint (VP) after 2h MED14 degradation in triplicates. Top track shows KBM7 wild-type H3K27ac ChIP-seq. TE: typical enhancer, SE: super-enhancer f, Analogous to (e) with a SATB1 SE viewpoint. Unprocessed western blot shown in Source Data.
Extended Data Fig. 5
Extended Data Fig. 5. Impact of MED14 degradation on Pol II clusters and nascent transcription dynamics.
a, Image quantification related to Fig. 3c. Pie chart: percent of n=100 large Pol II foci, which overlap MED14-dTAG foci. Mean±s.e.m. with two-sided, unpaired t-test (n=40 nuclei in DMSO; n=36 nuclei in dTAG7 condition). b, Control imaging experiment related to Fig. 3c, omitting anti-HA primary antibody to rule out that Pol II foci are an HA channel bleed through artifact. c, Immunofluorescence of large hypo-phosphorylated Pol II foci (8WG16; arrows) in MED14-dTAG KBM7 cells. Maximum intensity projections of 3D images. Scale bars 1μm. Pie chart: percent of n=60 large Pol II foci, which overlap MED14-dTAG foci. Dot plots: changes in number of large Pol II foci per cell and integrated nuclear fluorescence intensity. Mean±s.e.m. with unpaired, two-sided t-tests (n=94 nuclei for DMSO; n=89 for dTAG7). d, PRO-seq signal of auto-regulatory TFs MYC and MYB, and the expression-matched control gene RAB3GAP1 after 1h MED14 degradation. Arrows highlight loss of promoter-proximal signal. H3K4me3 and H3K27ac ChIP-seq signal from KBM7 wild-type cells. e, Aggregated PRO-seq coverage over an SE-proximal metagene. TSS, transcription start site; TES, transcription end site. f, Changes in PRO-seq pausing index at n=7,643 genes after 1h MED14 degradation. g, Observed vs. expected median Euclidean distance of auto-regulatory TFs from the pause-initiation limit in Fig. 3f. The expected distribution was generated by randomly selecting the same number of genes from bulk. h, Changes in productive initiation rate and pause duration of all 6,791 genes vs. the 24 auto-regulatory TFs. Productive initiation rates selectively decrease for auto-regulatory TFs, while pause duration decreases globally. Box plot elements: medians with interquartile range and 1.5x whiskers.
Extended Data Fig. 6
Extended Data Fig. 6. Unbiased proteomics reveal increased P-TEFb levels on chromatin.
a, Overlap of three independent data analyses to detect high-confidence differentially chromatin-bound proteins (p < 0.1; see Supplementary Note). b,c, Differential chromatin binding of transcription regulators. Class averages are shown in b. Scratched boxes indicate missing values. GTFs: general transcription factors. d, Salt-based fractionation of 7SK- and chromatin-bound P-TEFb complexes. Unprocessed western blot shown in Source Data.
Extended Data Fig. 7
Extended Data Fig. 7. P-TEFb activation shapes the transcriptional response to Mediator loss.
a, PRO-seq read-through upon 2h MED14 degradation. Additionally inhibiting CDK9 with 500nM NVP2 in the last 30min reverses the read-through. Zoom-ins show 30kb windows around the polyadenylation site. Arrows highlight transcription start site (TSS) regions shown in g. b, Aggregated PRO-seq coverages show read-through even for long genes, where newly initiated Pol II has not yet reached the termination site. Mean±bootstrapped confidence region. c, Aggregated TT-seq coverages show read-through transcription after MED14 degradation also in HCT-116 cells. d,e, Changes in PRO-seq pausing index of all n=5,558 genes (d) and calculated pause duration at all n=6,954 transcription units (e) after MED14/CDK9 perturbation. f, Changes in productive initiation rates for all n=6,954 transcription units. Box plot elements: medians with interquartile range, 1.5x whiskers and confidence region notches. g, PRO-seq signal around transcription start sites (TSS) of two non-SE and one auto-regulatory TF gene. Paused polymerase does not re-accumulate at the MYB TSS upon combined MED14/CDK9 perturbation. h, TT-seq SE-gene set enrichment upon combined MED14/CDK9 perturbation. Less significant enrichment confirms that CDK9 activity aggravated the SE-selectivity of Mediator disruption.
Fig. 1
Fig. 1. Acute Mediator loss selectively abrogates the functionality of cell type-specifying transcriptional circuits.
a, MED-dTAG alleles and their location in the complex. H: head, M: middle, T: tail, K: kinase module. b, Destabilization of MED-dTAG fusion proteins. c, Principal component analysis of transcriptional fingerprints after 6h (n=3 independent drug treatments). Gene labels: dTAG-carrying cells treated with 500nM dTAG7. dCDK9, dBET6: direct degradation of CDK9 or BET proteins in wild-type cells with 250nM THAL-SNS-032 (dCDK9) or 100nM dBET6. d, Spike-in normalized mRNA log2 fold changes of degrader-treated cell lines (n=8,798 genes; median of 3 independent treatments). e, Genes deregulated by MED-dTAG degradation (left) converge on consensus targets (right). Red bars: genes deregulated by ≥3 perturbations. f, Immunofluorescence of MED1 foci (arrows) in MED14-dTAG cells. Maximum intensity projections of 3D images. Scale bars 1μm. g, Differences in TT-seq nascent transcript levels (n=2 independent treatments). Significantly deregulated (DESeq2 q < 0.01; dark grey), Super-enhancer (SE)-proximal (blue), and auto-regulatory transcription factor (TF) genes (red) are highlighted. Dark grey line: median log2 fold change of all n=19,559 transcription units. h, TT-seq signal of two auto-regulatory TFs, and an expression-matched control gene. H3K27ac and H3K4me3 ChIP-seq signals from KBM7 wild-type cells. i, Fold-change (color) and significance (size) of SE-driven cell identity and expression-matched control gene sets (data as in g). j, 24 auto-regulatory TFs constitute a KBM7 cell type-specifying gene regulatory network. Arrows: the given TF has binding motifs in the target TF’s SE region(s). Edge weight mirrors number of motifs. k, Cell type-specific impact of MED14 degradation on KBM7 and HCT-116 auto-regulatory TFs. Shaded areas: mean log2 fold changes (FC) of the underlying TF genes. Unprocessed western blot shown in Source Data. Violin plot elements: approximated density distribution with internal box plots showing medians with interquartile range and 1.5x whiskers.
Fig. 2
Fig. 2. Mediator is dispensible for maintenance of enhancer-promoter contacts.
a, H3K27ac HiChIP contact matrices of a ≈20Mb region around the MYC locus. Upper triangle shows 2h DMSO, lower triangle 2h MED14 degradation. Axis tracks show KBM7 H3K27ac ChIP-seq signal (capped at 2 rpm/bp) and super-enhancers (SEs). b, Zoom-in highlighting MYC SE–promoter and constituent–constituent contacts. c, Impact on H3K27ac HiChIP contact frequency (E: enhancer, P: promoter, SE: constituent). Brackets: number of quantified contacts. Violin plot elements: approximated density distribution with internal box plots showing medians with interquartile range and 1.5x whiskers. d, Paired-end tag (PET) counts of contacts involving SE constituents. TSS, transcription start site.
Fig. 3
Fig. 3. Mediator organizes Pol II clusters to optimize transcription dynamics of cell type-specifying gene regulatory networks.
a, Impact of 1h MED14 degradation on polymerase engagement at enhancers. b, PRO-seq signal of two super-enhancer (SE) regions. H3K27ac ChIP-seq signal from KBM7 wild-type cells. c, Fixed cell imaging of large Pol II foci (arrows) in MED14-dTAG mEGFP-POLR2A KBM7 cells. Maximum intensity projections of 3D images. Scale bars 1μm. Mean±s.e.m. with two-sided, unpaired t-test. Further quantification and controls in Extended Data Fig. 5a,b. d, Aggregate PRO-seq coverage of auto-regulatory transcription factor (TF) or non-SE metagenes. e, Enrichment heatmap of PRO-seq log2 fold changes (FC) over SE and non-SE metagenes. f, Steady-state productive initiation rates and pause durations for 6,791 transcription units in MED14-dTAG cells. The black central line denotes the theoretical pause-initiation limit with 15% uncertainty. Markers indicate median gene set values with protruding whisker (dashed) and IQR (solid) proxies. Axis histograms highlight median values of auto-regulatory TFs. g, Pause-initiation values after 1h MED14 degradation. Histogram dashed arrows indicate median pause duration and productive initiation rate trajectories from DMSO to 1h MED14 degradation. h, Changes in productive initiation rates and pause durations for all n=6,791 transcription units. Box plot elements: medians with interquartile range, 1.5x whiskers and confidence region notches. TSS, transcription start site; TES, transcription end site.
Fig. 4
Fig. 4. Compensatory P-TEFb activation boosts non-super-enhancer (SE) output to shape the Mediator hyper-dependence of cell type-specifying transcription.
a, Chromatin proteomics strategy and results. Chromatin fractions were subjected to unbiased, label-free mass spectrometry. High-confidence hits were mapped to public protein-protein interaction (PPI) data. The largest-connected-component network shows differential chromatin binding using isobaric absolute quantification (iBAQ). b, CDK9/CCNT1 co-immunoprecipitation with HEXIM1 inhibitory 7SK particles. c, CDK9 target phosphorylation on purified chromatin fractions. d, Aggregated TT-seq coverage past polyadenylation sites (n=10,949 transcription units; mean±bootstrapped confidence region). Treatment scheme: 2h MED14 degradation (500nM dTAG7) and/or CDK9 inhibition (500nM NVP2) in the last 30min. Boxplots: PRO-seq read-through indices (n=5,558 genes; Mann-Whitney U-test); medians with interquartile range, 1.5x whiskers and confidence region notches. e, Productive initiation rates and pause durations for 6,954 transcription units after combined MED14/CDK9 perturbation. Markers show median trajectories from DMSO control (circles) to 2h MED14 degradation (diamonds) and combined MED14/CDK9 perturbation (triangles). Axis histograms further illustrate these trajectories. f,g, Aggregated PRO-seq coverage around transcription start sites (TSS) of non-SE genes (f) or auto-regulatory transcription factors (TFs) (g). h, Rank-ordered TT-seq differential expression for 2h MED14 degradation (SE genes in black) or combined MED14/CDK9 perturbation (SE genes in red) compared to DMSO control (n=20,882 transcription units). Bold bars: mean SE ranks and log2 fold changes. P-values from all-gene distribution, two-sided skewness tests. i, Model how P-TEFb activation might compensate less efficient initiation in response to Mediator loss. This mechanism falls short of rescuing initiation defects at auto-regulatory TFs. Unprocessed western blots shown in Source Data.

References

    1. Kelleher RJ, 3rd, Flanagan PM, Kornberg RD. A novel mediator between activator proteins and the RNA polymerase II transcription apparatus. Cell. 1990;61:1209–15. - PubMed
    1. Kornberg RD. Mediator and the mechanism of transcriptional activation. Trends Biochem Sci. 2005;30:235–9. - PubMed
    1. Thompson CM, Koleske AJ, Chao DM, Young RA. A multisubunit complex associated with the RNA polymerase II CTD and TATA-binding protein in yeast. Cell. 1993;73:1361–75. - PubMed
    1. Kim YJ, Bjorklund S, Li Y, Sayre MH, Kornberg RD. A multiprotein mediator of transcriptional activation and its interaction with the C-terminal repeat domain of RNA polymerase II. Cell. 1994;77:599–608. - PubMed
    1. Fondell JD, Ge H, Roeder RG. Ligand induction of a transcriptionally active thyroid hormone receptor coactivator complex. Proc Natl Acad Sci U S A. 1996;93:8329–33. - PMC - PubMed

Publication types