. 2020 Jun 1;3(1):275.
doi: 10.1038/s42003-020-1004-3.

Integrative omics analysis of the termite gut system adaptation to Miscanthus diet identifies lignocellulose degradation enzymes

Affiliations

Integrative omics analysis of the termite gut system adaptation to Miscanthus diet identifies lignocellulose degradation enzymes

Magdalena Calusinska et al. Commun Biol. .

Abstract

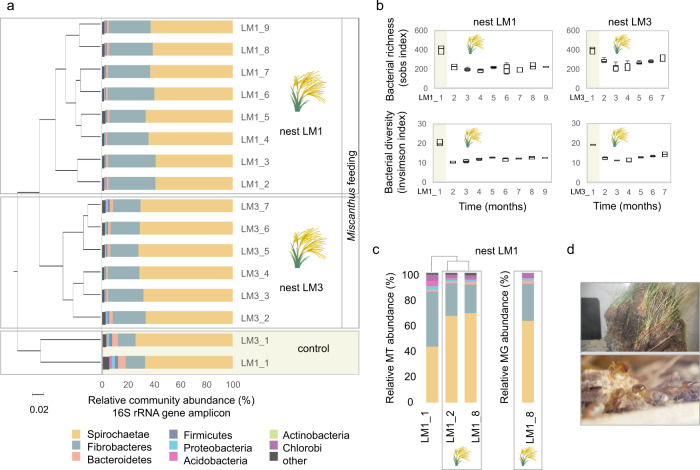
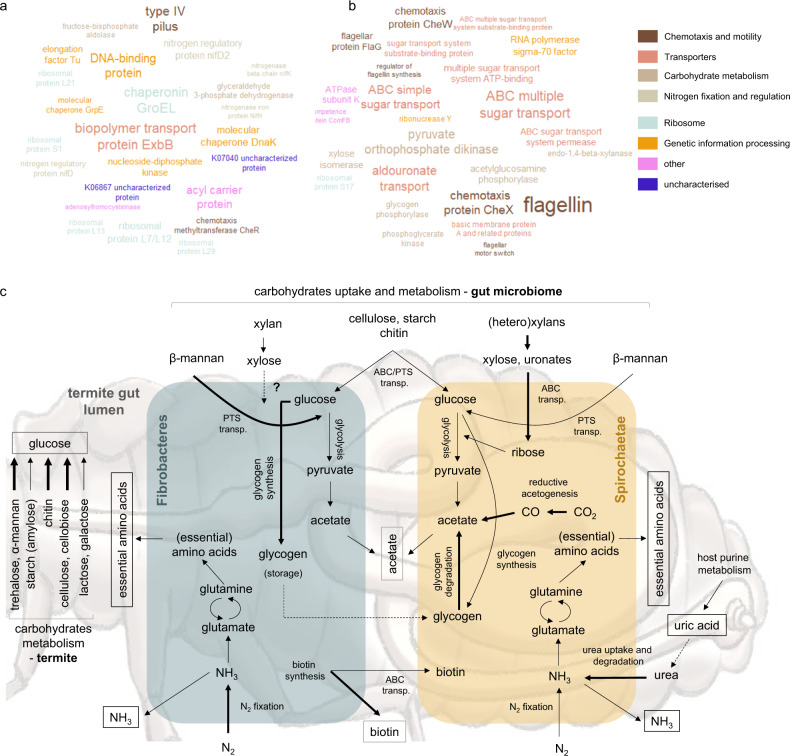
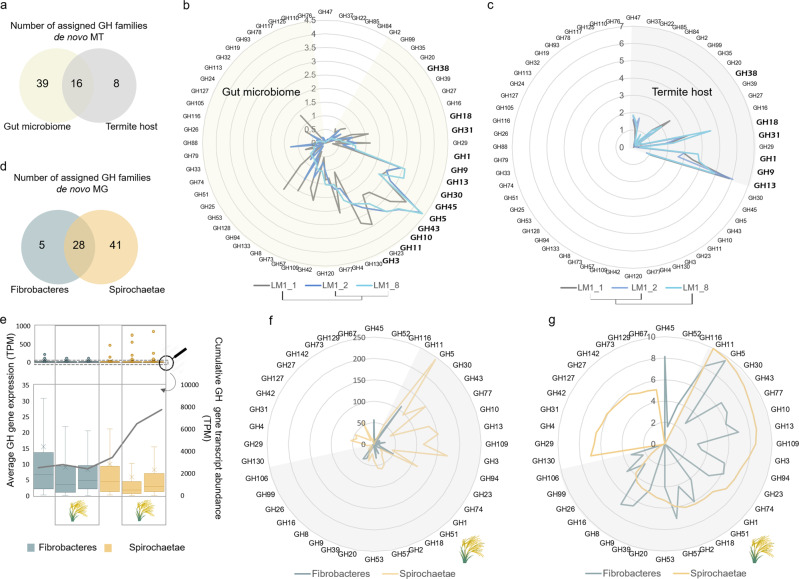
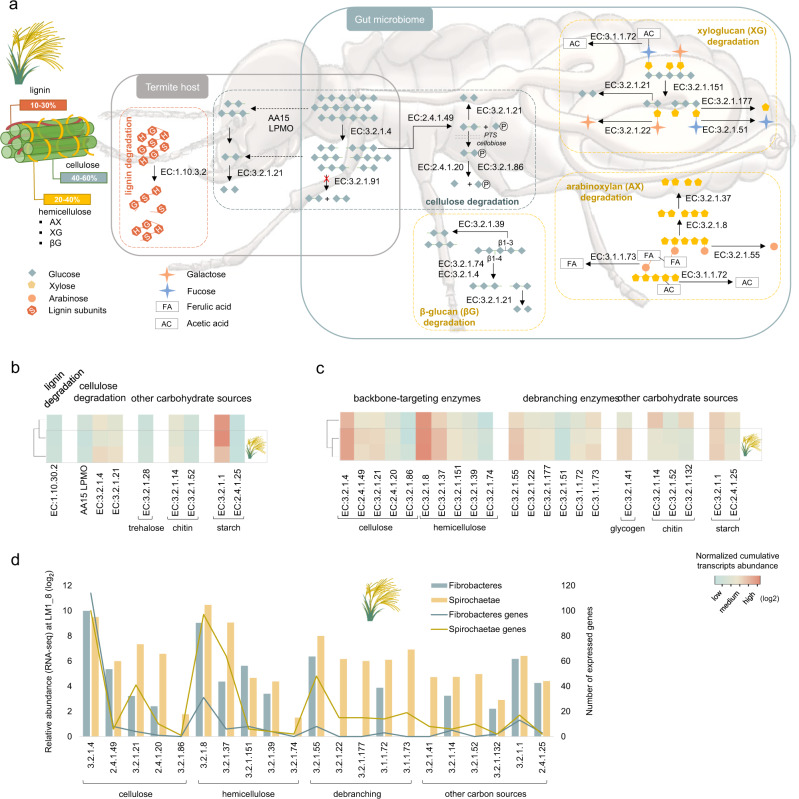
Miscanthus sp. biomass could satisfy future biorefinery value chains. However, its use is largely untapped due to high recalcitrance. The termite and its gut microbiome are considered the most efficient lignocellulose degrading system in nature. Here, we investigate at holobiont level the dynamic adaptation of Cortaritermes sp. to imposed Miscanthus diet, with a long-term objective of overcoming lignocellulose recalcitrance. We use an integrative omics approach combined with enzymatic characterisation of carbohydrate active enzymes from termite gut Fibrobacteres and Spirochaetae. Modified gene expression profiles of gut bacteria suggest a shift towards utilisation of cellulose and arabinoxylan, two main components of Miscanthus lignocellulose. Low identity of reconstructed microbial genomes to closely related species supports the hypothesis of a strong phylogenetic relationship between host and its gut microbiome. This study provides a framework for better understanding the complex lignocellulose degradation by the higher termite gut system and paves a road towards its future bioprospecting.


Conflict of interest statement

The authors declare no competing interests.

Figures

Fig. 1
Fig. 1. Structural composition of Cortaritermes sp. gut microbiome under Miscanthus sp. diet.
a Clustering of samples based on the calculated Bray−Curtis index and phylum level taxonomic assignment of sequencing reads from the 16S rRNA gene amplicon study. b Bacterial richness and diversity indices before (highlighted in yellow on sub-figures a and b) and under Miscanthus. Boxes represent the interquartile range and error bars show the 95% confidence intervals (n = 3). c Relative metatranscriptomic (MT) and metagenomic (MG) reads abundance assigned at the phylum level. Taxonomic gene and gene transcript assignments were inferred from the metagenomic contigs binning and phylum-level bin classification. d Cortaritermes sp. colony (top) and termite workers under the protection of soldiers while feeding on Miscanthus fibres in laboratory conditions (bottom).
Fig. 2
Fig. 2. Functional characterisation of the termite gut system feeding on Miscanthus sp.
a, b Tag clouds of enriched (LefSe LDA > 2, p < 0.05) KOs reconstructed from the de novo metatranscriptomics for the termite gut Fibrobacteres (a) and Spirochaetae (b) at LM1_8. Top 25 most abundant KOs are displayed. Size of the text reflects transcriptomics abundance of a specific KO. c Simplified metabolic reconstruction, with a focus on carbohydrate metabolism, for the termite gut lignocellulolytic system. Hypothetical pathways are indicated with dashed lines. Metabolic pathways enriched in Fibrobacteres and Spirochaetae (metatranscriptomes) are indicated with bold lines. Metabolites putatively shared between gut bacteria and the host are indicated with square boxes.
Fig. 3
Fig. 3. Carbohydrate active enzymes (CAZymes) reconstructed from metatranscriptomic (MT) and metagenomic (MG) reads for the termite gut system.
a Venn diagram showing the number of assigned glycoside hydrolase (GH) families for the termite gut microbiome and host gut epithelium. b, c Comparison of the gene expression profiles (de novo MT, log2 transformed) for gene transcripts assigned to the different GH families and at the different stages of the Miscanthus feeding experiment, for the gut microbiome (b) and the host gut epithelium (c). d Venn diagram showing the number of assigned GH families for Fibrobacteres and Spirochaetae, based on the de novo MG reconstruction. e Average CAZyme genes expression and cumulative gene expression at the different stages of the feeding experiment and analysed separately for Fibrobacteres and Spirochaetae. Lower panel is a zoom on the gene expression profiles with the outliers (highly expressed genes; in some cases representing only partially reconstructed genes) removed. Boxes represent the interquartile range and error bars show the 95% confidence intervals (n = number of transcripts annotated as glycoside hydrolases). f, g Number of genes (f) and cumulative abundance of the most abundant GH families (g RNA-seq log2 transformed) at the time point LM1_8 (the end of the Miscanthus feeding experiment), and visualised separately for Fibrobacteres and Spirochaetae. Transcripts abundance (g) is calculated based on the RNA mappings (RNA-seq) to the MG contigs. Shaded parts correspond to shared GH families.
Fig. 4
Fig. 4. Characterisation of the termite gut lignocellulose degradation strategies.
a Simplified overview of enzymatic pathways involved in the degradation of main components of the Miscanthus biomass, based on enzymes (gene transcripts assigned an EC number) revealed in our study. Dashed lines indicate hypothetical pathways. Lignin subunits correspond to: p-hydroxyphenyl (H), guaiacyl (G), and syringyl (S). CAZymes gene expression profiles (de novo MT) at the different stages of the Miscanthus feeding experiment analysed for the termite gut epithelium (b) and the termite gut microbiome (c). Gene expression analyses were done separately for the termite gut epithelium and the gut microbiome; therefore, data on sub-figures b and c should only be compared within a single sub-figure. d Relative CAZymes gene transcripts abundance (RNA-seq) and gene numbers assigned to different enzymatic categories and analysed separately for Fibrobacteres and Spirochaetae for LM1_8 sample.
Fig. 5
Fig. 5. Characterisation of the GH5_4 family.
a Unrooted neighbour-joining tree containing the de novo reconstructed genes from MG study (genes expressed under Miscanthus diet are highlighted in orange on the tree). Tree was cut in two parts along the dashed line. All GH5_4 characterised proteins were retrieved from the CAZY database and included on the tree. Clusters indicated with an arrow and designated as “MA” contain known multi-functional enzymes. The percentage of replicate trees in which the associated sequences clustered together in the bootstrap test (500 replicates) are shown next to the branches. Final alignment involved 157 amino acid sequences. Protein from the Spirochaetes cluster IX indicated with a grey arrow was heterologously produced and characterised. b Activity profiles for the heterologously produced and purified protein tested against CMC, glucomannan (galactomannan was negative, not displayed on the graph), xylan and arabinoxylan. Boxes represent the interquartile range and error bars show the 95% confidence intervals (n = 4). c Optimal temperature was assessed for glucomannan substrate. Error bars represent the standard deviation of a dataset (n = 3).

References

    1. Bar-On YM, Phillips R, Milo R. The biomass distribution on Earth. Proc. Natl. Acad. Sci. USA. 2018;115:6506–6511. - PMC - PubMed
    1. Lewandowski I, Clifton-Brown JC, Scurlock JMO, Huisman W. Miscanthus: European experience with a novel energy crop. Biomass-. Bioenergy. 2000;19:209–227.
    1. Luo H, et al. Total utilization of Miscanthus biomass, lignin and carbohydrates, using Earth abundant nickel catalyst. ACS Sustain. Chem. Eng. 2016;4:2316–2322.
    1. van der Weijde, T., Dolstra, O., Visser, R. G. F. & Trindade, L. M. Stability of cell wall composition and saccharification efficiency in Miscanthus across diverse environments. Front. Plant Sci.10.3389/fpls.2016.02004 (2017). - PMC - PubMed
    1. Cantarel BL, et al. The Carbohydrate-Active enZymes database (CAZy): an expert resource for Glycogenomics. Nucleic Acids Res. 2008;37:D233–D238. - PMC - PubMed

Publication types