. 2020 Jul;17(7):741-748.
doi: 10.1038/s41592-020-0851-7. Epub 2020 Jun 1.

Real-time 3D movement correction for two-photon imaging in behaving animals

Affiliations

Real-time 3D movement correction for two-photon imaging in behaving animals

Victoria A Griffiths et al. Nat Methods. 2020 Jul.

Abstract

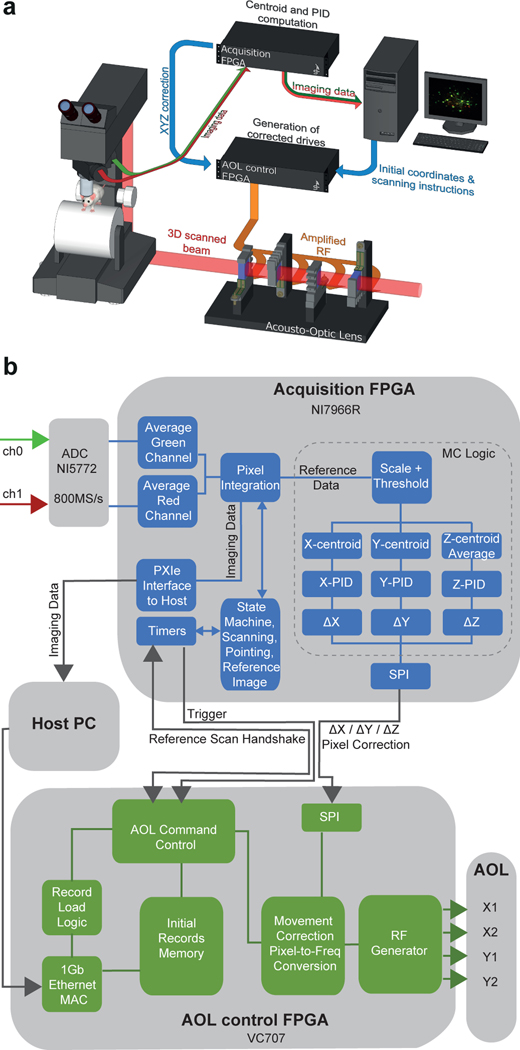
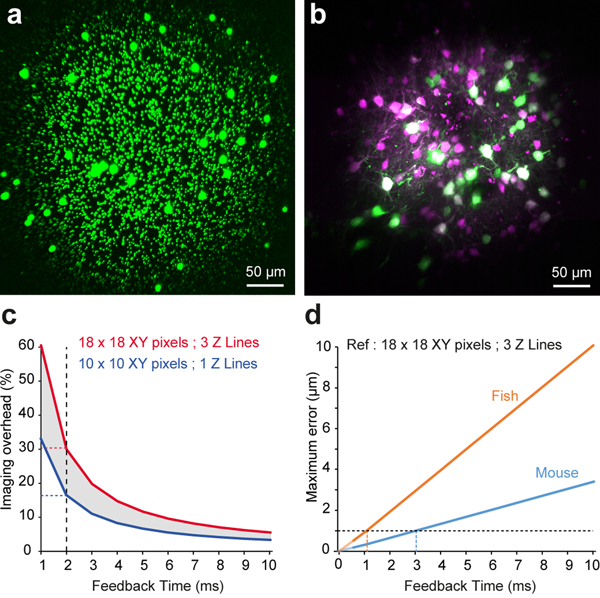
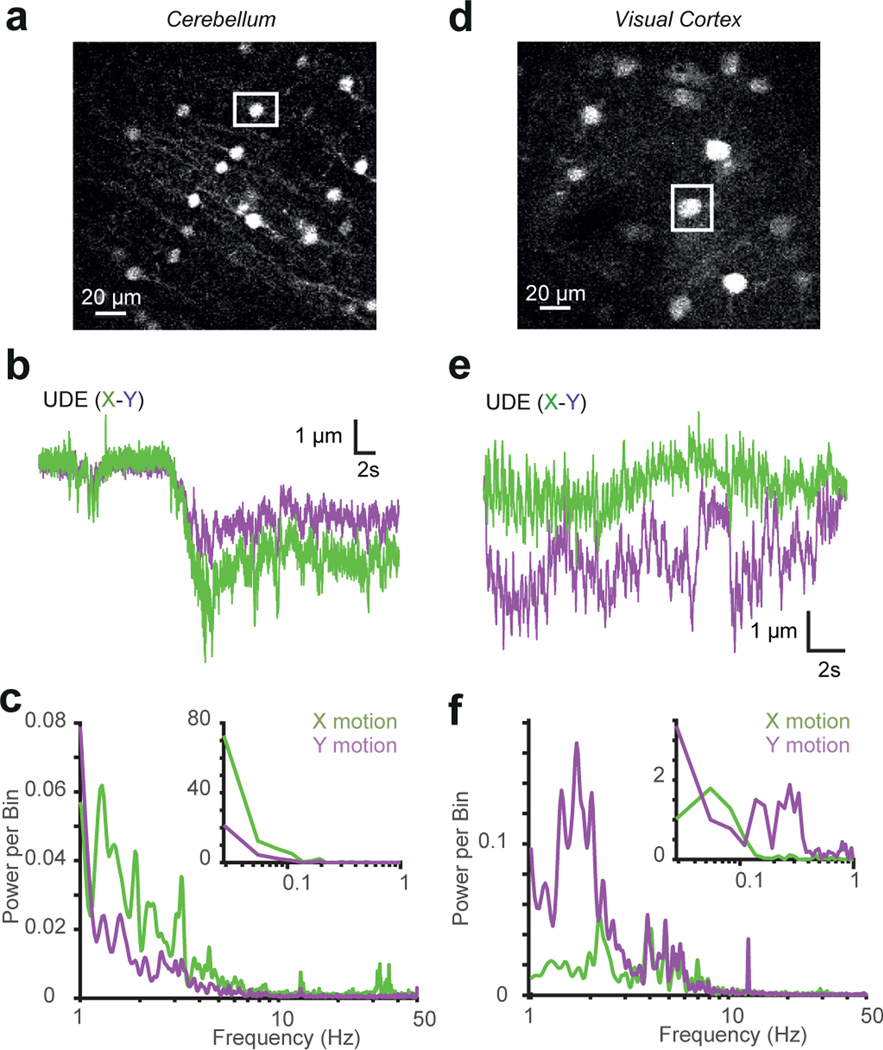
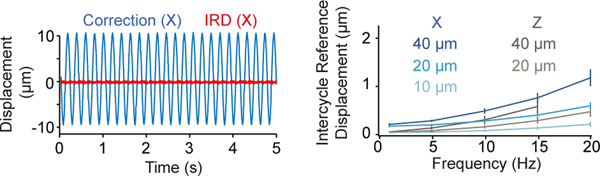
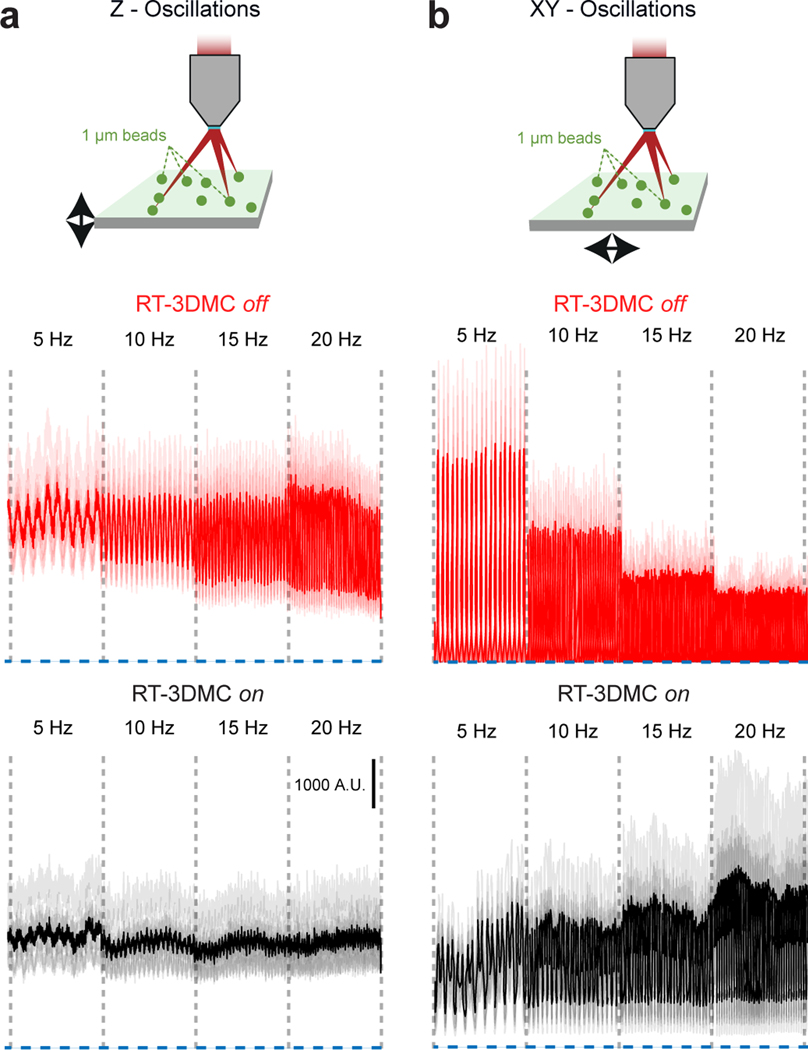
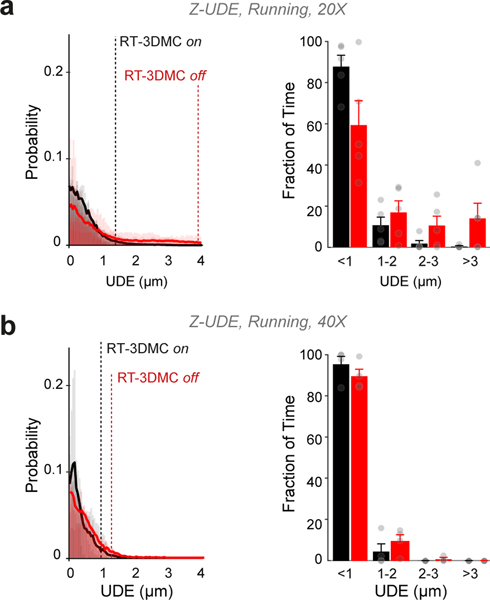
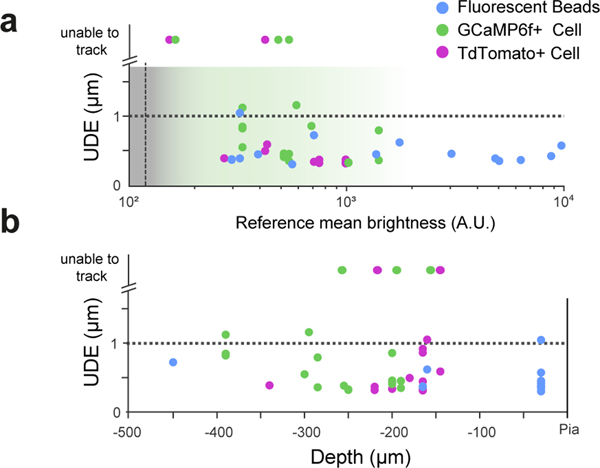
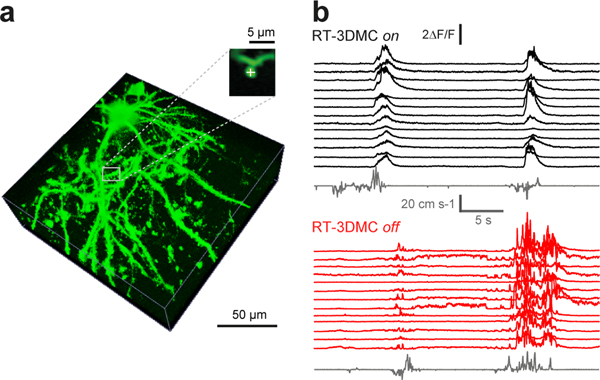
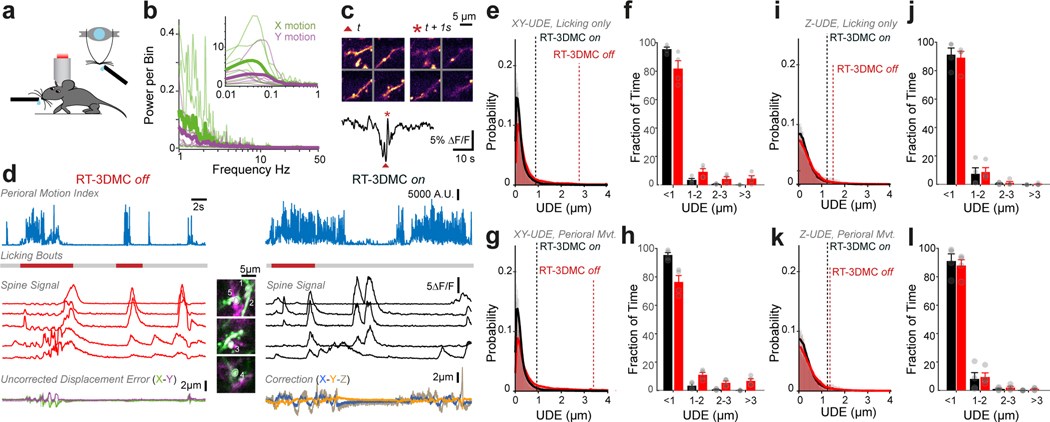
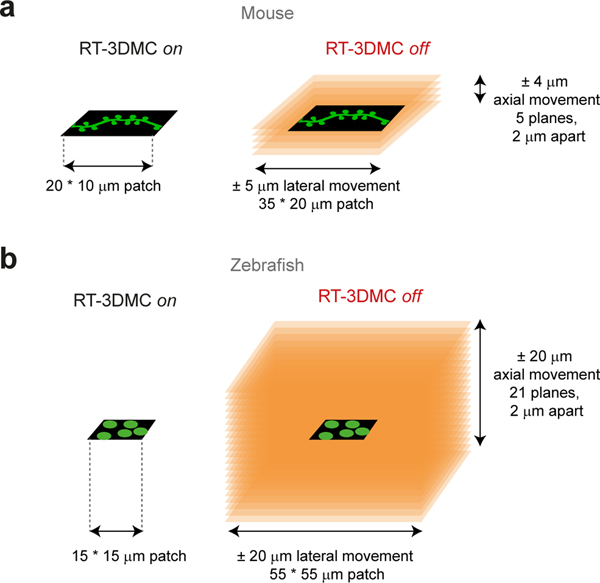
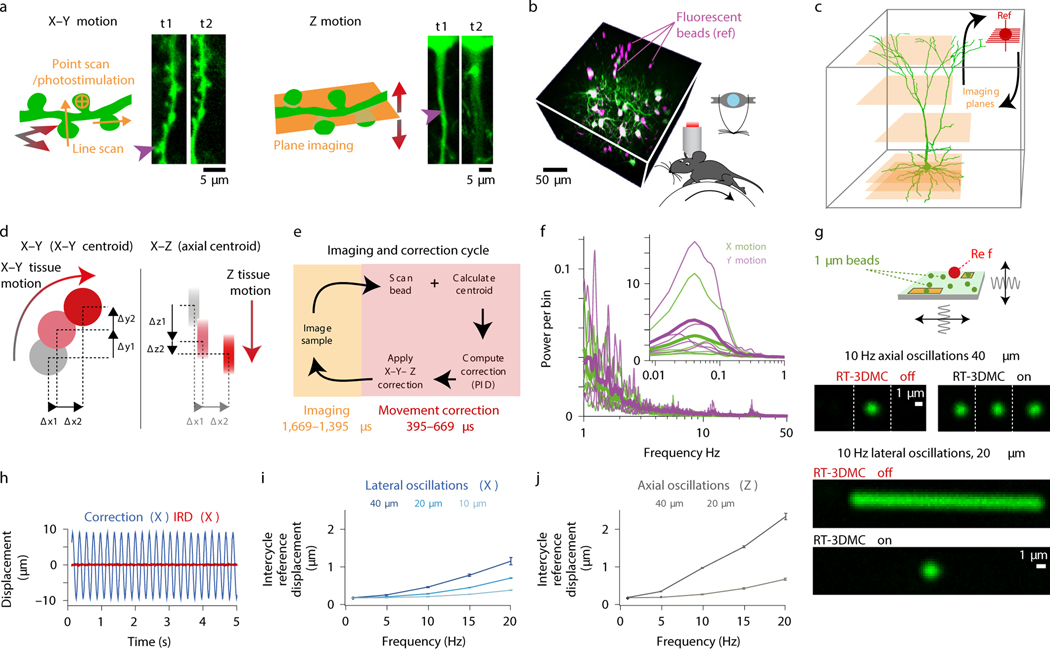
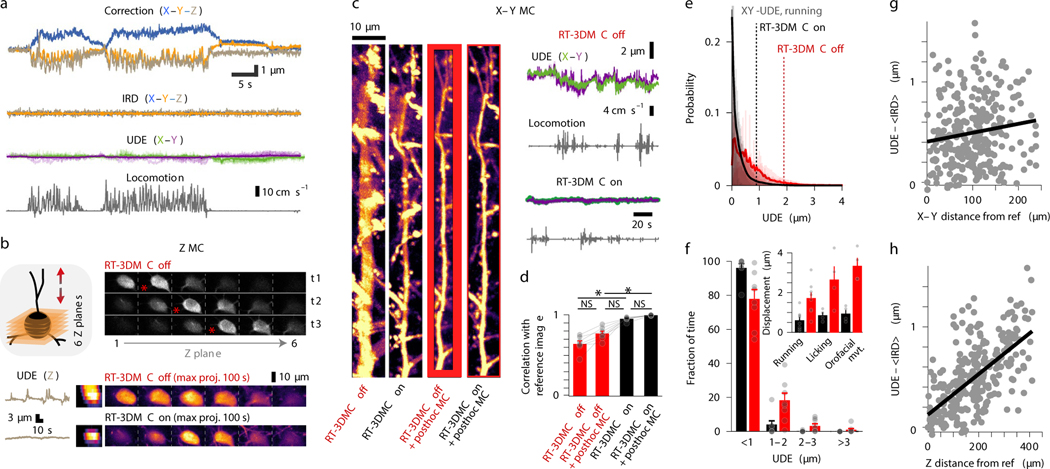
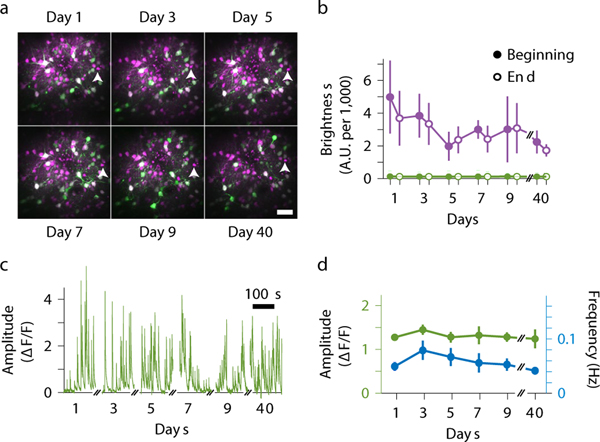
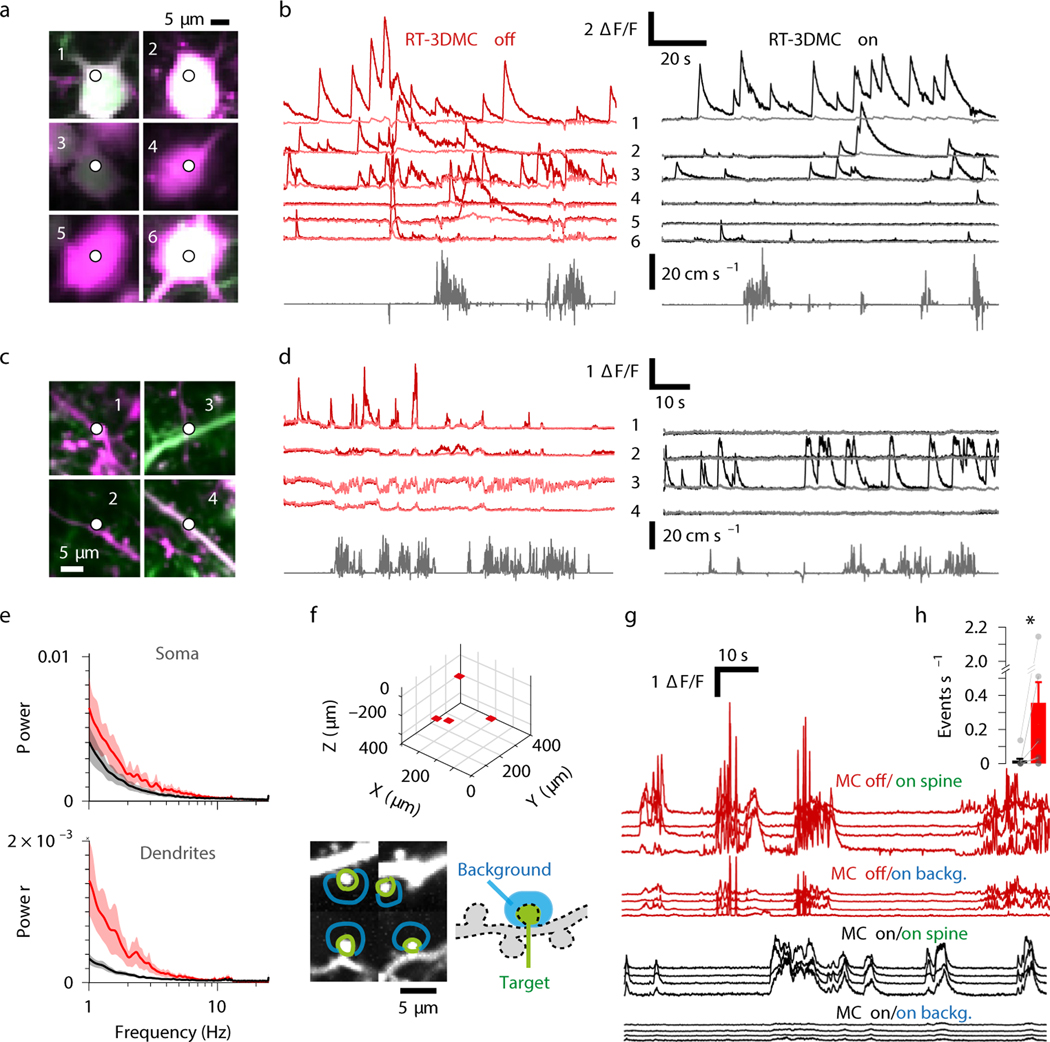
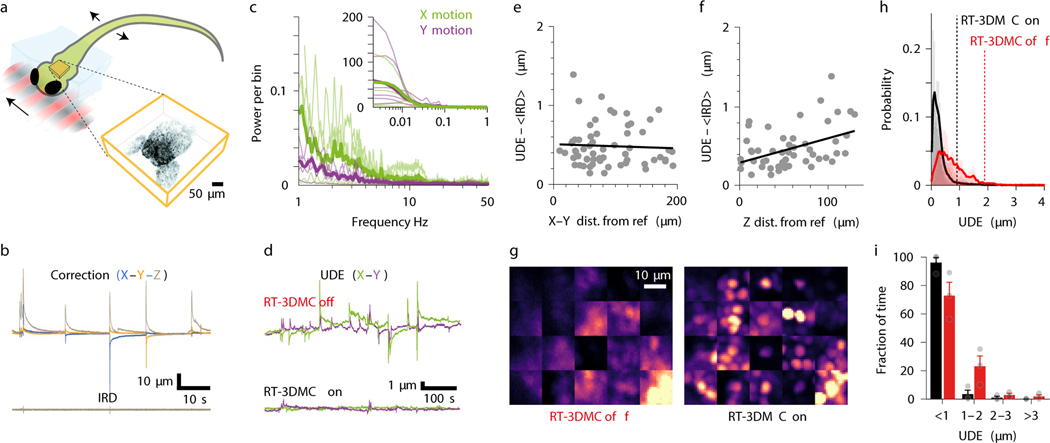
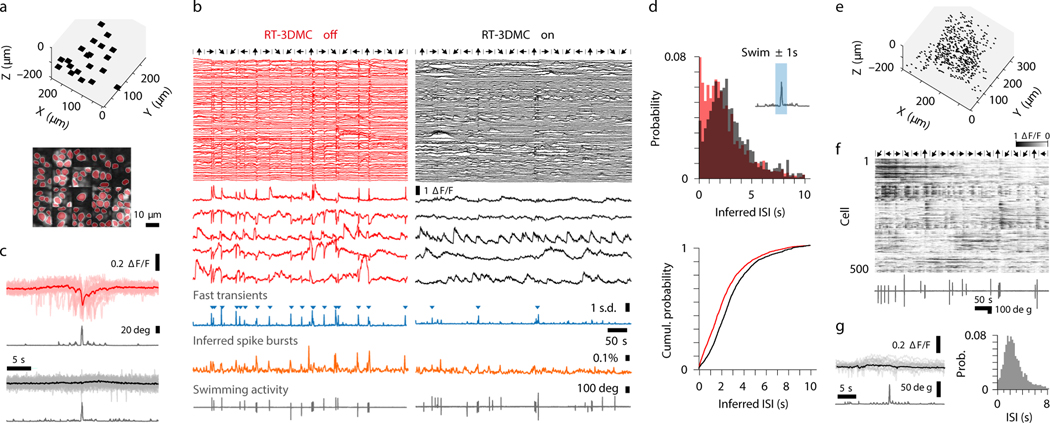
Two-photon microscopy is widely used to investigate brain function across multiple spatial scales. However, measurements of neural activity are compromised by brain movement in behaving animals. Brain motion-induced artifacts are typically corrected using post hoc processing of two-dimensional images, but this approach is slow and does not correct for axial movements. Moreover, the deleterious effects of brain movement on high-speed imaging of small regions of interest and photostimulation cannot be corrected post hoc. To address this problem, we combined random-access three-dimensional (3D) laser scanning using an acousto-optic lens and rapid closed-loop field programmable gate array processing to track 3D brain movement and correct motion artifacts in real time at up to 1 kHz. Our recordings from synapses, dendrites and large neuronal populations in behaving mice and zebrafish demonstrate real-time movement-corrected 3D two-photon imaging with submicrometer precision.


Figures

Extended Data Fig. 1
Extended Data Fig. 1. Two-photon microscope and real time 3D movement correction system
a: Schematic diagram of acousto-optic lens (AOL) microscope and FPGA-based closed loop control and acquisition system for real time 3D movement correction (RT-3DMC). Scanning instructions are sent from the host PC to the AOL controller for imaging and reference scans. The acquisition FPGA estimates the brain movement with centroid analysis and implements a proportional–integral–derivative controller (PID). A fast serial link sends estimated movement information to the controller which uses this to modify the AOL acoustic drives to correct the imaging for brain motion. b: Architecture of acquisition FPGA (blue) and AOL control system FPGA (green) for reference tracking and motion corrected imaging. The acquisition FPGA contains a state machine to integrate pixels from image data and motion tracking reference frames. The averaging logic down-samples four 1.25 ns samples to a single value at 200 MHz and pixel integration adds these over the pixel dwell time (controlled by the state machine). During acquisition the imaging data is sent to the host PC via the PXIe interface. When reference frames are being acquired the pixels are scaled and thresholded prior to a centroid analysis by the movement correction (MC) logic (dotted line box). Updated offset errors were fed to a PID controller that estimated the optimal sub-pixel offset to send to the AOL controller via a serial protocol interface (SPI). The AOL controller is initialised by sending record parameters for each point or line scan via a Gb Ethernet interface. The Record Load Logic parses the record protocol to store the records for reference imaging or functional imaging in on-chip memory. The host configures the AOL controller to perform the desired mode of operation such as random access line scanning or pointing with or without RT-3DMC. On receiving a trigger from the acquisition FPGA, the AOL Command Control logic block on the AOL control FPGA reads records from on-chip memory in the configured pattern. The records are then passed to the Movement Correction Pixel to Frequency Conversion block, which adjusts the records to compensate for 3D motion, when in RT-3DMC mode. The radio frequency (RF) generator block uses the records to generate the required acoustic-frequency drive waveform, which are then sent to the four AOL crystals after amplification. In RT-3DMC mode, an interrupt from the reference scan handshake signal causes a reference frame to be scanned. Also, in RT-3DMC mode, when a new offset is received via the X, Y, Z pixel correction serial interface, the new offset is applied to each record prior to syntheses by the Movement Correction Pixel to Frequency Conversion block, that calculates the required frequency offset for each line scan or point to correctly track the lateral and axial motion.
Extended Data Fig. 2
Extended Data Fig. 2. Real time 3D movement correction performance and AOL microscope field of view
a: Example of 1- and 5-μm fluorescent beads distributed in agarose in a 400×400 μm FOV using the maximum scan angle for the AOL with an Olympus XLUMPlanFLN 20X objective lens. Fall off in intensity of image in corners due to reduced AOL light transmission efficiency at large angles. b: Example of maximum intensity projection of a 400×400×400 μm Z-stack of localised expression of TdTomato (Magenta) and GCaMP6f (Green) in L2/3 pyramidal cells in motor cortex. Note that the expression levels were higher at the center of the FOV, contributing to a larger fall off in brightness (n=4 mice). c: The trade-off between the imaging overhead of RT-3DMC and the feedback period for small 10 ×10 pixel reference patches with a single axial scan and larger 18 ×18 pixel patches with 3 axial scans. The dotted lines show the overhead for a reference scan cycle of 2 ms can vary between 17–30%. d: Relationship between the maximum error and the feedback time in mouse and zebrafish. The graph assumes a maximum brain speed of 0.34 μm/ms in the mouse and 1.02 μm/ms maximum speed for 99.5% of swimming bouts in the zebrafish. To maintain a sub-micrometer error (dotted line) the feedback time should be less than 3 ms and 1 ms in the mouse and zebrafish, respectively.
Extended Data Fig. 3
Extended Data Fig. 3. Characterisation of XY movement and frequency spectrum of brain movement
a: Image of cerebellar molecular layer interneurons expressing GFP used to determine brain movement. The white square shows the selected soma that was used as a reference. b: X (green) and Y (purple) movement of soma. X-axis is roughly aligned to the rostral-caudal plane (similar results were obtained from 9 experiments on n=1 mice). c: Power spectrum analysis of X (green) and Y (purple) motion of cerebellum from head-fixed mouse free to run on a treadmill. Inset shows frequencies of < 1 Hz (similar results were obtained from 9 experiments on n=1 mice). d: Image of pyramidal cells in L2/3 of visual cortex expressing tdTomato. The white frame shows a soma used to track movement. e: as for b but for visual cortex (similar results were obtained from 13 experiments on n=1 mice). f: As for c but for visual cortex (similar results were obtained from 13 experiments on n=1 mice).
Extended Data Fig. 4
Extended Data Fig. 4. Performance of real time 3D movement correction with a 0.8 NA 40X objective
Left: Tracking of a 1-μm diameter bead on a piezoelectric stage driven with a sinusoidal drive at 5 Hz. The absolute reference bead displacement (blue) and the Intercycle Reference Displacement (IRD, red) during RT-3DMC for lateral oscillations (top). Right: Relationship between mean IRD and bead oscillation frequency for different peak-to-peak amplitudes of sinusoidal lateral (blue) and axial (grey) displacements (n=5 different reference beads, mean±SEM). Note that for the lateral motion of 40 μm at 20 Hz, 3 out of 5 reference beads lost tracking.
Extended Data Fig. 5
Extended Data Fig. 5. Performance of real-time 3D movement correction for 3D random access point measurements
a: Top: Schematic diagram of imaging 1-μm fluorescent beads embedded in agarose, mounted on a piezoelectric driven microscope stage oscillating at 5 to 20 Hz in the axial direction. Bottom: Random access point measurements for 10 beads (light traces) in the 3D volume, and the average signal (dark trace) without (red) and with (black) RT-3DMC. Dotted blue line corresponds to background fluorescence level, indicating when the imaging is not pointing at the bead. b: Top: as for a, but for lateral XY oscillations. Bottom: as for a, but for lateral XY oscillations. Without RT-3DMC (red) the beads move in and out of the focused laser beam. With RT-3DMC (black) the laser beam foci move with the beads thereby giving an intensity signal above background. The residual noise with RT-3DMC reflects small residual movements combined with the sharp intensity falloff of 1-μm beads.
Extended Data Fig. 6
Extended Data Fig. 6. Axial correction of movement with 20X and 40X objective lenses
a: Using a 20X lens: Left: Distribution of residual Z displacement as estimated by tracking the center of the cell with RT-3DMC on (black) or off (red) and mean residual movement during periods of locomotion (thick lines, n=5 mice). Dotted lines indicate the distance below which 95% of the values are located. Right: similar to left but grouped into 1 μm bins to quantify large infrequent movements (values indicate mean± SEM). With RT-3DMC, 87.9% of timepoints have a residual error of < 1 μm whereas without RT-3DMC about 59 % of the timepoints < 1 μm (p = 0.004, Wilcoxon test, n=11 experiments, 5 animals). Grey circles indicate individual measurements. b: Using a 40X lens: Left: Distribution of residual Z displacement as estimated by tracking the center of the cell with RT-3DMC on (black) or off (red) and mean residual movement during periods of locomotion (thick lines, n=4 mice). Dotted lines indicate the distance below which 95% of the values are located. Right: similar to left but grouped into 1-μm bins to quantify large infrequent movements (values indicate mean± SEM). With RT-3DMC, 95% of timepoints have a residual error of < 1 μm whereas without RT-3DMC about 89% of the timepoints have mean errors < 1 μm. Grey circles indicate individual measurements.
Extended Data Fig. 7
Extended Data Fig. 7. Comparison of beads and somas as reference objects
a: Comparison of tracking performance for different fluorescence reference objects with different intensities during locomotion (20X objective, n=4 mice); 4-μm, red fluorescent beads (blue), activity dependent GCaMP6f soma (green) and activity independent tdTomato soma (magenta). The grey region indicates the range of fluorescence of the object below which it cannot be resolved, due to a lack of contrast with the background. The transparent green shaded region indicates the dynamic range of GCaMP6f fluorescence and the horizontal black dashed line indicates the 1-μm uncorrected displacement error (UDE) calculated with post-hoc motion detection on 9–10 features. Beads consistently give the best performance and were typically brighter than somata. Tracking was unstable over time or impossible with some soma, indicated on the top of the graph. (n=4 mice) b: Comparison of tracking performance as a function of depth from the pia for different fluorescence reference objects during locomotion (20X objective, n=4 mice). Data as for a (n=4 mice).
Extended Data Fig. 8
Extended Data Fig. 8. Example of 3D random access point measurement from spines
a: Example of high contrast 3D projection of layer 2/3 pyramidal cell and image of a single selected spine (n = 1). b: An example of ΔF/F traces from random access point measurement from 13 spines with (black) and without (red) RT-3DMC together with locomotion speed below each (grey).
Extended Data Fig. 9
Extended Data Fig. 9. Brain movement and real time 3D movement correction during licking and perioral movements
a: Cartoon of head fixed mouse and arrangement of water spout. b: Power spectrum of X (green) and Y (purple) motion of the motor cortex during licking bouts. Green and purple thin lines show the average per mouse and the thick green and purple lines show averages across 6 mice. The inset shows frequencies of < 1 Hz. c: Top: Images of 4 dendrites (15×15 μm) at two timepoints (red star and triangle) during a licking bout illustrating process moving out of focus. Bottom: Average tdTomato signal from the dendrites show intensity fluctuations during licking bout. d: GCaMP6f recordings during licking bouts. Top: Motion index extracted from the perioral region (blue trace). Visually identified licking bouts (red lines below). Centre: GCaMP6f florescence extracted from active spines (grey ROIs in the middle, GCaMP6f in green, TdTomato in magenta) with RT-3DMC off (left, red) or on (right, black). Bottom: XY UDE (for RT-3DMC off, purple and green lines; left) and RT-3DMC (X, Y, Z blue, orange, grey, respectively; right) indicates the amount of brain movement during periods of licking (1 of 4 mice). e: Distribution of XY UDE values with RT-3DMC on (black) or off (red) and mean (thick lines) during periods of licking (n=13 experiments, 4 mice). Dotted lines indicate the distance below which 95% of the values are located. f: Similar to e but grouped into 1 μm bins to quantify large infrequent movements. With RT-3DMC, 95.6% of timepoints have a residual error of < 1 μm whereas only 81.9% without (n=4 mice, mean± SEM). Grey circles indicate individual measurements. g: Same as e for XY UDE during all perioral movements (n=4 mice). h: same as f for XY UDE during all perioral movements. With RT-3DMC, 95.2% of timepoints have a residual error of < 1 μm whereas only 76.3% without. (n=4 mice, mean± SEM). Grey circles indicate individual measurements. i: Same as e for Z UDE during all licking (n=4 mice). j: same as f for Z UDE during licking movements. With RT-3DMC, 91.4% of timepoints have a residual error of < 1 μm whereas 89.3.% without. (n=4 mice, mean± SEM). Grey circles indicate individual measurements. k: Same as g for Z UDE during all perioral movements (n=4 mice). l: same as h for Z UDE during all perioral movements. With RT-3DMC, 91.0% of timepoints have a residual error of < 1 μm whereas 87.8.% without. (n=4 mice, mean± SEM). Grey circles indicate individual measurements.
Extended Data Fig. 10
Extended Data Fig. 10. Speed improvements with real-time 3D movement correction
Schematic diagrams comparing the size of patch versus subvolume needed to keep the ROIs in the imaging frame with RT-3DMC (left) and without RT-3DMC (right): a: Imaging dendrites in a mouse with a 10×25 μm patch with 0.5 μm pixels, each with a dwell time of 0.4 μs takes Ny*(24.5 + Nx*dwell) μs = 890 μs with RT-3DMC on. Without RT-3DMC the dendrite may move both laterally and axially. Assuming lateral motion of ±5 μm and axial motion ±4 μm, imaging would require a volume scan of: 5x(20×35) μm patches taking 10,500 μs, to keep the dendrite within the FOV so that post-hoc XY and Z correction can be applied. That is about 12X slower than with RT-3DMC. b: For zebrafish, patches over selected soma were typically 15×15 μm with a pixel size of 1 μm. With RT-3DMC and a dwell time of 0.4 μs a single patch would take 458 μs. Without RT-3DMC, typical maximum displacements are in the order of ±20 μm both laterally and axially requiring an imaging volume of 55×55×40 μm to monitor soma activity. The time to image a suitable sub-volume to keep the ROI in the FOV is 53,708 μs, about 117 times slower than with RT-3DMC
Figure 1:
Figure 1:. Design and performance of the real-time 3D movement correction system.
a: Schematic of dendrite and fluorescence images at two timepoints (t1, t2) illustrating effect of lateral (left) and axial (right) brain motion. Purple arrows indicate lost features. b: Z-stack of L2/3 cortical pyramidal cells (green) and 4 μm fluorescent beads (magenta) used to track brain motion (left) in head-fixed mice running on a treadmill (right). c: Schematic illustration of interleaving functional imaging (orange planes) and monitoring of a reference object (red). d: Schematic of reference object tracking using lateral (left) and axial (right) centroid analysis performed by the acquisition FPGA. e: Time utilisation of the imaging cycle with RT-3DMC steps in light red and the functional imaging in orange for a 500 Hz update rate. f: Power spectrum of X (green) and Y (purple) motion of motor cortex from head-fixed mice during locomotion (thick lines means, thin lines individual animals, n=5). Inset shows frequencies of < 1 Hz. g: Top: Schematic of the oscillating stage with 1 μm imaged beads (green) and 5 μm reference bead (ref; red). Center: image of the bead without and with RT-3DMC at three timepoints while oscillating axially. Bottom: Maximum projection of a recording during oscillation in the Y direction, without and with RT-3DMC. Single example from 5 experiments. h: Displacement of tracked 4-μm bead (blue) and the IRD (red) during lateral oscillations at 5 Hz for 20X objective (single example from n=4 experiments). i: Relationship between mean IRD and oscillation frequency for different amplitudes of lateral sinusoidal displacements (n=4 beads, mean±SEM). j: Same as i, for axial sinusoidal displacements.
Figure 2:
Figure 2:. Monitoring and compensating for brain movement in behaving mice.
a: Top: Example of displacement estimated by tracking a bead in motor cortex during locomotion (X, blue; Y orange, Z, brown). Center: IRD after RT-3DMC and X and Y UDE (green and purple) from 9 patches across the imaging volume. Bottom: locomotion speed (grey). b: Example of volumetric imaging (schematic left) of a tdTomato-expressing soma during locomotion for 6 XY planes at 3 time points (t1, t2, t3; one of 11 experiments). Cell center corresponds to the brightest image (red star). Bottom: UDE for axial motion (grey) without and with RT-3DMC and corresponding maximum intensity projections (MIPs) in the XZ (left) and XY planes (right) during a 100 s recording. Z motion reduced from 4.4 μm to 0.88 μm. c: Example of MIPs of a pyramidal cell dendrite over 140 s during locomotion, with RT-3DMC off, RT-3DMC on, after post-hoc correction with RT-3DMC off and after post-hoc correction with RT-3DMC on (left to right; one of 7 experiments). Red region cannot be corrected post hoc due to out-of-frame movement. Right panel uncorrected X (green) and Y (purple) UDE for RT-3DMC off (top) and on (bottom). d: Bar chart of the image correlation with the sharpest image (RT-3DMC on + post-hoc MC) for RT-3DMC off, RT-3DMC off with post-hoc MC and RT-3DMC (n=7 experiments, 58 patches, 5 mice, mean±SEM, points show values per experiment). Multiple comparison (Friedman test) indicates improved sharpness between RT-3DMC off vs RT-3DMC on (*p=0.023), and no further improvement between RT-3DMC on and RT-3DMC on + post-hoc (p=0.884). e: Distribution of UDE values with RT-3DMC on (black) or off (red) and mean (thick lines) during locomotion (n=20 experiments, 8 mice). Dotted lines show distance below which 95% of the values are located. f: Similar to e but grouped into 1 μm bins to quantify large infrequent movements. Inset shows the distance below which 95% of UDEs fall for different behaviours with (black) and without (red) RT-3DMC (p = 1 × 10⁻⁴, Friedman test; running, n=8 mice; licking, n=4 mice; perioral movement n=4 mice, mean±SEM, points show individual values). g: Difference between UDE and time-averaged IRD as a function of XY distance from the reference bead during running. Regression line (black; slope = 0.09 μm per 100 μm from the reference; R2 = 0.02, n=305 patches, n=20 experiments, 8 mice). h: As for g but showing the axial (Z) distance from the reference bead. Regression line (black; slope = 0.21 μm per 100 μm, R2 = 0.43).
Figure 3:
Figure 3:. Longitudinal imaging using real-time 3D movement correction
a: Example of maximum intensity projections of Z stacks from the motor cortex expressing GCaMP6f (green) and tdTomato (magenta) after > 1 hour imaging sessions of the same region every other day for 9 days (4 mice) and a month later (3 mice). The white arrowhead indicates the same reference bead chosen for RT-3DMC over time for each mouse. b: Mean fluorescence of red reference beads used for RT-3DMC (magenta) and surrounding neuropil fluorescence (green) at the beginning (filled points) and end (unfilled points) of the experiment (n=4 animals for days 1–9, n=3 for day 40, Values indicate mean±SEM). c: Example calcium transients from the same pyramidal cell somata expressing GCaMP6f, with RT-3DMC on (1 of 28 cells). d: Mean amplitude (green) and mean frequency (blue) of GCaMP6f fluorescence transients in the 28 identified neurons imaged during the longitudinal study for RT-3DMC on (Mean ΔF/F amplitude p=0.5, frequency, p=0.12, n=28 cells). Values indicate mean±SEM.
Figure 4:
Figure 4:. High-speed recordings of somatic, dendritic and spine activity during locomotion.
a: Location of 3D random access point measurements (3D-RAP) on six selected pyramidal cell somata expressing GCaMP6f (green) and tdTomato (magenta) in the motor cortex. b: Example of 3D-RAP measurements of GCaMP6f activity from the somas in panel a, with RT-3DMC off (left/red) and on (right/black). The 6 pale-red (MC off) and grey traces (MC on) show ΔF/F for activity-independent tdTomato. Bottom traces show the running speed (one of 4 mice). c: As for a but for 4 selected dendrites, imaged with a 40X objective. d: Same as b but for the 4 dendrites in panel c (one of 4 mice). e: Mean power spectrum of tdTomato fluorescence intensity from soma (top) and dendrites (bottom) during running bouts with RT-3DMC off (red) and on (black) (n=4 animals, 32 structures). Shaded area indicates SEM. f: Imaging volume with 3D location (top) of 4 imaged ROIs with dendritic spines (red patches) on a layer 2/3 pyramidal cell expressing GCaMP6f in motor cortex. Bottom: Imaged patches with regions on (green) and adjacent to (blue) the spines from which functional signals were extracted. g: Example of ΔF/F traces from green and blue regions in panel f when RT-3DMC was off (top, red) or on (below, black; one of 8 animals). h: Average rate ±SEM of false positive events (peak > 2X background in the dark background area) during locomotion with RT-3DMC on (black; 0.01±0.06 events s−1) or off (red; 0.36±0.13 events s−1), (*) p=0.04, Wilcoxon test, n=8 animals, points show individual values.
Figure 5:
Figure 5:. Monitoring and compensating for brain movement in partially tethered larval zebrafish.
a: Cartoon of zebrafish larva with the rostral body section embedded in agarose (light blue). Inset shows a RT-3DMC Z-stack image of the forebrain expressing nuclear-localized GCaMP6s within the imaging volume. b: Example of displacement of brain during swimming bouts triggered by the moving gratings measured by tracking a bead (X, blue; Y orange; Z, brown). Bottom trace shows Intercycle Reference Displacement (IRD) in X, Y and Z with RT-3DMC on (one of 3 zebrafish). c: Power spectrum analysis of X (green) and Y (purple) brain motion during an experiment with bouts of swimming. Individual animals (thin lines), average from 5 zebrafish (thick lines). Inset shows spectra for frequencies < 1 Hz. d: Mean UDE from 20 patches in X and Y directions (purple) with RT-3DMC off (top) and on (bottom). e: Difference between UDE and time-averaged IRD as a function of XY distance from the reference bead. Solid line indicates linear fit (0.03 μm per 100 μm, R2 = 0.00, n=60 patches, 3 zebrafish). f: Same as e but axially. Slope of fit 0.31 μm per 100 μm, R2 = 0.18. g: Time-averaged images of neurons distributed throughout the forebrain in twenty imaging patches during swimming bouts without (left) and with (right) RT-3DMC (n=1 fish). h: Distribution of UDEs with RT-3DMC on (black) or off (red) and mean residual movement (thick lines, n=3 fish). Dotted lines indicate the distance below which 95% of the values are located. i: Similar to h but grouped into 1 μm bins to quantify large infrequent movements. With RT-3DMC, 95.5% of timepoints had a residual error of < 1 μm, compared to 72.4% without RT-3DMC (mean±SEM, points show individual values).
Figure 6:
Figure 6:. Functional imaging in behaving zebrafish larvae.
a: Location of 20 imaging patches distributed within the volume (top), image of 90 neurons monitored for functional imaging (bottom). b: Nuclear-localised GCaMP6s activity extracted from patches of cells in panel a without (left, red) and with RT-3DMC (right, black), with 5 enlarged examples below. Direction of moving gratings for 10 s every 30 s indicated by black arrows. Averaged fast transient (blue traces, triangles indicate transients > 1 sd) without and with RT-3DMC and averaged inferred spike bursts (orange traces, probability of having an inter-spike interval < 2s). Bottom: tail motion (grey traces). c: Average ΔF/F response aligned to swim bouts, for neurons in b without (pale red, individual means; dark red, overall average) and with RT-3DMC (gray, individual means; black, overall average), together with averaged absolute value of tail angle (grey) below each. d: Top: Distribution of inter-spike Intervals from inferred spike trains with (black) and without (red) RT-3DMC, for spikes occurring ±1s around swimming bouts (inset, light blue region). Interval was computed between the detected spike and the preceding one. Bottom: cumulative probability of the ISIs with RT-3DMC off (red) or on (black) for all neurons (n=3 fish). e: Location of 500-point measurements from neurons expressing nuclear-localised GCaMP6s distributed across the forebrain (n= 1 fish). f: GCaMP6s fluorescence traces for 500 neurons using 3D-RAP and RT-3DMC together with tail motion (grey traces, bottom) for 10 minutes. Black arrows indicate direction of visual grating. Neurons were sorted for visualisation purpose using the unsupervised GenLouvain clustering method. g: Left: Same as c, but for 3D-RAP measurements, same animal as in c. Right: Same as d, but for 3D-RAP with RT-3DMC on, swim±1s.

References

    1. Helmchen F. & Denk W. Deep tissue two-photon microscopy. Nat. Methods 2, 932–940 (2005). - PubMed
    1. Svoboda K. & Yasuda R. Principles of Two-Photon Excitation Microscopy and Its Applications to Neuroscience. Neuron 50, 823–839 (2006). - PubMed
    1. Froudarakis E. et al. Population code in mouse V1 facilitates readout of natural scenes through increased sparseness. Nat. Neurosci 17, 851–857 (2014). - PMC - PubMed
    1. Nadella KMNS et al. Random-access scanning microscopy for 3D imaging in awake behaving animals. Nat. Methods 13, 1001–1004 (2016). - PMC - PubMed
    1. Iyer V, Hoogland TM & Saggau P. Fast functional imaging of single neurons using random-access multiphoton (RAMP) microscopy. J. Neurophysiol 95, 535–545 (2006). - PubMed

Methods-only References

    1. Vladimirov N. et al. Light-sheet functional imaging in fictively behaving zebrafish. Nat. Methods 11, 883–884 (2014). - PubMed
    1. Lister JA, Robertson CP, Lepage T, Johnson SL & Raible DW Nacre Encodes a Zebrafish Microphthalmia-Related Protein That Regulates Neural-Crest-Derived Pigment Cell Fate. Development 126, 3757–3767 (1999). - PubMed
    1. Bianco IH & Engert F. Visuomotor transformations underlying hunting behavior in zebrafish. Curr. Biol 25, 831–846 (2015). - PMC - PubMed
    1. Brainard DH The Psychophysics Toolbox. Spat. Vis (1997). doi:10.1163/156856897X00357 - DOI - PubMed
    1. Bianco IH, Kampff AR & Engert F. Prey capture behavior evoked by simple visual stimuli in larval zebrafish. Front. Syst. Neurosci 5, 1–13 (2011). - PMC - PubMed

Publication types

LinkOut - more resources