. 2020 Jul;27(7):615-624.
doi: 10.1038/s41594-020-0430-8. Epub 2020 Jun 1.

A structurally minimized yet fully active insulin based on cone-snail venom insulin principles

Affiliations

A structurally minimized yet fully active insulin based on cone-snail venom insulin principles

Xiaochun Xiong et al. Nat Struct Mol Biol. 2020 Jul.

Erratum in

Abstract

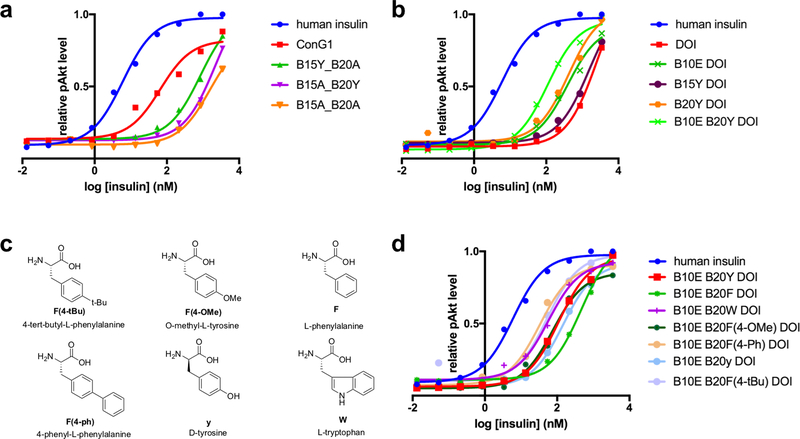
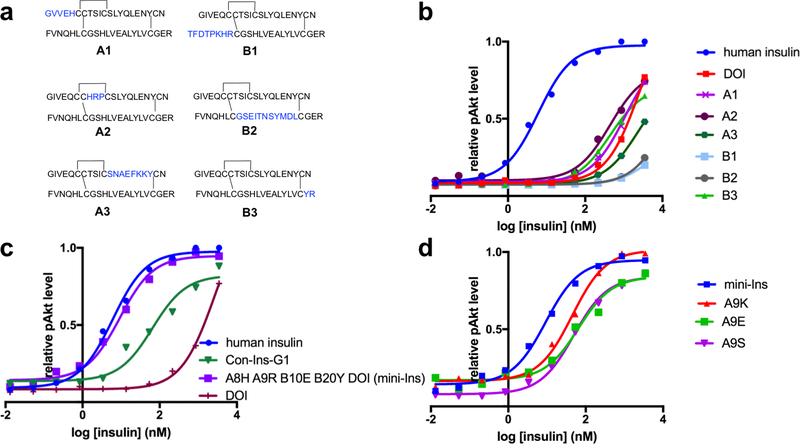
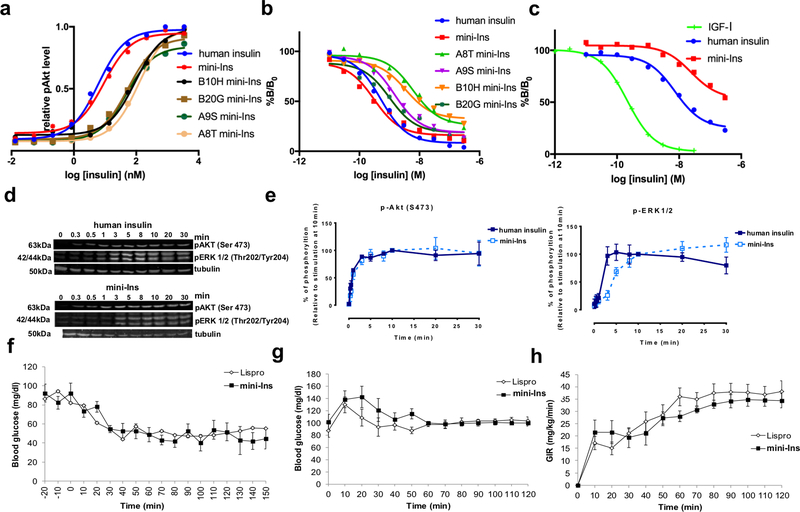
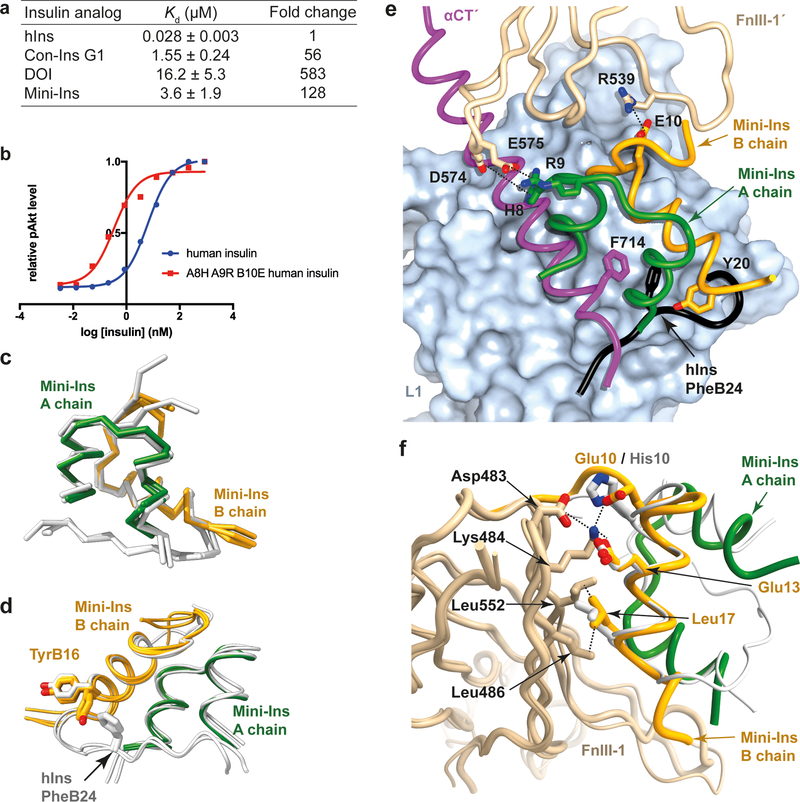
Human insulin and its current therapeutic analogs all show propensity, albeit varyingly, to self-associate into dimers and hexamers, which delays their onset of action and makes blood glucose management difficult for people with diabetes. Recently, we described a monomeric, insulin-like peptide in cone-snail venom with moderate human insulin-like bioactivity. Here, with insights from structural biology studies, we report the development of mini-Ins-a human des-octapeptide insulin analog-as a structurally minimal, full-potency insulin. Mini-Ins is monomeric and, despite the lack of the canonical B-chain C-terminal octapeptide, has similar receptor binding affinity to human insulin. Four mutations compensate for the lack of contacts normally made by the octapeptide. Mini-Ins also has similar in vitro insulin signaling and in vivo bioactivities to human insulin. The full bioactivity of mini-Ins demonstrates the dispensability of the PheB24-PheB25-TyrB26 aromatic triplet and opens a new direction for therapeutic insulin development.


Figures

Extended Data Fig. 1:
Extended Data Fig. 1:. Stereo views of sample (2mFobs-DFcalc) electron density for the structures presented in the manuscript
(a) L1 domain residues 32–35 within monomer 1 of the Con-Ins-G1-bound μIR + Fv 83–7 crystal structure. (b) L1 domain residues 32–35 within monomer 1 of the human-insulin- bound μIR + Fv 83–7 crystal structure. (c) B-chain residues 14–16 within monomer 1 of the mini-Ins crystal structure. All maps are contoured at the 1.0 σ level.
Extended Data Fig. 2:
Extended Data Fig. 2:. Sedimentation equilibrium analysis of mini-Ins
Sedimentation equilibrium analysis of mini-Ins was performed at 35,000 rpm with the best fit (curves) to a single species of apparent mass 5080 ± 45 Da. The molecular weight of mini-Ins is 5067. Detailed procedure can be found in reference: Menting et al. (2016). A minimized human insulin-receptor-binding motif revealed in a Conus geographus venom insulin. Nature Structural & Molecular Biology, 23(10), 916. Source data are available with the paper online.
Extended Data Fig. 3:
Extended Data Fig. 3:. Antibody response of 21-day immunization of bovine insulin, human insulin and mini-Ins.
Data is the average of 4 independent animals. Error bar represents S.E.M. Source data are available with the paper online.
Extended Data Fig. 4:
Extended Data Fig. 4:. Isothermal titration calorimetry.
Representative ITC thermograms for the titration against IR485 + IR-A704−719 αCT peptide of (a) mini-Ins; (b) hIns; (c) Con-Ins G1and (d) human DOI.
Extended Data Fig. 5:
Extended Data Fig. 5:. Separation of insulin and IR amino acid pairs at the secondary binding site during 1 ns MD simulation
(a) Distance between GluB10 carboxylate carbon (Cδ) and Arg539 guanyl carbon (Cζ). This salt pair remain closely associated (~4 Å) throughout the simulation. (b) Distance between HisA8 imidazole Nε2 nitrogen and Asp574 carboxylate carbon. (c) Distance between ArgA9 guanyl carbon and Glu575 carboxylate carbon (Cγ): this salt bridge forms (separation ~4 Å) following ~6ns MD. The salt bridge is observed to dissociate and reform several times throughout the simulation. Dissociation of this interaction correlates with increase in separation of the HisA8-Asp574 pair, reflecting mobility in the Phe572-to-Tyr579 loop of the FnIII-1.
Figure 1.
Figure 1.. Overview of crystal structures of Con-Ins-G1-bound Fv-83–7-bound μIR and of human-insulin-bound Fv-83–7-bound μIR.
(a) Structure of monomer 1 of Con-Ins-G1-bound Fv-83–7-bound μIR. (b) Pseudo-222-symmetric assembly of the four human-insulin-bound Fv-83–7-bound μIR moieties within the crystallographic asymmetric unit. (c) Overlay of monomer 1 of Con-Ins-G1-bound μIR with monomer 1 of human-insulin-bound μIR, based on the common domain L1 (light blue). The displaced A-chain C-terminal helix of Con-Ins G1 and the displaced C-terminal region of αCT within the complex are indicated with arrows. A chains are colored green and B chains orange, with those of human insulin in lighter shades than those of Con-Ins G1.
Figure 2 .
Figure 2 .. Structural biology of Con-Ins G1 and human insulin within their respective μIR co-complexes.
(a) Interaction of Con-Ins G1 A chain with the μIR. (b) Interaction of human insulin A chain with the μIR. (c) Interaction of Con-Ins G1 B chain with the μIR . (d) Interaction of human insulin B chain with the μIR. Molecular surfaces in panels (a) to (d) are those associated with residues buried or partly buried within the respective interaction; the respective A chains are omitted for clarity in panels (c) and (d). (e) Stereo view of an overlay of Con-Ins G1 in its μIR-bound form (monomer 1) and its receptor-free form (PDB entry 5JYQ), viewed from the surface of domain L1 outwards. Green: Con-Ins G1 A chain, receptor-bound; orange: Con-Ins G1 B chain, receptor bound; grey: Con-Ins G1, receptor-free (PDB entry 5JYQ). Selected residues showing major rotameric differences are labelled.
Figure 3.
Figure 3.. Side-chain substitution of human insulin PheB24 by Con-Ins G1 TyrB15.
(a) Packing of human insulin PheB24 within the human-insulin-bound μIR. (b) Packing of Con-Ins G1 TyrB15 within the Con-Ins G1-bound μIR. (c) Cavities surrounding human insulin PheB24 within the human-insulin-bound μIR. (d) Cavities surrounding Con-InsG1 PheB15 within Con-Ins G1-bound μIR. Within all panels, colors are as follows: human insulin A chain light green, human insulin B chain tan, Con-InsG1 A chain orange, Con-Ins B chain green, αCT magenta (violet in human insulin complex) and L1 light blue. Human insulin PheB24 and Con-Ins G1 TyrB15 are in brown and their surrounding cavities in transparent yellow. Cavities computed using SURFNET within CHIMERA.
Figure 4.
Figure 4.. Structure-activity studies on Con-Ins G1 and DOI.
(a) Alanine scanning studies of Con-Ins G1 TyrB15 and TyrB20. (b) Mutation studies of DOI LeuB15 and GlyB20 wherein these residues were replaced by tyrosine residues. (c,d) Exploration of B20 mutations on DOI. For all analogs, each data point represents the mean of four assays. Error bars (s.e.m.) are smaller than the marker size. Source data for panels a, b and d are available with the paper online.
Figure 5.
Figure 5.. Structure-activity studies on DOI.
(a,b) Exploration of Con-Ins G1-DOI hybrid peptides created by inserting Con-Ins G1 segments into the DOI skeleton. (c) Identification of mini-Ins, [HisA8, ArgA9, GluB10, TyrB20]-DOI, by incorporating four mutations from Con-Ins G1 into DOI. (d) Mutational studies of DOI at SerA9. For all analogs, each data point represents the mean of four assays. Error bars (s.e.m.) are smaller than the marker size. Source data for panels b, c and d are available with the paper online.
Figure 6.
Figure 6.. Biochemical, in vitro and in vivo characterization of mini-Ins.
(a) Insulin receptor activation of mini-Ins and analogs. Each data point represents the mean of four assays for all analogs. (b) Insulin receptor (B isoform) affinity assay of mini-Ins, human insulin and analogs. For all analogs, each data point represents the mean of three assays (except for four for human insulin and two for SerA9 mini-Ins), with n = 3 technical replicates for each assay. Error bars (s.e.m.) are smaller than the marker size. (c) Comparison of IGF-1R affinity for IGF-I, human insulin and mini-Ins. Each data point represents the mean of three assays for all analogs. Error bars (s.e.m.) are smaller than the marker size. Results in (b) and (c) are expressed as a percentage of binding in the absence of competing ligand. (d,e) Evaluation of Akt and ERK1/2 signaling activation by human insulin and mini-Ins. Data points in panel (e) represent the average of three independent experiments and error bars the standard deviation of the data. (f) Intraperitoneal administration of mini-Ins and insulin lispro in healthy rats. (g,h) Euglycemic-hyperinsulinemic clamp studies to evaluate the in vivo insulin action of mini-Ins and insulin lispro in rats. Source data for panels a-c and e-h are available with the paper online.
Figure 7.
Figure 7.. Probing the interaction of mini-Ins with hIR.
(a) Isothermal titration calorimetry studies of various insulin analogs binding to the primary binding site of hIR. Reported Kd values are the weighted mean of the Kd values of individual technical replicates, plus the standard error of that mean (see Methods for further detail). (b) Positive effects of mutations on human insulin. (c) Superposition of the three monomers of mini-Ins (colored) within the asymmetric unit of its crystal structure compared with those within the asymmetric unit of the human insulin crystal structure (white; PDB entry 1MSO). (d) Rotameric variation between TyrB16 within the mini-ins and human insulin crystal structures. Monomers overlaid as in panel (c). (e) Model of mini-Ins in complex with primary and secondary binding site elements of hIR. Domain L1 is shown as surface (powder blue), with ribbon representations of the αCT segment (magenta), mini-Ins A chain (green), mini-Ins B chain (orange) and domain FnIII-1’ (tan). The C-terminal segment of the human insulin B chain (obtained by superimposition of hIns.μIR.Fv83–7) is shown in black, highlighting how TyrB20 of mini-Ins approaches the key hydrophobic pocket occupied by human insulin PheB24. Specific interactions between mini-Ins with FnIII-1’ are highlighted. (f) Model of mini-Ins in complex with transient binding site on domain FnIII-1 of hIR, overlaid human insulin (white) as visualized in PDB entry 6PXV. Mini-Ins and FnIII-1 colors are as in panel (e). Source data for panels a and b are available with the paper online.

References

    1. Safavi-Hemami H et al. Specialized insulin is used for chemical warfare by fish-hunting cone snails. Proc. Natl. Acad. Sci. U. S. A 112, 1743–1748 (2015). - PMC - PubMed
    1. Menting JG et al. A minimized human insulin-receptor-binding motif revealed in a Conus geographus venom insulin. Nat. Struct. Mol. Biol 23, 916–920 (2016). - PubMed
    1. Carpenter FH Relationship of structure to biological activity of insulin as revealed by degradative studies. Am. J. Med 40, 750–758 (1966). - PubMed
    1. Gradel AKJ et al. Factors Affecting the Absorption of Subcutaneously Administered Insulin: Effect on Variability. J. Diabetes Res 2018, 1205121 (2018). - PMC - PubMed
    1. Maikawa CL et al. Stable Monomeric Insulin Formulations Enabled by Supramolecular PEGylation of Insulin Analogues. Adv. Ther. (Weinh) 3(2020). - PMC - PubMed

Publication types

MeSH terms