. 2020 Jun;582(7810):89-94.
doi: 10.1038/s41586-020-2288-7. Epub 2020 May 13.

C9orf72 suppresses systemic and neural inflammation induced by gut bacteria

Affiliations

C9orf72 suppresses systemic and neural inflammation induced by gut bacteria

Aaron Burberry et al. Nature. 2020 Jun.

Abstract

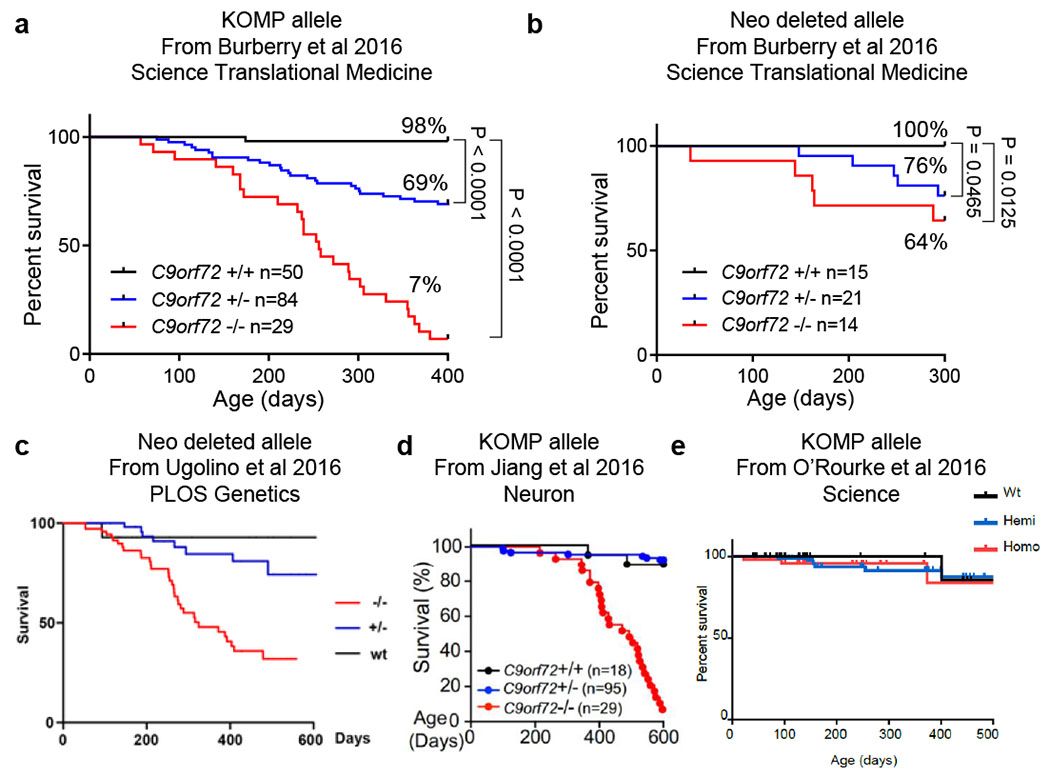
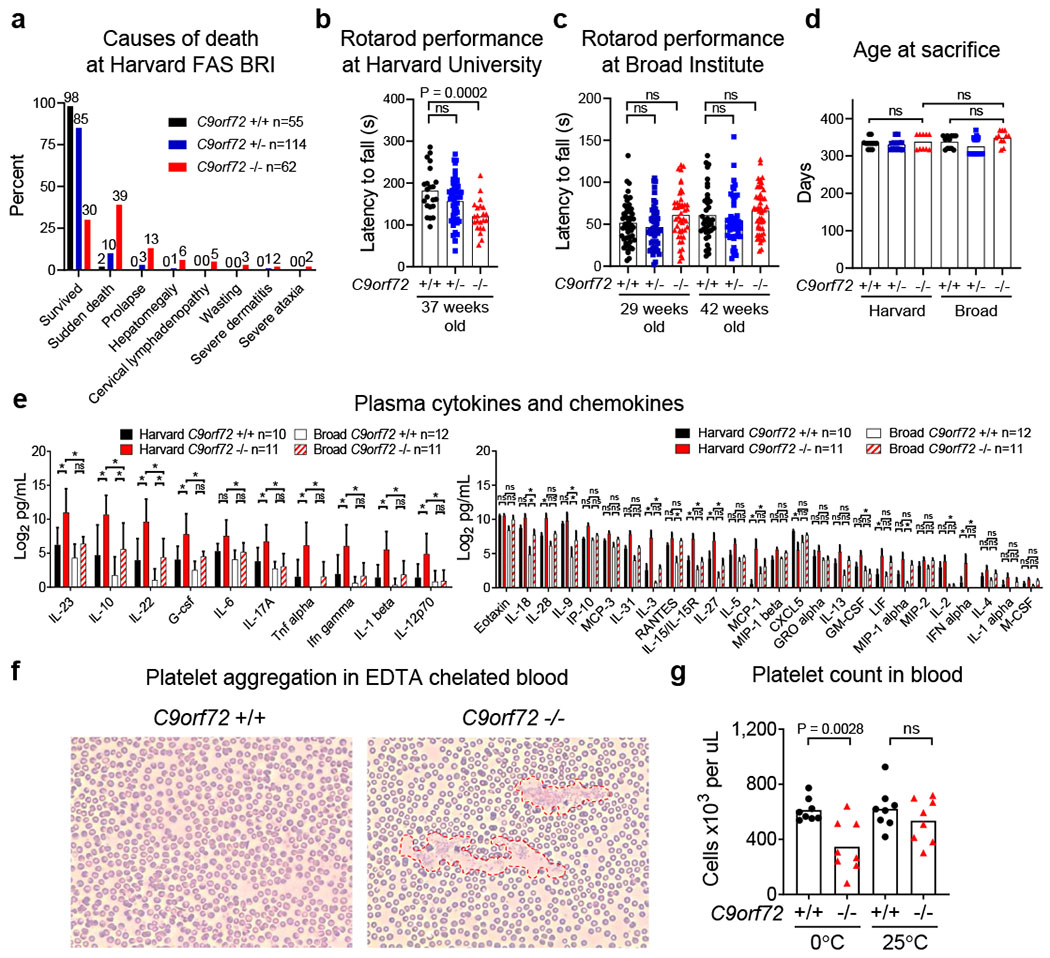
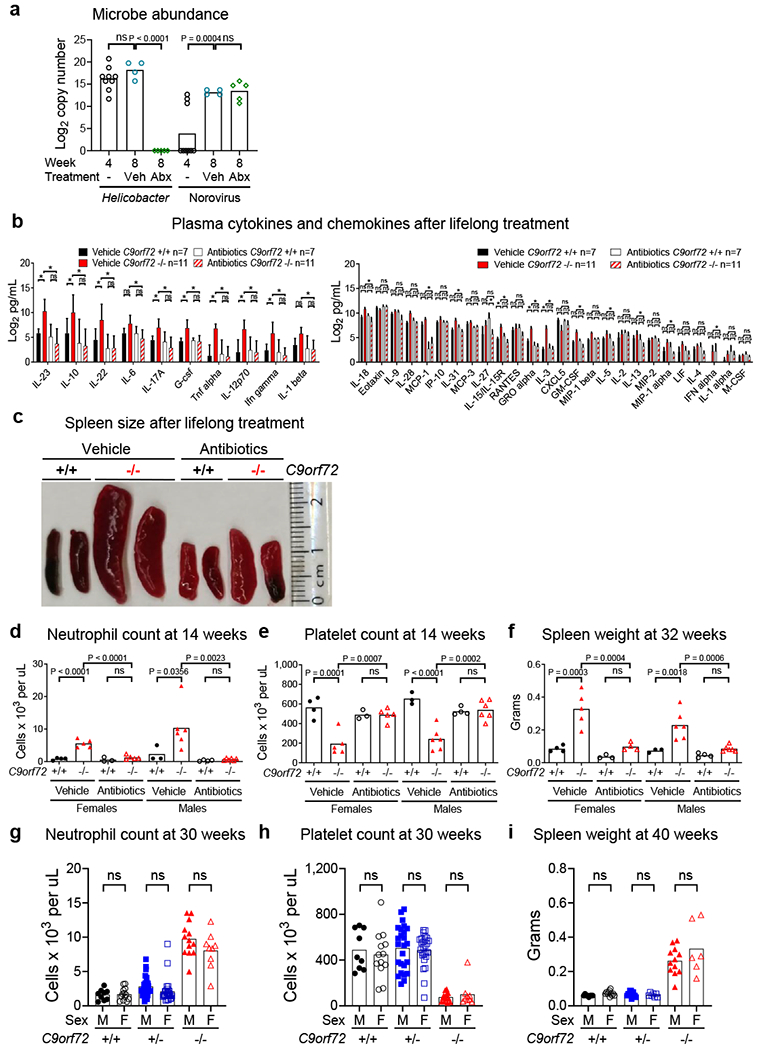
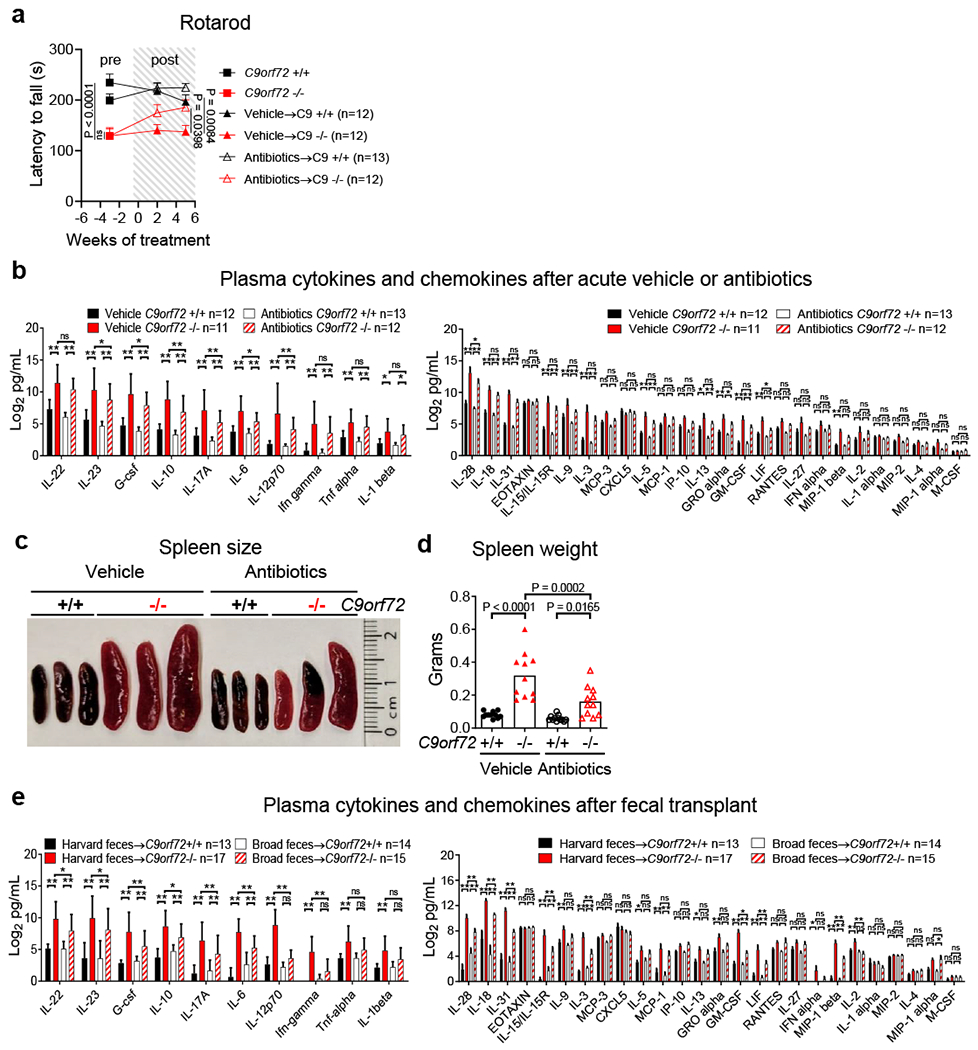
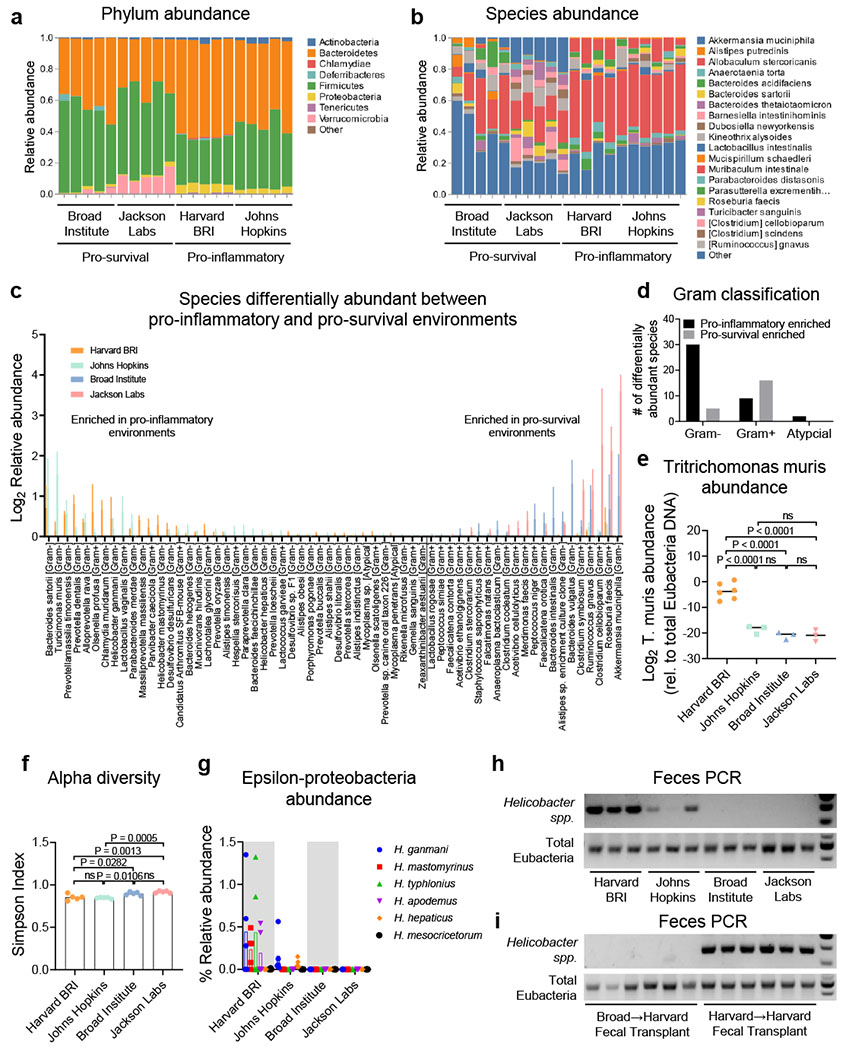
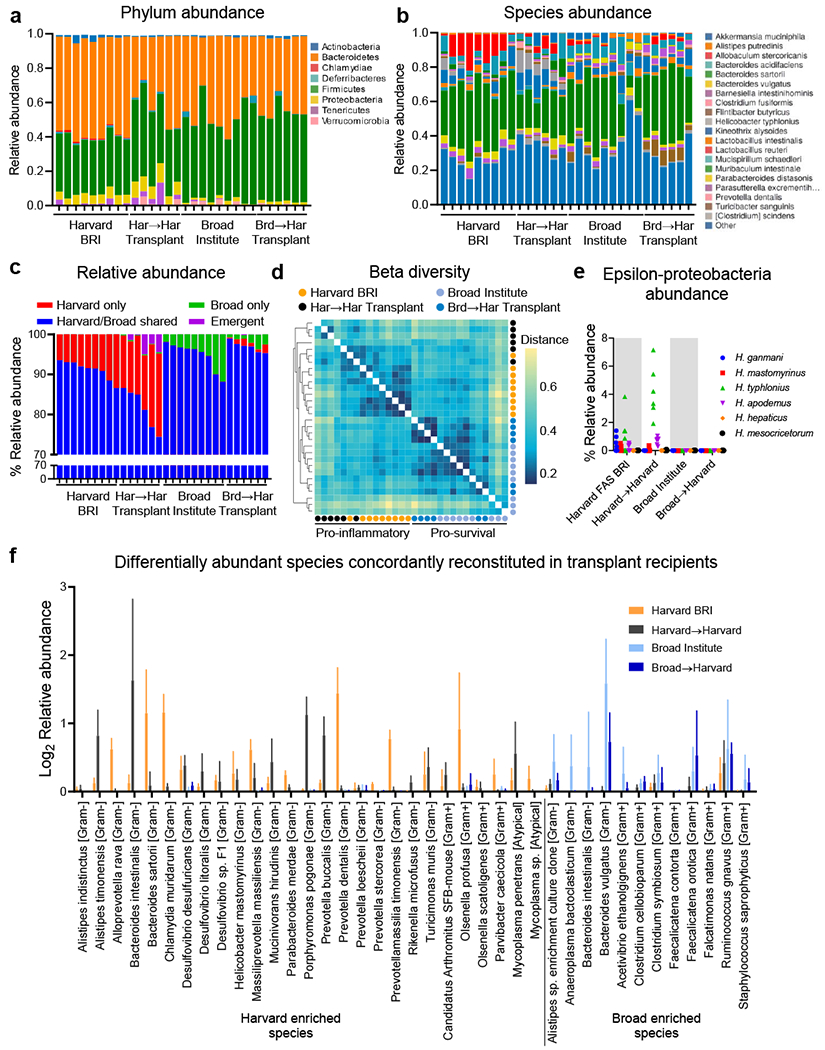
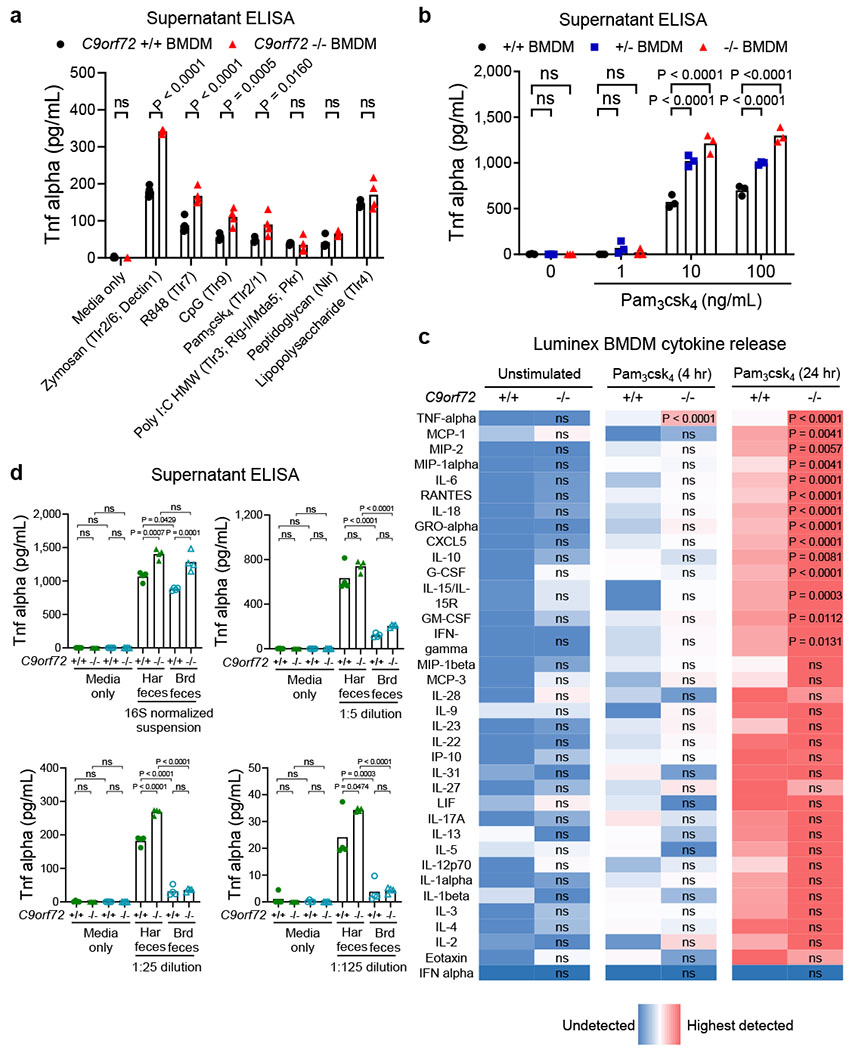
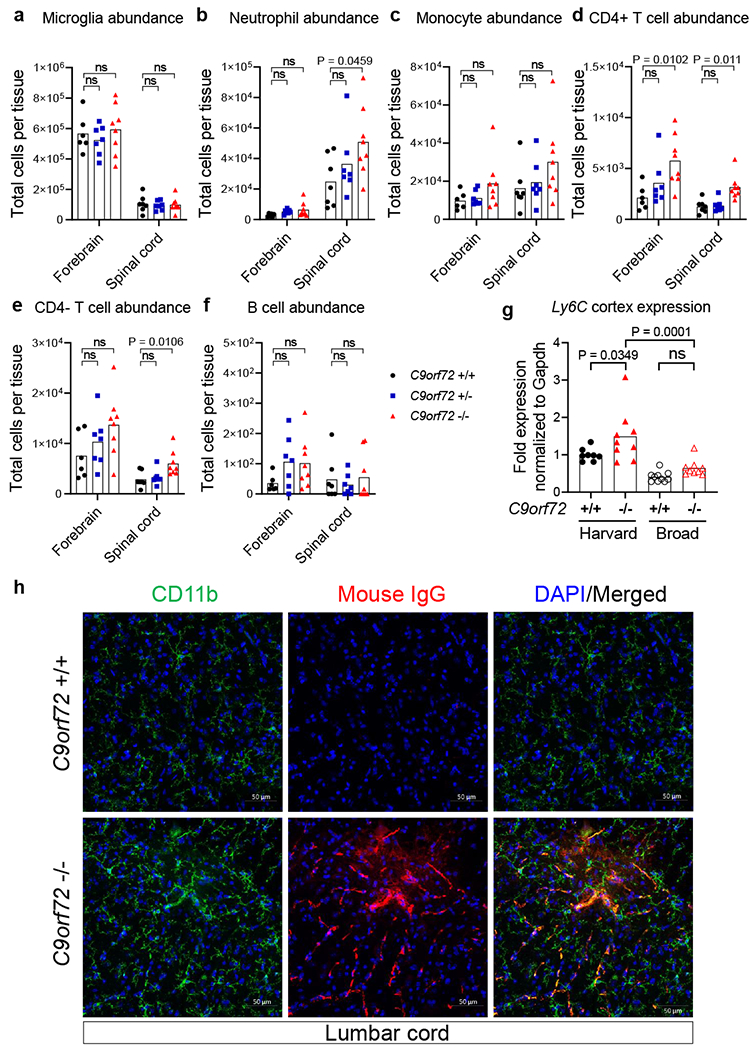
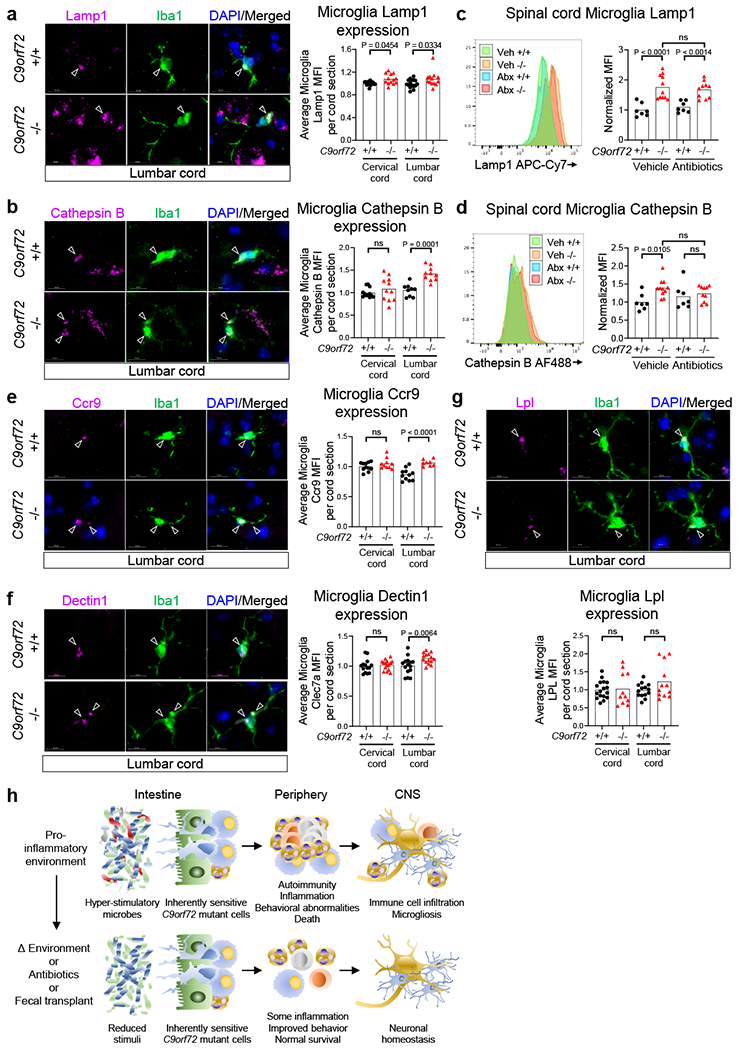
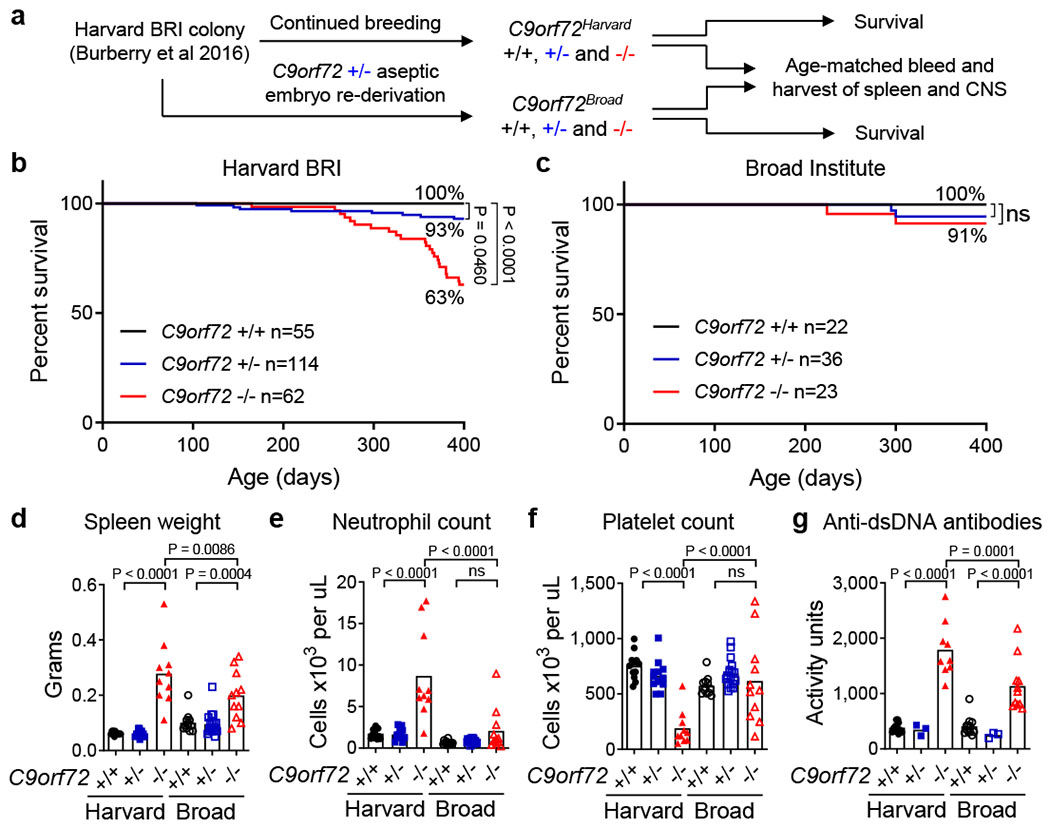
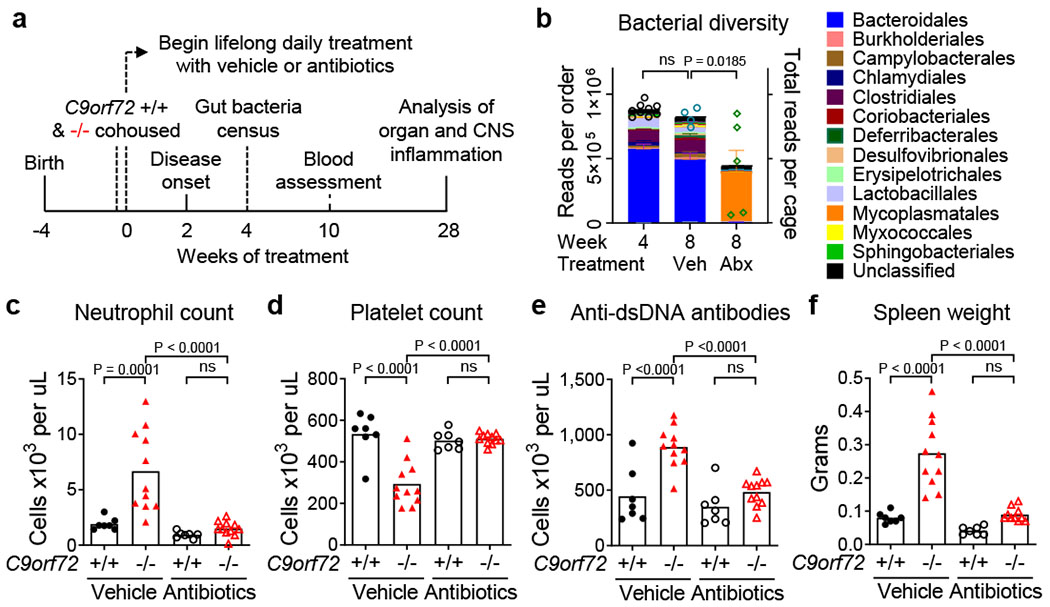
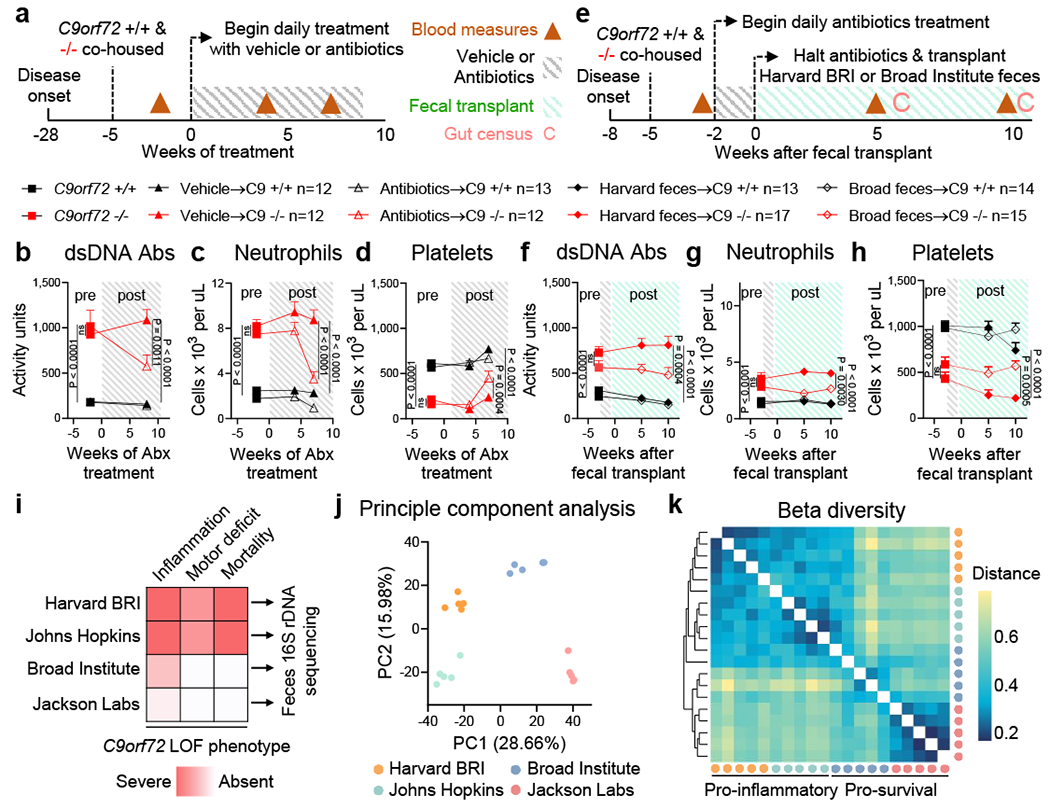
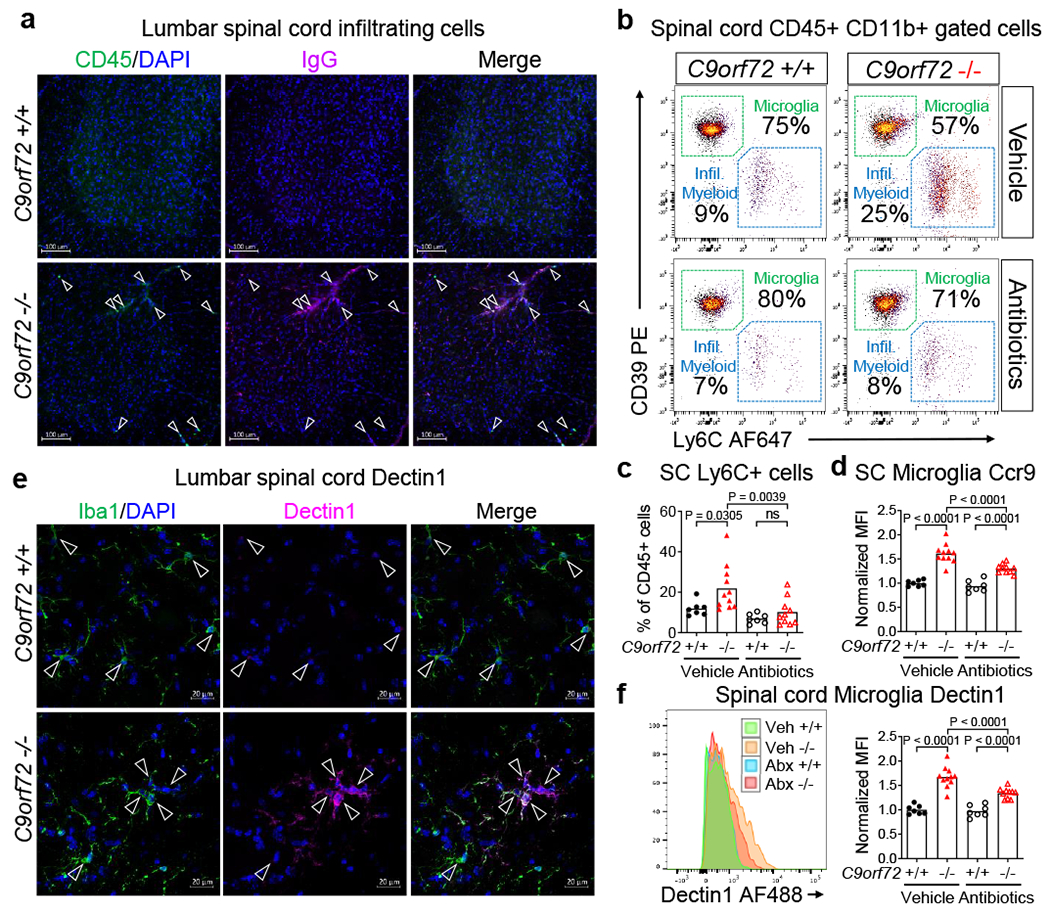
A hexanucleotide-repeat expansion in C9ORF72 is the most common genetic variant that contributes to amyotrophic lateral sclerosis and frontotemporal dementia1,2. The C9ORF72 mutation acts through gain- and loss-of-function mechanisms to induce pathways that are implicated in neural degeneration3-9. The expansion is transcribed into a long repetitive RNA, which negatively sequesters RNA-binding proteins5 before its non-canonical translation into neural-toxic dipeptide proteins3,4. The failure of RNA polymerase to read through the mutation also reduces the abundance of the endogenous C9ORF72 gene product, which functions in endolysosomal pathways and suppresses systemic and neural inflammation6-9. Notably, the effects of the repeat expansion act with incomplete penetrance in families with a high prevalence of amyotrophic lateral sclerosis or frontotemporal dementia, indicating that either genetic or environmental factors modify the risk of disease for each individual. Identifying disease modifiers is of considerable translational interest, as it could suggest strategies to diminish the risk of developing amyotrophic lateral sclerosis or frontotemporal dementia, or to slow progression. Here we report that an environment with reduced abundance of immune-stimulating bacteria10,11 protects C9orf72-mutant mice from premature mortality and significantly ameliorates their underlying systemic inflammation and autoimmunity. Consistent with C9orf72 functioning to prevent microbiota from inducing a pathological inflammatory response, we found that reducing the microbial burden in mutant mice with broad spectrum antibiotics-as well as transplanting gut microflora from a protective environment-attenuated inflammatory phenotypes, even after their onset. Our studies provide further evidence that the microbial composition of our gut has an important role in brain health and can interact in surprising ways with well-known genetic risk factors for disorders of the nervous system.


Conflict of interest statement

Conflicts of interest

KE is a co-founder of Q-State Biosciences, Quralis and Endear Therapies.

Figures

Extended Data Fig. 1 |
Previously published C9orf72 LOF survival studies a, From Burberry et al (2016) Science Translational Medicine, originally Figure 2A. b, From Burberry et al (2016) Science Translational Medicine, originally Figure 2B. c, From Ugolino et al (2016) PLOS Genetics, originally Figure 1c. d, From Jiang et al (2016) Neuron, originally Figure 1D. e, From O’Rourke et al (2016) Science, originally Figure S1G. Permissions to reproduce these figures were obtained from each publishing group. Permission for c is licensed under “CC BY 4.0”.
Extended Data Fig. 2 |
Causes of death, motor performance, plasma cytokines and identification of pseudothrombocytopenia in C9orf72 LOF mice a, Causes of death or premature mortality of C9orf72Harvard mice in Fig. 1b. b, Accelerating rotarod performance of 37-week-old C9orf72Harvard neo deleted mice (+/+ n=22; +/− n=50; −/− n=22). C9orf72Broad mice . b-c, One way ANOVA with Dunnett multiple comparison. Each point represents the average of three trials per animal. c, Accelerating rotarod performance of C9orf72Broad neo deleted mice at 29-weeks of age (+/+ n=53; +/− n=52; −/− n=48) or 42-weeks of age (+/+ n=38; +/− n=48; −/− n=48). (One way ANOVA with Sidak multiple comparisons). d, Age at sacrifice of animals in Fig. 1d–g (One way ANOVA with Sidak multiple comparison). e, Plasma cytokines and chemokines at sacrifice from mice in Fig. 1d–g. Mean ± s.d. Two way ANOVA with Tukey multiple comparisons. f, Peripheral blood smear of 18-week-old C9orf72Harvard neo deleted mice. Platelets from C9orf72Harvard −/− mice were prone to aggregate (outlined by red dashed lines) in the presence of EDTA at 0ºC. g, This pseudothrombocytopenia could be reversed by warming the blood to room temperature. Reduced platelet count in this model therefore represents an indirect measure of anti-platelet autoantibodies, rather than a reduction in platelet abundance. Two way ANOVA with Tukey multiple comparison. Each dot represents one animal.
Extended Data Fig. 3 |
Cytokines and chemokines in lifelong antibiotics treated C9orf72 LOF mice and sex stratification of inflammatory phenotypes a, PCR analysis of Helicobacter spp. and Norovirus DNA in fecal pellets. Each dot represents feces from one cage. One way ANOVA with Dunnett multiple comparisons. b, Plasma cytokines and chemokines of mice in Fig 2. Mean ± s.d. Two way ANOVA with Tukey multiple comparisons. c, Representative spleen size of mice in Fig 2. d-f, Total blood d, neutrophil count e, platelet count and f, spleen weight from mice in Fig 2 stratified by sex. d-i, Each dot represents one animal. One way ANOVA with Sidak multiple comparisons. Total blood g, neutrophil count and h, platelet count in 30-week-old C9orf72Harvard neo deleted mice stratified by sex (+/+ n=9M, n=13F; +/− n=25M n=27F; −/− n=13M n=9F). i, Spleen weight in 40-week-old C9orf72Harvard neo deleted mice stratified by sex (+/+ n=8M, n=11F; +/− n=13M n=7F; −/− n=12M n=6F).
Extended Data Fig. 4 |
Acute antibiotics treatment improves motor function and mitigates splenomegaly and cytokine burden in C9orf72 LOF mice a, Accelerating rotarod performance of mice in Fig 3a. Each point represents the average of three trials per animal. Two way ANOVA with Dunnett multiple comparisons. b, Plasma cytokines and chemokines of mice in Fig 3a–d after 7 weeks of treatment. b,e, Mean ± s.d. Two way ANOVA with Tukey multiple comparisons. c, Representative spleen size and d, spleen weight of mice in Fig 3a after 8 weeks of treatment. Each dot represents one animal. One way ANOVA with Sidak multiple comparisons. e, Plasma cytokines and chemokines of mice in Fig 3e–h 10 weeks after fecal transplant.
Extended Data Fig. 5 |
Bacteria and protozoa diversity across environments a, Phylum level and b, species level relative abundance of bacteria from 16S rDNA sequencing in Fig. 3i. Each bar represents sequencing from one pellet per cage. c, Relative abundance and d, Gram stain classification of bacterial species whose abundance was significantly different between pro-inflammatory environments (Harvard BRI/JHU) and pro-survival environments (Broad Institute and Jackson Labs). (T test with Bonferroni multiple comparisons) 62/301 detected species had significance P < 0.0002. n=5 fecal pellets per environment. Mean ± s.d. e, Quantitative RT-PCR analysis of Tritrichomonas muris 28S rDNA relative to total Eubacteria 16S rDNA in feces, e-g Each dot represents a fecal pellet from one cage. One way ANOVA with Tukey multiple comparisons, f, Simpson index of fecal alpha diversity, g, Relative abundance of epsilon proteobacteria [Helicobacter], h, PCR analysis of Helicobacter spp. 16S rDNA and total Eubacteria 16S rDNA in feces, i, PCR analysis of Helicobacter spp. 16S rDNA and total Eubacteria 16S rDNA in feces (6 weeks-post-transplant) from Fig 3e.
Extended Data Fig. 6 |
Environment enriched bacteria engraft fecal transplant recipients a-f, Analysis of bacteria in feces 10-weeks-post-transplant from mice in Fig 3e by 16S rDNA sequencing. Each bar represents a fecal sample from an individual cage, a, Phylum level and b, species level relative abundance, c, Relative abundance of bacterial species grouped as those only observed in cages from Harvard BRI (Harvard-only), those only observed in cages from the Broad Institute (Broad-only), those observed in cages from Harvard BRI and the Broad Institute (Harvard/Broad-shared) or those not observed in Harvard BRI or Broad Institute cages but detectable in transplant recipient cages (Emergent), d, Bray-Curtis dissimilarity matrix of feces beta diversity, e, Relative abundance of epsilon proteobacteria [Helicobacter], (f) Putative pro-inflammatory species (n=27) enriched in pro-inflammatory environments (Harvard BRI/JHU) that were also enriched in Harvard->Harvard recipients and putative pro-survival species (n=12) enriched in pro-survival environments (Broad/Jackson Labs) and enriched in Broad->Harvard recipients.
Extended data Fig. 7 |
C9orf72 restricts myeloid cytokine release in response to foreign stimuli. a-d, Analysis of cytokines and chemokines in supernatant 24 hours after stimulation of bone marrow derived macrophages (BMDM) with a-c, activators of Toll-like receptor (Tlr) or NOD-like receptor (Nlr) agonists or d, filtered Eubacteria-normalized fecal preparations. c, The abundance of cytokine and chemokine in supernatant was normalized and color coded (Blue low; Red high) relative to the average level of each molecule in unstimulated +/+ BMDM wells. Levels of each analyte were measured by Luminex in multiplex. d, The abundance of total Eubacteria in each fecal sample was measured by qPCR for 16S rDNA and this value was used to normalize fecal Eubacteria bacteria concentration prior to generation of the dilution curve. Each dot represents one well. Panels are representative of a n=2 replicate experiments; b n=5 replicate experiments; c, One representative experiment with average of n=3 technical replicates per condition; d n=2 replicate experiments). a Two way ANOVA with Sidak multiple comparison. b, Two way ANOVA with Dunnett multiple comparison. c, Two way ANOVA with Sidak multiple comparison for each analyte tested. d, One way ANOVA with Sidak multiple comparison.
Extended Data Fig. 8 |
Neutrophils and T cells infiltrate C9orf72 LOF spinal cord. a-f, Mass cytometry interrogation of single cell dissociated forebrain or spinal cord from 36-week-old C9orf72Harvard neo deleted male and female mice (+/+ n=7; +/− n=7; −/− n=8). One C9orf72 +/+ forebrain sample failed and was excluded from analysis. Representative gating scheme can be found in Supplementary Info. Populations were defined as a, CD45mid CX3CR1+ CD39+ Microglia, b, CD45hi Ly6C+ Ly6Ghi Neutrophils, c, CD45hi Ly6C+ Ly6Glo Monocytes, d, CD45hi CD3e+ CD4+ T cells, e, CD45hi CD3e+ CD4− T cells and f, CD45hi CD 19+ B cells. Quantitation of total cells per tissue was obtained by multiplying the percentage of each gated population by the total cells recovered from that mouse’s tissue. Each dot represents one mouse. Two Way ANOVA with Dunnett multiple comparison, g, Quantitative RT-PCR of Ly6C expression in 47-week-old C9orf72Harvard neo deleted (+/+ n=8; −/− n=9) or C9orf72Broad neo deleted (+/+ n=10; −/− n=9) total cortex tissue. Each dot represents one animal. One Way ANOVA with Sidak multiple comparison, h, Orthogonal projection of confocal imaging of CD11b and mouse immunoglobulin IgG in 43-week-old C9orf72Harvard lumbar spinal cord .
Extended data Fig. 9 |
Elevated lysosomal proteins and microgliosis in C9orf72 LOF spinal cord. a-b,e-g, Orthogonal projection and quantification of confocal imaging of a, Lamp1, b, Cathepsin B, e, Ccr9, f, Dectin1/Clec7a, and g, Lpl in Iba1+ microglia in 55-week-old C9orf72Harvardspinal cord (One way ANOVA with Sidak multiple comparisons). Each dot represents the average mean fluorescent intensity (MFI) of the antigen within microglia on a given spinal cord section. >100 microglia surveyed per section. Sections from n=3 C9orf72 +/+ and n=3 C9orf72 −/− mice surveyed, c-d, Flow cytometry quantification of c, Lamp1 or d, Cathepsin B in CD45mid CD11b+ CD39+ microglia from spinal cord of C9orf72Harvard neo deleted mice in Fig. 2. One way ANOVA with Sidak multiple comparisons, h, Graphical illustration of C9orf72 functioning within the hematopoietic system to restrict the development of inflammation, autoimmunity, peripheral immune infiltration into the central nervous system (CNS) and microgliosis in response to hyper-stimulatory communities of gut microflora. The microglia image was modified from Servier Medical Art (https://smart.servier.com/smartimage/microglia-2/) under license “CC BY 3.0”.
Fig. 1 |
Fig. 1 |
Environment governs survival, inflammation and autoimmunity in C9orf72 LOF mice. a, Aseptic embryo transfer of C9orf72 neo deleted allele from Harvard BRI to Broad Institute. Males and females were aged for survival or tissue harvest. Survival of mice at b, Harvard BRI (C9orf72 +/+ n=55; +/− n=114; −/− n=62) or c, Broad Institute (C9orf72 +/+ n=22; +/− n=36; −/− n=23) (Gehan-Breslow-Wilcoxon). ns not significant Age-matched (48-week-old) mice reared at Harvard BRI (C9orf72 +/+ n=12; +/− n=13; −/− n=10) or Broad Institute (C9orf72 +/+ n=12; +/− n=18; −/− n=11) were assessed for d, spleen weight, e, blood neutrophil count, f, blood platelet count measured at 0ºC and g, plasma anti-double stranded (ds)DNA antibody activity, d-g, One way ANOVA with Sidak multiple comparisons. Each dot represents one animal.
Fig. 2 |
Fig. 2 |
Lifelong suppression of gut microflora prevents inflammation and autoimmunity in C9orf72 LOF mice a, Male and female C9orf72Harvard +/+ and −/− neo deleted mice of weaning age were cohoused by treatment group, then administered vehicle (+/+ n=7; −/− n=11) or antibiotics (+/+ n=7; −/− n=11) daily for life. Mice assessed for gut microbial composition (b, 4 weeks), blood measures (c-e, 8 weeks) and sacrificed for organ and CNS assessment (f, 28 weeks). b, 16S rDNA sequencing of bacteria diversity in feces. Each dot represents total sequencing reads per cage. One-way ANOVA with Dunnett multiple comparison. c, Blood neutrophil count. d, Blood platelet count measured at 0ºC. e, Plasma anti-dsDNA antibody activity. f, Spleen weight. c-f, One way ANOVA with Sidak multiple comparisons. Each dot represents one animal.
Fig. 3 |
Fig. 3 |
Gut bacteria propagates inflammation and autoimmunity in C9orf72 LOF mice a, Age matched (36-week-old) female C9orf72Harvard +/+ and −/− neo deleted mice were cohoused by treatment group, then administered vehicle (+/+ n=12; −/− n=12) or antibiotics (+/+ n=13; −/− n=12) daily and assessed for b, plasma anti-dsDNA antibody activity, c, blood neutrophil count and d, blood platelet count measured at 0ºC. b-d and f-h, One way ANOVA with Sidak multiple comparisons. Each dot represents one animal. e, Age matched (13-week-old) female C9orf72Harvard +/+ and −/− neo deleted mice were cohoused by treatment group, administered antibiotics for two weeks, then gavaged Harvard BRI feces (+/+ n=13; −/− n=17) or Broad feces (+/+ n=14; −/− n=15) and assessed for f, plasma anti-dsDNA antibody activity, g, blood neutrophil count and h, blood platelet count measured at 0ºC. i, Fecal pellets (n=5 each) from two pro-inflammatory environments (Harvard BRI/Johns Hopkins) and two pro-survival environments (Broad Institute/Jackson Labs) were subjected to 16S rDNA sequencing and assessed by j, principle component analysis and k, Bray-Curtis dissimilarity matrix of beta diversity.
Fig. 4 |
Fig. 4 |
Gut microflora promotes myeloid cell infiltration and microgliosis in C9orf72 LOF spinal cord a, Orthogonal projection of CD45 and mouse immunoglobulin G (IgG) in 55-week-old C9orf72Harvardneo deleted lumbar spinal cord (+/+ n=3; −/− n=3). b, Representative gating of CD45+ CD11b+ cells from spinal cord of C9orf72Harvard mice in Fig. 2. c, CD45hi CD11b+ Ly6C+ spinal cord infiltrating myeloid cells in b. c-d, f, One way ANOVA with Sidak multiple comparisons. Each dot represents one animal, d, Ccr9 expression on CD45mid CD11b+ CD39+ microglia from spinal cord of C9orf72Harvard mice in Fig. 2. e, Orthogonal projection of Dectin1 in Iba1+ microglia in 55-week-old C9orf72Harvardneo deleted lumbar spinal cord (+/+ n=3; −/− n=3 mice), f, Dectin1 in CD45mid CD11b+ CD39+ microglia from spinal cord of C9orf72Harvard mice in Fig. 2.

Comment in

References

    1. DeJesus-Hernandez M et al. Expanded GGGGCC hexanucleotide repeat in noncoding region of C90RF72 causes chromosome 9p-linked FTD and ALS. Neuron 72, 245–256 (2011). - PMC - PubMed
    1. Majounie E et al. Frequency of the C9orf72 hexanucleotide repeat expansion in patients with amyotrophic lateral sclerosis and frontotemporal dementia: a cross-sectional study. Lancet Neurol. 11, 323–330 (2012). - PMC - PubMed
    1. Mori K et al. The C9orf72 GGGGCC Repeat Is Translated into Aggregating Dipeptide-Repeat Proteins in FTLD/ALS. Science 339, 1335–1338 (2013). - PubMed
    1. Ash PEA et al. Unconventional translation of C90RF72 GGGGCC expansion generates insoluble polypeptides specific to C9FTD/ALS. Neuron 77, 639–646 (2013). - PMC - PubMed
    1. Donnelly CJ et al. RNA Toxicity from the ALS/FTD C90RF72 Expansion Is Mitigated by Antisense Intervention. Neuron 80, 415–428 (2013). - PMC - PubMed

Publication types

MeSH terms