. 2020 May 16;10(14):6483-6499.
doi: 10.7150/thno.44025. eCollection 2020.

STIM1 is a metabolic checkpoint regulating the invasion and metastasis of hepatocellular carcinoma

Affiliations

STIM1 is a metabolic checkpoint regulating the invasion and metastasis of hepatocellular carcinoma

Huakan Zhao et al. Theranostics. .

Erratum in

Abstract

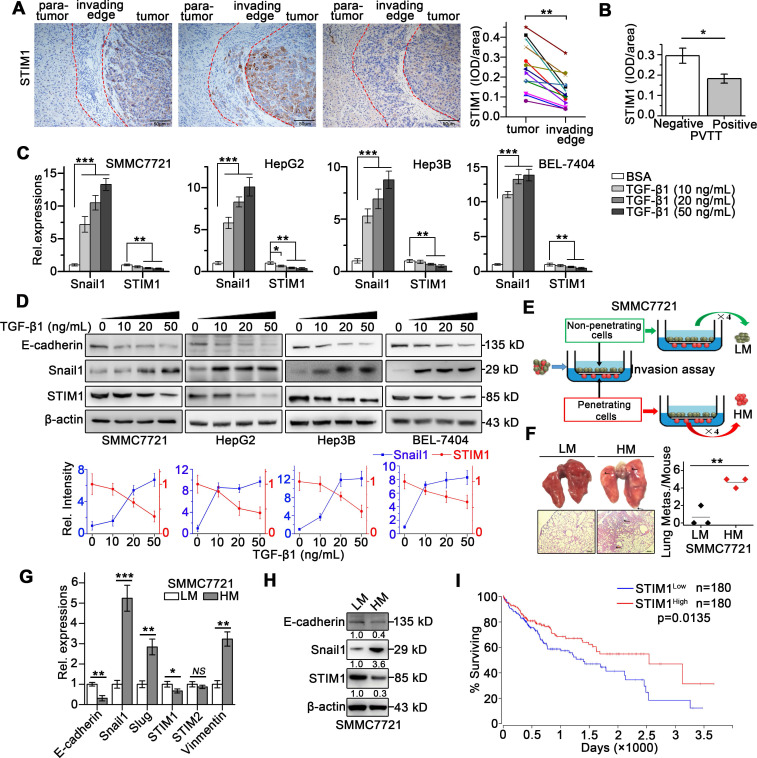
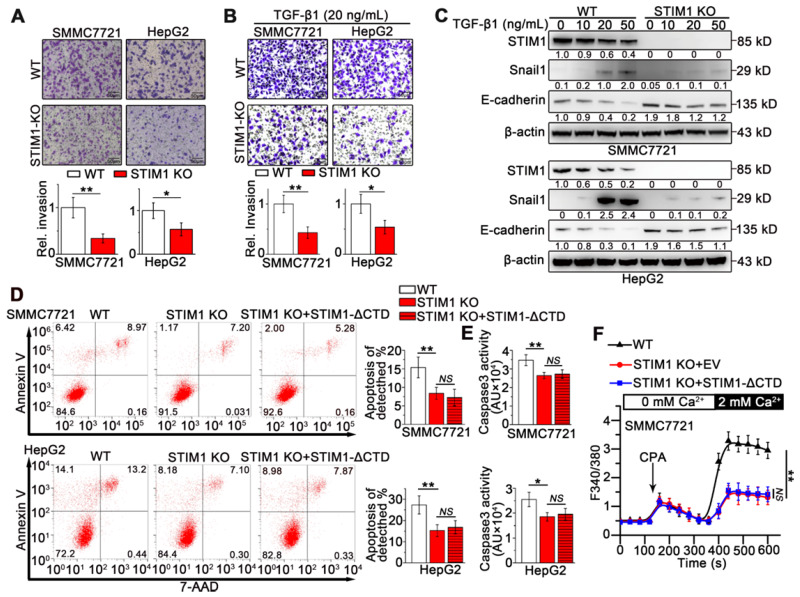
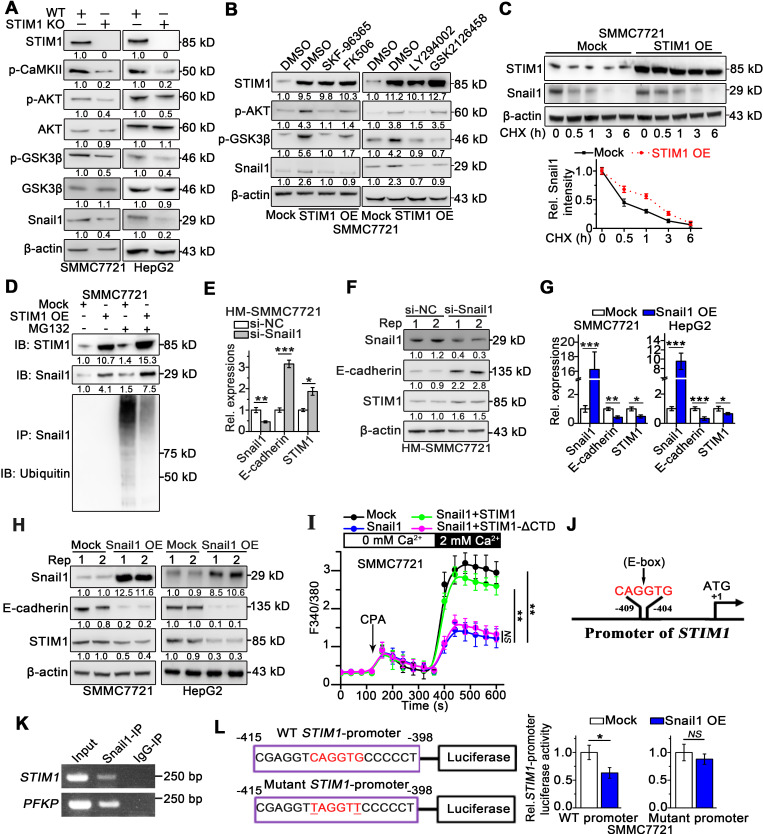
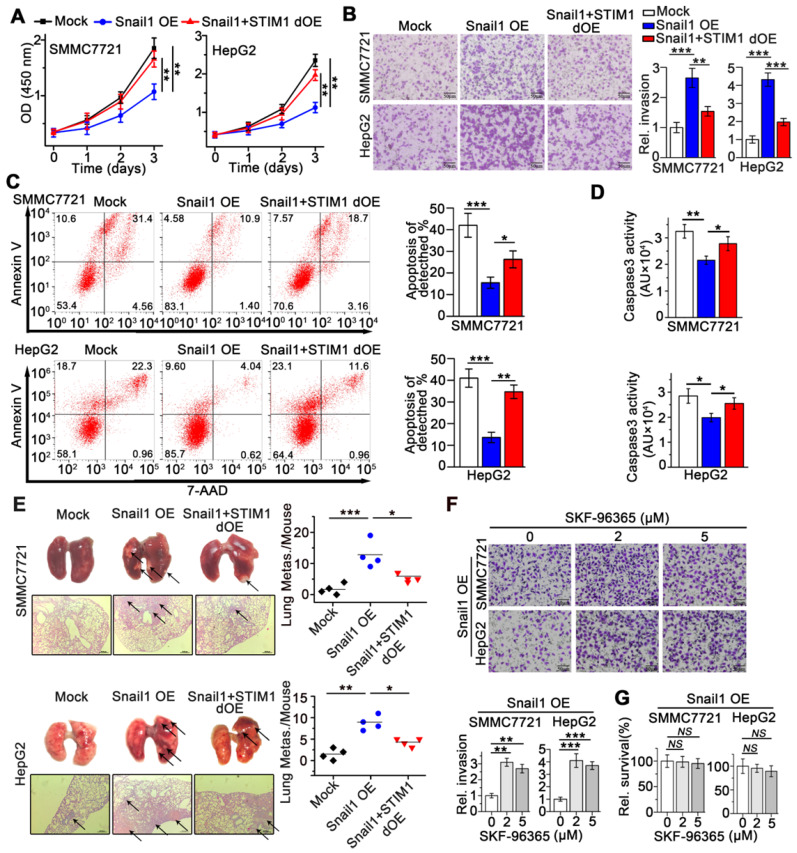
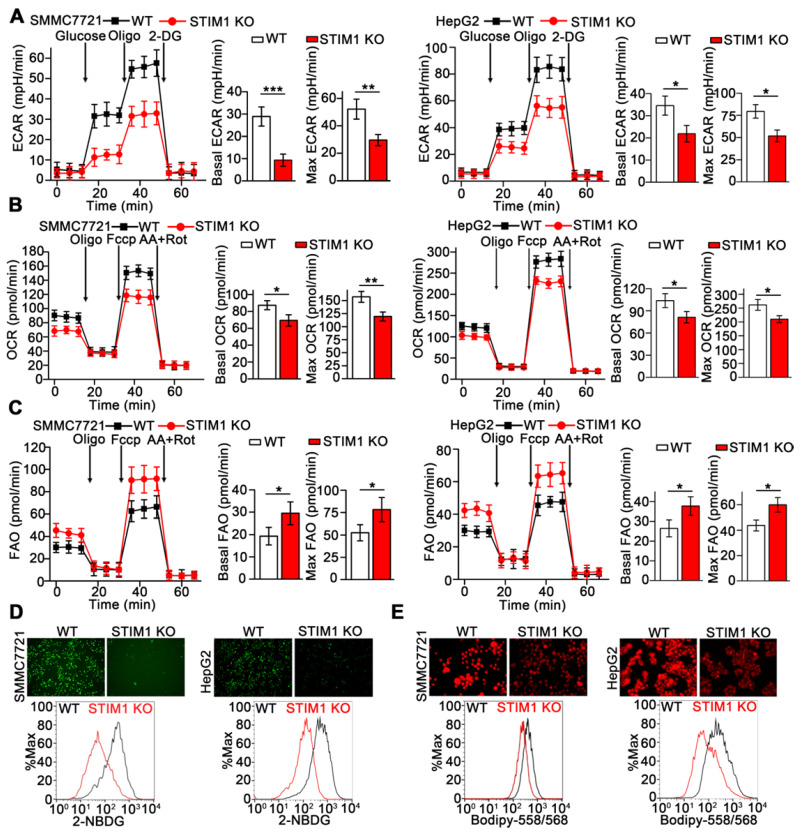
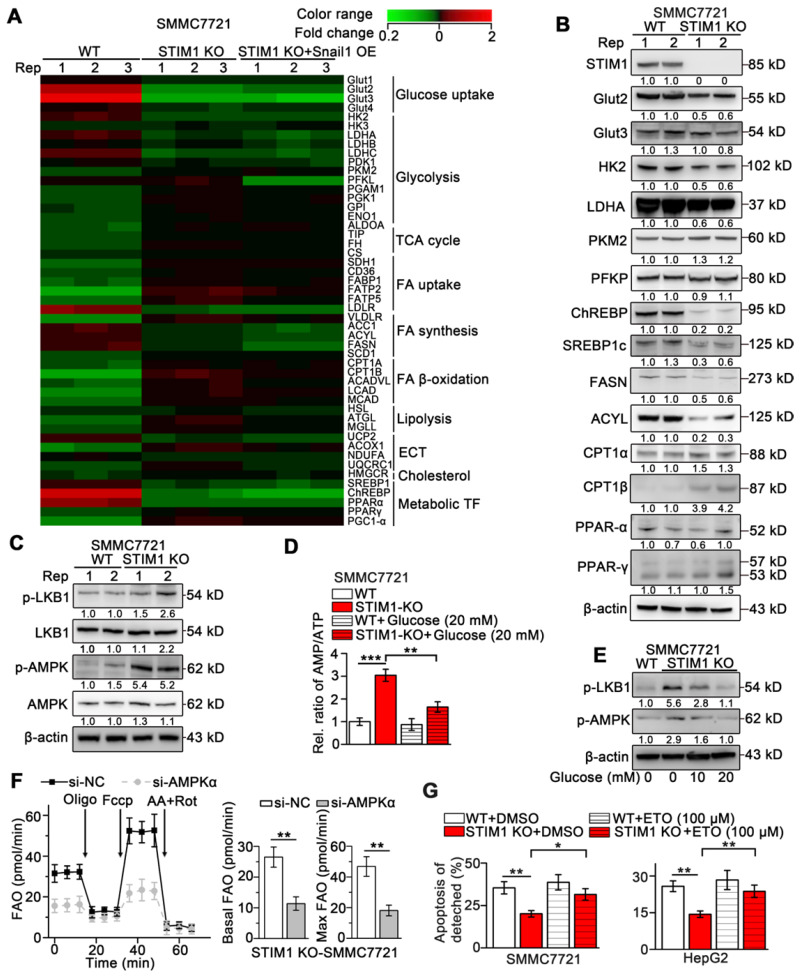
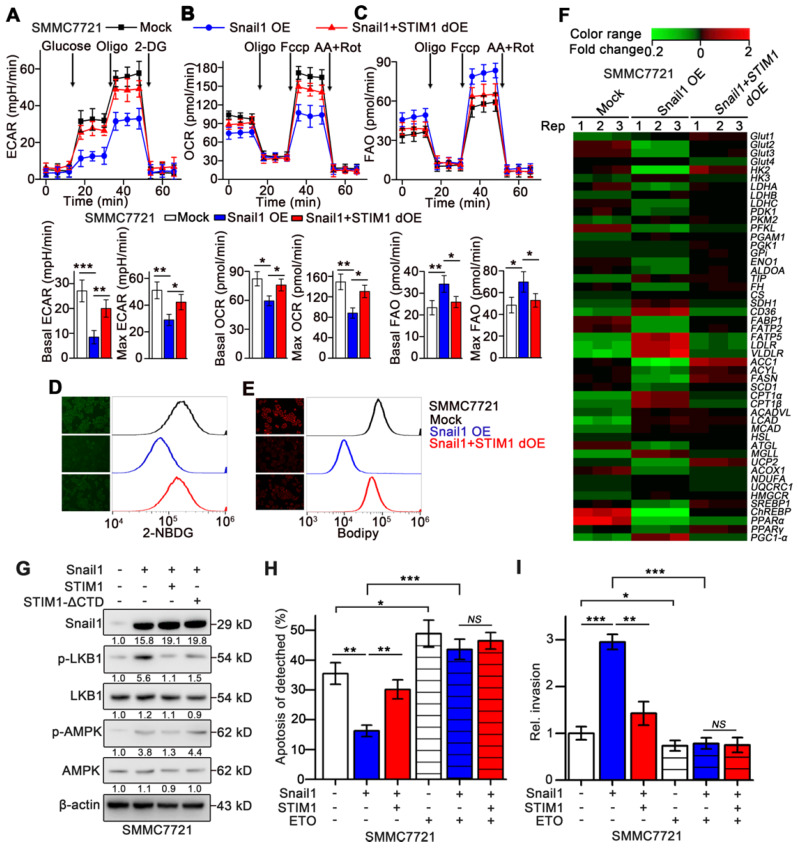
Background: Cancer cells undergoing invasion and metastasis possess a phenotype with attenuated glycolysis, but enhanced fatty acid oxidation (FAO). Calcium (Ca2+)-mediated signaling pathways are implicated in tumor metastasis and metabolism regulation. Stromal-interaction molecule 1 (STIM1) triggered store-operated Ca2+ entry (SOCE) is the major route of Ca2+ influx for non-excitable cells including hepatocellular carcinoma (HCC) cells. However, whether and how STIM1 regulates the invasion and metastasis of HCC via metabolic reprogramming is unclear. Methods: The expressions of STIM1 and Snail1 in the HCC tissues and cells were measured by immunohistochemistry, Western-blotting and quantitative PCR. STIM1 knockout-HCC cells were generated by CRISPR-Cas9, and gene-overexpression was mediated via lentivirus transfection. Besides, the invasive and metastatic activities of HCC cells were assessed by transwell assay, anoikis rate in vitro and lung metastasis in vivo. Seahorse energy analysis and micro-array were used to evaluate the glucose and lipid metabolism. Results: STIM1 was down-regulated in metastatic HCC cells rather than in proliferating HCC cells, and low STIM1 levels were associated with poor outcome of HCC patients. During tumor growth, STIM1 stabilized Snail1 protein by activating the CaMKII/AKT/GSK-3β pathway. Subsequently, the upregulated Snail1 suppressed STIM1/SOCE during metastasis. STIM1 restoration significantly diminished anoikis-resistance and metastasis induced by Snail1. Mechanistically, the downregulated STIM1 shifted the anabolic/catabolic balance, i.e., from aerobic glycolysis towards AMPK-activated fatty acid oxidation (FAO), which contributed to Snail1-driven metastasis and anoikis-resistance. Conclusions: Our data provide the molecular basis that STIM1 orchestrates invasion and metastasis via reprogramming HCC metabolism.

Keywords: SOCE; STIM1; Snail1; invasion and metastasis; metabolic reprogramming.


Conflict of interest statement

Competing Interests: The authors have declared that no competing interest exists.

Figures

Figure 1
Figure 1
STIM1 is reduced in tumor invading-edge and metastatic HCC cells. (A) Representative micrographs of STIM1 immunohistochemical analysis (400×) and statistical analysis of integrated optical density (IOD) of STIM1 against immunoglobulin G (IgG) in the invading edge and tumor of 12 HCC patients. (B) IOD of STIM1 against IgG in the tumor invading-edge of portal vein tumor thrombus (PVTT)-positive (n = 4) and PVTT-negative (n = 8) HCC samples. (C) Snail1 and STIM1 mRNA, (D) E-cadherin, Snail1 and STIM1 protein expressions were detected in SMMC7721, HepG2, Hep3B and BEL-7404 treated with TGF-β1 for 48 h. The results were analyzed and normalized against expression with 20 ng/mL bovine serum albumin (BSA) treated cells. (E) Diagram that the isolation different metastatic sublines from SMMC7721 cells after 4 rounds of selection, LM: low metastatic, HM: high metastatic. (F) Metastatic characteristic of LM- and HM-SMMC7721 sublines in vivo, lungs were observed for metastatic nodules on the surface, representative photographs and H&E staining were shown (n = 4 mice per group), arrows point to metastatic nodules. (G, H) The mRNA (G) and protein (H) expressions of STIM1, Snail1 and E-cadherin in LM- and HM-SMMC7721 sublines. (I) Kaplan-Meier analysis of correlation between the STIM1 expression and overall survival of HCC patients from TGCA (n = 360). Data of (A-D, G and H) are expressed as mean ± SEM (n = 3). *p < 0.05, **p <0.01, ***p < 0.001, NS represents no significant difference.
Figure 2
Figure 2
The effects of STIM1 deficiency on invasion and metastasis in HCCs. (A and B) Transwell assays of WT- and STIM1 KO- cells without (A) or with TGF-β1 (20 ng/mL) treatment (B). (C) STIM1, E-cadherin and Snail1 protein levels in WT- and STIM1 KO- cells treated with TGF-β1 for 48 h. (D, E) Flow cytometry analysis (FACS) (D) and caspase 3 activity assay (E) were applied to measure the anoikis rate in WT-, STIM1 KO-, STIM1 KO+STIM1-ΔCTD- SMMC7721 cells which were force suspended for 24 h, EV: empty vector; ΔCTD: deletion of the C-terminal domain. (F) Ca2+ mobilization in WT-, STIM1 KO-, STIM1 KO+STIM1-ΔCTD-SMMC7721 cells, respectively upon cyclopiazonic acid (CPA, 20 mM) stimulation, mean ± SEM of 8 independent cells each group. Data are expressed as mean ± SEM (n = 3). *p < 0.05, **p < 0.01, **p < 0.001, NS represents no significant difference.
Figure 3
Figure 3
The interaction between STIM1 and Snail1 in HCC. (A) Indicated protein expressions in WT- and STIM1 KO-SMMC7721 or HepG2 were examined, and β-actin was used as a loading control. (B) STIM1 OE-SMMC7721 cells were treated with SKF-96365 (10 µM), FK506 (10 µM), LY294002 (10 µM), GSK2126458 (1 µM) for 24 h; WB was used for measuring STIM1, p-AKT (Thr308), p-GSK-3β (Ser9) and Snail1 protein levels, and β-actin was used as a loading control, DMSO: dimethyl sulfoxide. (C) Mock- and STIM1 OE-SMMC7721 cells were treated by cycloheximide (CHX, 1 µM) with different time intervals. Cell extracts were immunoblotted with antibodies against STIM1, Snail1 and β-actin. Snail1 levels (normalized to β-actin) were plotted against CHX treatment durations. (D) Mock- and STIM1 OE-SMMC7721 cells were treated with or without MG132 (5 μM). Cell extracts were immunoprecipitated with Snail1 antibody and immunoblotted with antibodies against ubiquitin or Snail1, IP: immunoprecipitation, IB: immunoblotting. (E, F) HM-SMMC7721 sublines were transfected with scrambled siRNA (si-NC) or si-Snail1, RT-qPCR (E) and WB (F) to assess STIM1, Snail1 and E-cadherin expressions. (G, H) RT-qPCR (G) and WB (H) to assess STIM1, Snail1 and E-cadherin expressions in mock- and Snail1 OE-SMMC7721 and HepG2 cells. (I) Ca2+ mobilization upon CPA (20 mM) challenge after over-expressing Snail1, Snail1 plus STIM1, Snail1 plus STIM1-ΔCTD in SMMC7721 cells, respectively, mean ± SEM of 8 independent cells. (J) Bioinformatics analysis predicted binding site of Snail1 (5'-CAGGTG-3') in the promoter of STIM1, black arrow points to transcription start site. (K) ChIP assay of Snail1 protein and STIM1 promoter, representative agarose gel results showing recruitment of Snail1 to the STIM1 promoter, and PFKP promoter used as a positive control. (L) Luciferase activity assay of STIM1 promoter and STIM1 promoter containing mutant E-box (TAGGTT) in Snail1 OE-SMMC7721. Data are expressed as mean ± SEM (n = 3). *p < 0.05, **p < 0.01, ***p < 0.001, NS represents no significant difference.
Figure 4
Figure 4
STIM1 replenish abrogates the anoikis resistance and metastasis of Snail1 OE-cells. (A) Effects of STIM1 on the proliferation of Snail1 OE-SMCC7721 and HepG2 cells. (B) Transwell assays for the invasion of WT-, Snail1 OE-, Snail1 plus STIM1 double OE (Snail1+STIM1 dOE)-SMMC7721 and HepG2 cells. (C, D) FACS (C) and caspase 3 activity assay (D) were used to measure the anoikis rate in mock-, Snail1 OE- and Snail1+STIM1 dOE-SMMC7721 and HepG2 cells. (E) The effects of STIM1 restoration on the metastasis of Snail1 OE-SMMC7721 and HepG2 cells in vivo. Lungs were observed for metastatic nodules on the surface, stained by H&E for histological analyses, arrows point to metastatic nodules. Representative photographs and H&E staining were shown (n = 4 mice per group). (F) Transwell assays were performed to detect the effects of different concentrations SKF-96365 on the invasion ability of Snail1 OE-SMMC7721 and HepG2 cells. (G) CCK-8 assay was applied to examine the effects of SKF-96365 with different concentrations on the survival of Snail1 OE-SMMC7721 and HepG2 cells. Data of (A-D, F and G) are expressed as mean ± SEM (n = 3). **p < 0.01, ***p < 0.001, ***p < 0.001, NS represents no significant difference.
Figure 5
Figure 5
STIM1 deficiency rewires aerobic glycolysis towards FAO. (A-C) ECAR (A), OCR (B) and FAO (C) caused by STIM1 deficiency in SMMC7721 and HepG2 cells were measured by Seahorse XF24 analyzer. Oligo: Oligomycin, 2-DG: 2-Deoxy-D-glucose, Fccp: Carbonyl cyanide 4-(trifluoromethoxy) phenylhydrazone, AA/Rot: Antimycin A/Rotenone. (D, E) The glucose uptake (D) and intracellular lipid content (E) in WT- and STIM1 KO-SMMC7721 or HepG2 cells were determined by fluorescence microscope and FACS. Data are expressed as mean ± SEM (n = 3). *p < 0.05, **p < 0.01, ***p < 0.001.
Figure 6
Figure 6
Lacking of STIM1 rewires aerobic glycolysis towards AMPK-activated FAO. (A) PCR-array was applied to examine the expression changes of key metabolic genes caused by STIM1 KO and STIM1 KO+Snail1 OE (GSE148129). (B) Protein levels of indicated metabolic molecules in WT- and STIM1 KO-SMMC7721 cells. (C) Protein levels of LKB1/AMPK pathway in WT- and STIM1 KO-SMMC7721 cells. (D) The AMP/ATP ratio in WT- and STIM1 KO-SMMC7721 with or without glucose (20 mM). (E) Effects of glucose on the expressions of p-LKB (Ser428) and p-AMPK (Thr172) in STIM1 KO-SMMC7721 cells. (F) FAO in STIM1 KO-SMMC7721 cells transfected with si-NC or si-AMPKα. (G) Effects of ETO (100 μM) on the anoikis of STIM1 KO-SMMC7721 and HepG2 cells were examined by FACS, as well as their corresponding WT-group. ETO: etomoxir. Data are expressed as mean ± SEM (n = 3). *p < 0.05, **p < 0.01, ***p < 0.001.
Figure 7
Figure 7
Metabolic switch triggered by Snail1 could be reversed by STIM1 restoration. (A-C) ECAR (A), OCR (B) and FAO (C) in mock-, Snail1 OE-, Snail1+STIM1 dOE-SMMC7721 cells. (D, E) Glucose uptake (D) and intracellular lipid deposition (E) in mock-, Snail1 OE- and Snail1+STIM1 dOE-SMMC7721 cells. (F) PCR-array was applied to examine the expression of key metabolic genes in mock, Snail1 OE, Snail1 plus STIM1 dOE SMMC7721 cells (GSE135901). (G) Effects of STIM1 and STIM1-ΔCTD on the LKB1/AMPK pathway in Snail1 OE-SMMC7721 cells. (H) Effects of ETO (100 μM) on anoikis of mock-, Snail1 OE- and Snail1+STIM1 dOE-SMMC7721 cells were examined by FACS. (I) Effects of ETO (100 μM) on the invasion ability of mock-, Snail1 OE- and Snail1+STIM1 dOE-SMMC7721 cells via transwell assays. Data are expressed as mean ± SEM (n = 3). *p < 0.05, **p < 0.01, ***p < 0.001. NS represents no significant difference.

References

    1. Bray F, Ferlay J, Soerjomataram I, Siegel RL, Torre LA, Jemal A. Global cancer statistics 2018: GLOBOCAN estimates of incidence and mortality worldwide for 36 cancers in 185 countries. CA Cancer J Clin. 2018;68:394–424. - PubMed
    1. Shibue T, Weinberg RA. EMT, CSCs, and drug resistance: the mechanistic link and clinical implications. Nat Rev Clin Oncol. 2017;14:611–29. - PMC - PubMed
    1. Sciacovelli M, Frezza C. Metabolic reprogramming and epithelial-to-mesenchymal transition in cancer. FEBS J. 2017;284:3132–44. - PMC - PubMed
    1. Cha YH, Yook JI, Kim HS, Kim NH. Catabolic metabolism during cancer EMT. Arch Pharm Res. 2015;38:313–20. - PubMed
    1. Herst PM, Grasso C, Berridge MV. Metabolic reprogramming of mitochondrial respiration in metastatic cancer. Cancer Metastasis Rev. 2018;37:643–53. - PubMed

Publication types