Clinical Trial
. 2020 Apr 21;1(1):100007.
doi: 10.1016/j.xcrm.2020.100007.

Clonal Evolution and Heterogeneity of Osimertinib Acquired Resistance Mechanisms in EGFR Mutant Lung Cancer

Affiliations
Clinical Trial

Clonal Evolution and Heterogeneity of Osimertinib Acquired Resistance Mechanisms in EGFR Mutant Lung Cancer

Nitin Roper et al. Cell Rep Med. .

Abstract

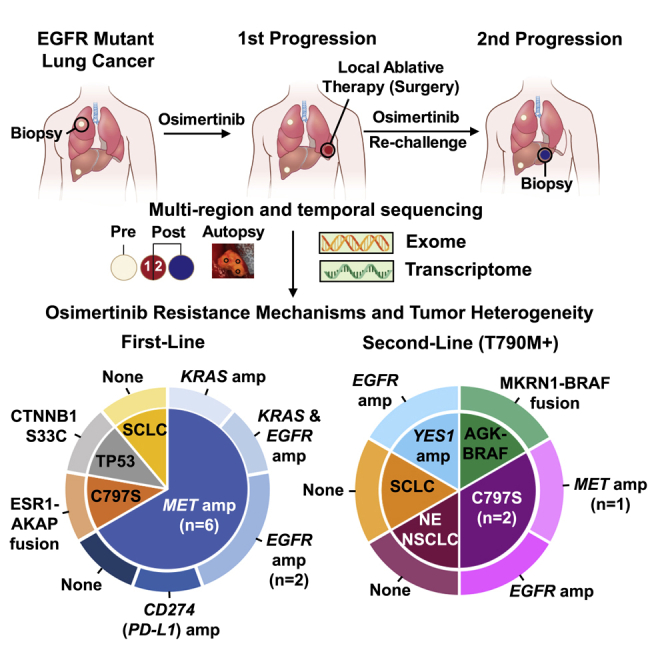
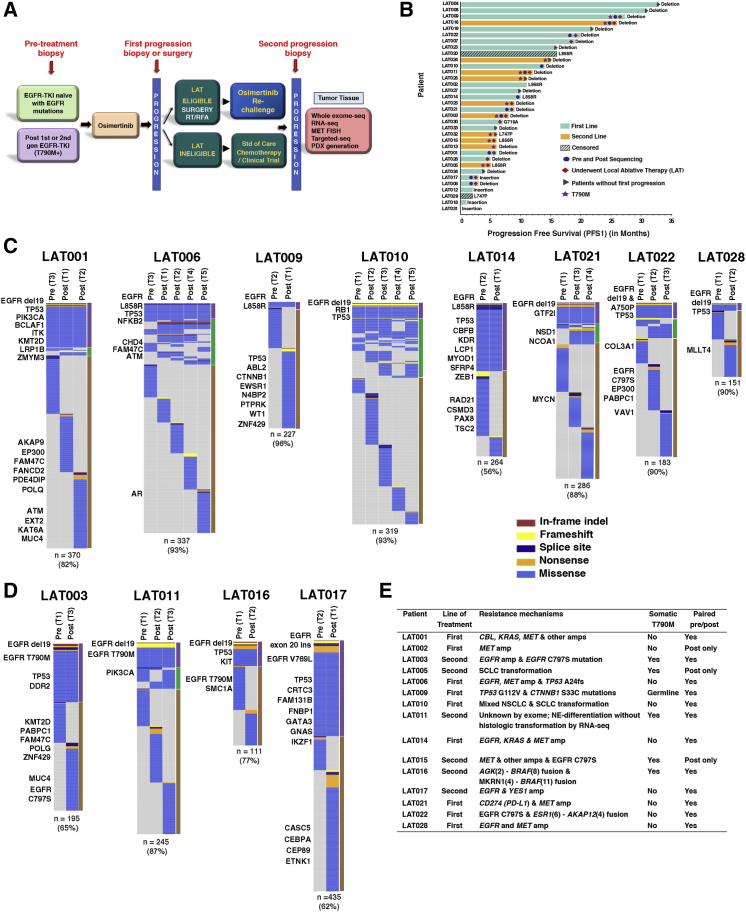
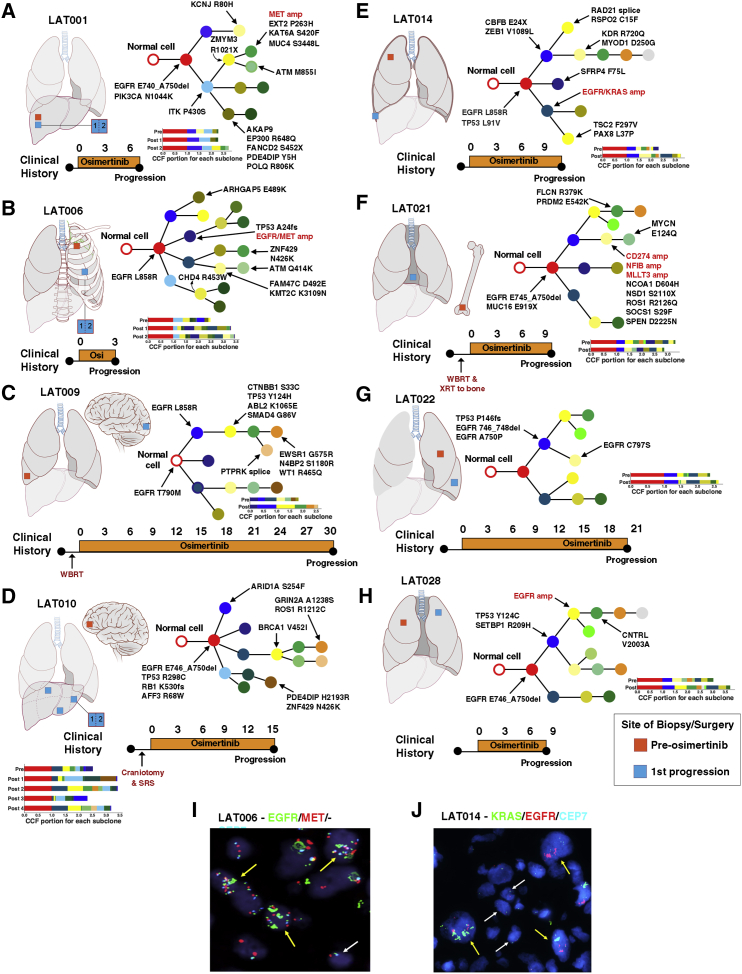
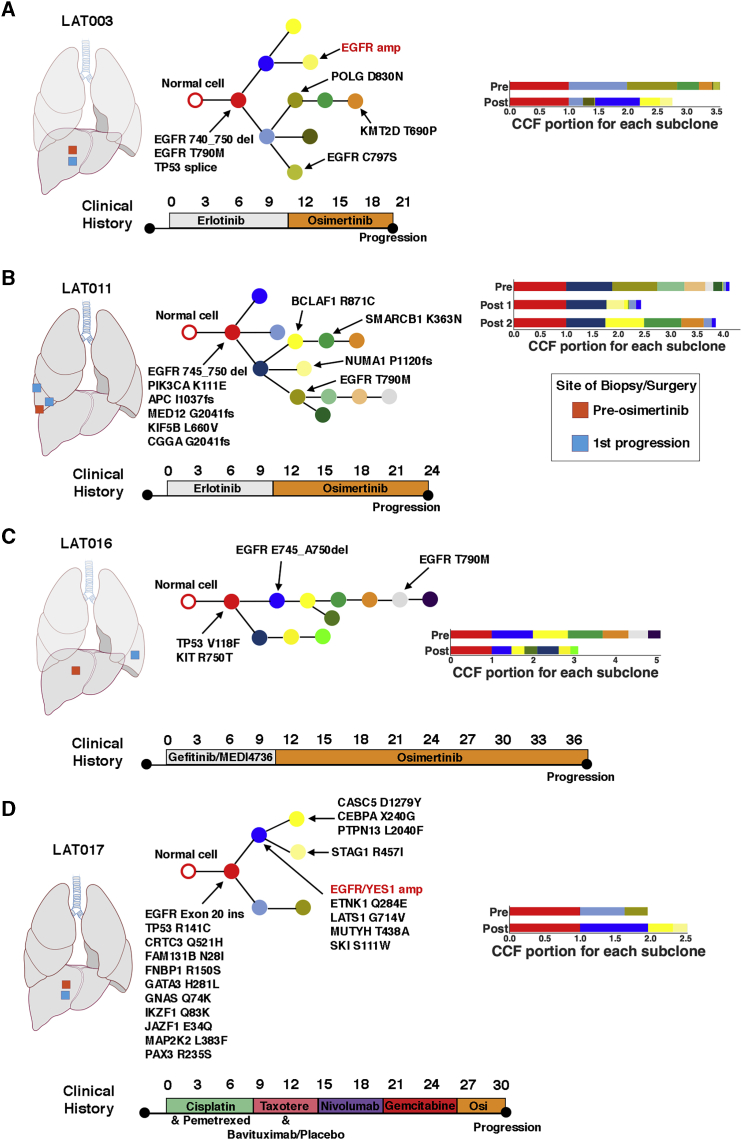
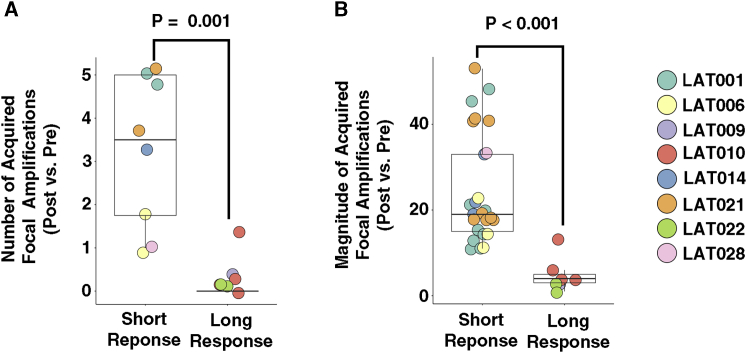
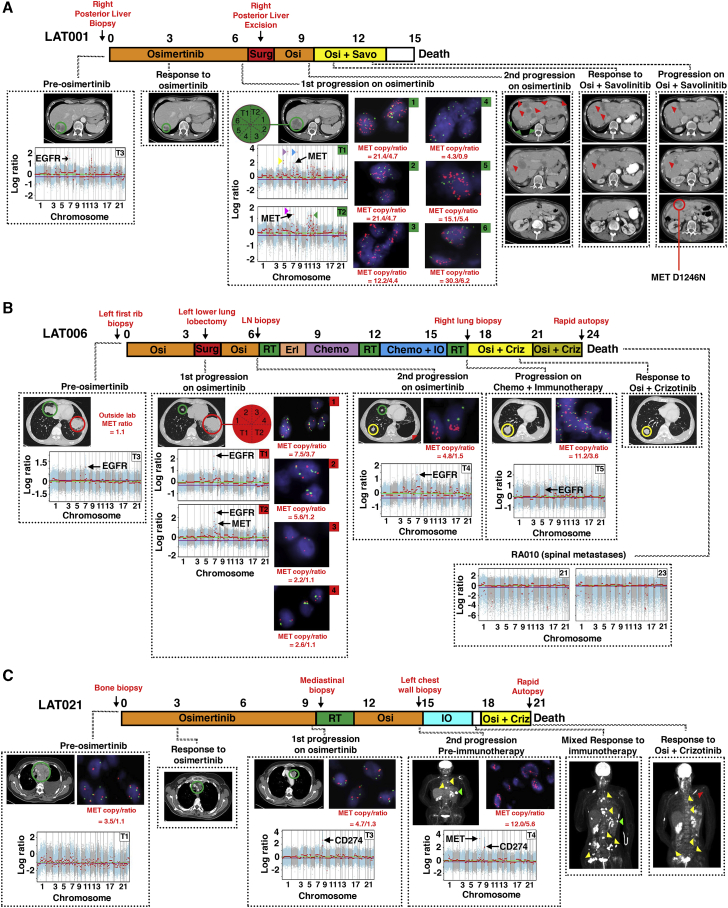
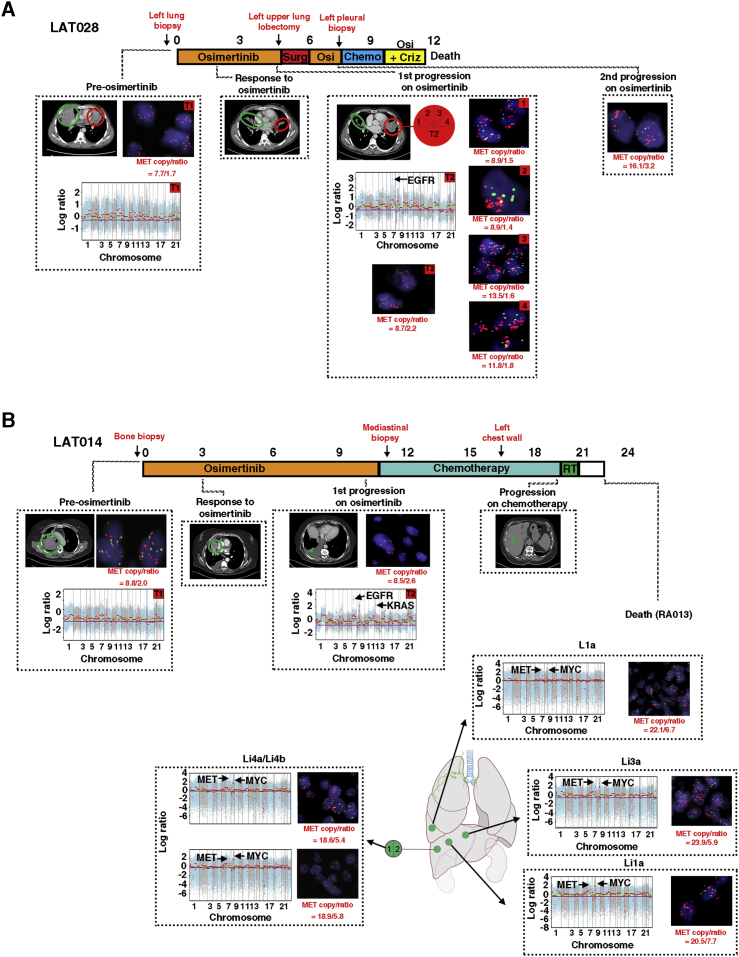
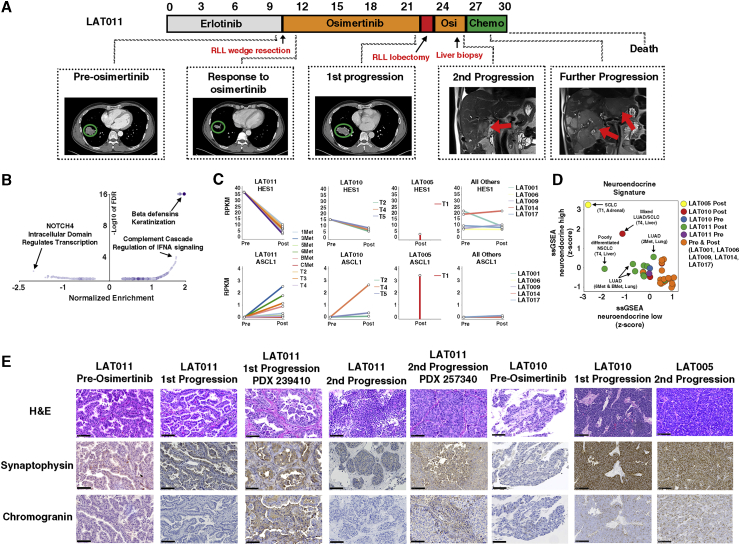
Clonal evolution of osimertinib-resistance mechanisms in EGFR mutant lung adenocarcinoma is poorly understood. Using multi-region whole-exome and RNA sequencing of prospectively collected pre- and post-osimertinib-resistant tumors, including at rapid autopsies, we identify a likely mechanism driving osimertinib resistance in all patients analyzed. The majority of patients acquire two or more resistance mechanisms either concurrently or in temporal sequence. Focal copy-number amplifications occur subclonally and are spatially and temporally separated from common resistance mutations such as EGFR C797S. MET amplification occurs in 66% (n = 6/9) of first-line osimertinib-treated patients, albeit spatially heterogeneous, often co-occurs with additional acquired focal copy-number amplifications and is associated with early progression. Noteworthy osimertinib-resistance mechanisms discovered include neuroendocrine differentiation without histologic transformation, PD-L1, KRAS amplification, and ESR1-AKAP12, MKRN1-BRAF fusions. The subclonal co-occurrence of acquired genomic alterations upon osimertinib resistance will likely require targeting multiple resistance mechanisms by combination therapies.

Trial registration: ClinicalTrials.gov NCT02759835.


Conflict of interest statement

C.K. receives research funding to his current institution (Georgetown University) from AstraZeneca, Novartis, and Tesaro and received one-time travel support from CARIS Life Science. C.T. owns stock in Gilead, Celgene, Exelixis, Clovis, and Trevena, and he is an employee of the Food and Drug Administration outside of the submitted work. Z.P. has served as a compensated consultant or received honoraria from AstraZeneca, Spectrum, Ariad/Takeda, Novartis, ImmunoGen, AbbVie, GuardantHealth, Genentech, Eli Lilly, InCyte, and Medtronic and receives institutional research funding from Novartis, Takeda, Spectrum, AstraZeneca, and Tesaro. U.G. has a clinical trial agreement (CTA) with AstraZeneca for the current study and receives research funding from AstraZeneca, Esanex, and Aurigene. U.G. is currently an employee of Bristol Myers Squibb. The other authors have no conflicts of interest to report.

Figures

None
Graphical abstract
Figure 1
Figure 1
Study Schema, Clinical Responses to Osimertinib, and Mechanisms of Resistance to Osimertinib (A) Schematic diagram of the clinical protocol and sample analysis. Biopsies and/or surgeries were performed pre-treatment, at first progression on osimertinib treatment, and at the second progression on osimertinib. Tumor tissue DNA and corresponding germline DNA were analyzed using WES. RNA-seq was also performed for select samples with sufficient material. PDXs were generated from post-osimertinib-resistant tumor tissue, when available. (B) Swimmer’s plot indicating line and length of osimertinib treatment, current treatment status, and whether pre- or post-osimertinib resistance sequencing was performed for individual patients. (C and D) Heatmaps depict the distribution of non-silent somatic mutations among pre- and post-osimertinib-resistant tumors for (C) first-line and (D) previously treated patients. Select COSMIC cancer gene mutations are listed to the left of each heatmap (all mutations are listed in Table S3). The total number of non-silent mutations and the percentage of non-truncal mutations are shown below each heatmap. The bars to the right of each heatmap summarize intra- and inter-metastatic heterogeneity; mutations present in all regions (purple), in more than one but not all (green), or only in one region (brown). Biological replicates at post-osimertinib resistance for individual patients are shown. (E) Table outlining osimertinib-resistance mechanisms among all patients, indicating whether paired pre- and post-osimertinib or post-osimertinib only tumor tissue was analyzed.
Figure 2
Figure 2
Clonal Evolution of Pre- and Post-osimertinib-Resistant Tumors from First-Line Osimertinib-Treated Patients (A–H) Phylogenetic trees representing the clonal architecture present in samples collected pre-osimertinib resistance and at first progression on osimertinib for patients (A) LAT001, (B) LAT006, (C) LAT009, (D) LAT010, (E) LAT014, (F) LAT021, (G) LAT0022, and (H) LAT028. Mutations and focal copy-number amplifications occurring in COSMIC cancer-related genes in each branch are indicated with arrows. Focal copy-number amplifications are highlighted in red. Clinical timeline from diagnosis of metastatic disease to progression on osimertinib for each subject is summarized below each phylogenetic tree. Anatomic locations of pre- and post-osimertinib-resistant tumors are shown for each subject. Color of circles in phylogenetic trees signal relative time point in tumor evolution: red (clonal), blue and yellow (early subclonal), and dark green, orange, and silver (late subclonal). Bar plots for each subject indicate the cancer cell fraction (CCF) of subclones for each tumor used to generate the phylogenetic trees. Biological replicates at post-osimertinib resistance for individual patients are shown. (I) Dual EGFR/MET in first progression tumor from subject LAT006. (J) Dual EGFR/KRAS FISH in progressive tumor from subject LAT014. Yellow arrows represent cells with amplification of EGFR/MET or KRAS/EGFR. White arrow represents cells with normal copies of EGFR/MET or KRAS/EGFR. WBRT, whole-brain radiation therapy; SRS, stereotactic radiosurgery; Osi, osimertinib; amp, amplification.
Figure 3
Figure 3
Clonal Evolution of Pre- and Post-osimertinib-Resistant Tumors from Patients with Prior Treatment with an EGFR Tyrosine Kinase Inhibitor Phylogenetic trees were constructed from WES of pre- and post-osimertinib-resistant tumors of patients (A) LAT003, (B) LAT011, (C) LAT016, and (D) LAT017. Mutations and CNAs in cancer-related genes in each branch are indicated with arrows. Clinical timeline from diagnosis of metastatic disease to progression on osimertinib for each subject is summarized below each phylogenetic tree. Anatomic locations of pre- and post-osimertinib-resistant tumors are shown for each subject. Color of circles in phylogenetic trees signal relative time point in tumor evolution: red (clonal), blue and yellow (early subclonal), and green, orange, silver (late subclonal). Biological replicates at post-osimertinib resistance for individual patients are shown. Osi, osimertinib; amp, amplification. Amplifications are shown in red. Bar plots for each subject indicate the cancer cell fraction (CCF) of subclones for each tumor used to generate the phylogenetic trees.
Figure 4
Figure 4
Multiple Acquired Focal Copy-Number Amplifications Are Associated with Short-Term Response to First-Line Osimertinib-Treated Patients (A and B) Number (A) and magnitude (B) of acquired focal copy-number amplifications in patients with short versus long PFS. Short PFS: <12 months; long PFS: ≥12 months’ progression-free survival. Focal copy-number amplifications are defined as >10 copies between post- and pre-osimertinib treatment tumors adjusted for tumor purity and within a region spanning ≤10 megabases. Statistical significance was calculated using the Mann-Whitney test. Calculated p values are shown. Biological replicates for individual patients are shown.
Figure 5
Figure 5
Heterogeneity of MET Amplification in the Development of Acquired Resistance to Osimertinib in Three Patients without Prior Therapy (A) Treatment timeline from diagnosis to death for subject LAT001. The subject began osimertinib treatment under this study upon the diagnosis of EGFR mutant metastatic lung adenocarcinoma. Imaging at first restaging showed a treatment response in the posterior liver (green circle). Upon first progression at 7 months, the subject underwent LAT (posterior liver excision, green arrows). After a second progression on osimertinib (red arrows), the subject began a clinical trial of osimertinib plus savolitinib. The subject responded to osimertinib plus savolitinib at day 43 (red arrows). The subject subsequently progressed on day 77 (yellow circle) and was found to harbor MET D1246N mutation. Block arrows represent focal amplifications in areas without cancer-related genes. Yellow: 5q11.2; purple: 6p21.1; blue: 8q21.3; magenta: 6q24.1; green: 11p11.2, 11p24.2, 11q23.3, 12p12.1. Red text signifies anatomic sites of biopsies. (B) Treatment timeline from diagnosis to death for subject LAT006. The subject started osimertinib therapy for metastatic EGFR mutant NSCLC. Three months after starting osimertinib, the tumor in the top-right lobe continued to respond (green circles), but the tumor in the bottom-left lobe progressed (red circles). The subject underwent LAT (bottom-left lung lobectomy, red arrow) and then osimertinib was reinitiated. At a second progression receiving osimertinib (yellow circle), the subject underwent stereotactic radiosurgery to the brain then started erlotinib followed by chemotherapy (carboplatin plus pemetrexed) followed by whole-brain radiation therapy and subsequently chemotherapy along with pembrolizumab. Upon progression (yellow circle), the subject had stereotactic radiosurgery to another brain lesion. The subject was then started on combination osimertinib and crizotinib to which the subject responded (yellow circle). Upon diagnosis of leptomeningeal disease, osimertinib was increased to 160 mg. Rapid autopsy was performed upon expiration. (C) Treatment timeline from diagnosis to death for subject LAT021. After the diagnosis of metastatic EGFR mutant NSCLC, the subject was initiated on osimertinib. First on-trial imaging demonstrated a partial response (green circles). At first progression on osimertinib, the subject underwent LAT (proton therapy) and then reinitiated osimertinib. At a second progression while receiving osimertinib, WES of the first progressive tumor showed PDL1 amplification therefore pembrolizumab was started. There was mixed response on pembrolizumab with green arrows showing a site of response and yellow arrows showing sites of progression. The second progressive tumor had MET in addition to PDL1 amplification; therefore, the subject was treated with osimertinib and crizotinib, and the subject had resolution of PET-avid disease in multiple metastatic sites (yellow arrows). Red arrow signifies a new PET-avid site. FACETS copy-number plots from tumor exome sequencing and FISH for MET for each subject are shown. Only cancer-related genes within focal copy-number amplifications are displayed. Biological replicates at post-osimertinib resistance for individual subjects are shown. RT, radiation therapy; IO, immunotherapy; Osi, osimertinib; Criz, crizotinib; Savo, savolinitib
Figure 6
Figure 6
Heterogeneity of MET Amplification in the Development of Acquired Resistance to Osimertinib in Subjects LAT014 and LAT028 without Prior Therapy (A) Treatment timeline from diagnosis to death for subject LAT028. The subject began treatment with osimertinib under this study upon the diagnosis of EGFR mutant metastatic lung adenocarcinoma. Imaging at first restaging showed a response to treatment in the posterior liver (green and red circle). Upon first progression (red circle), the subject underwent LAT (top-left lobectomy). (B) Treatment timeline from diagnosis to death for subject LAT014. The subject initiated treatment with osimertinib under this study upon the diagnosis of EGFR mutant metastatic lung adenocarcinoma. Imaging at first restaging showed a response to treatment in the right lung (green circle). At first progression, the subject had a new right pleural effusion and was not eligible for LAT. The subject underwent chemotherapy until progression in the liver (green arrow). At death, a rapid autopsy was performed. Red text signifies anatomic sites of biopsies. FACETS copy-number plots from tumor exome sequencing and FISH for MET for each subject are shown. Biological replicates at post-osimertinib resistance for individual subjects are shown. Only cancer-related genes within focal CNAs are shown. RT, radiation therapy; Osi, osimertinib; Surg, surgery
Figure 7
Figure 7
Neuroendocrine Differentiation with and without Histologic Transformation upon Osimertinib Resistance (A) Treatment timeline from diagnosis to death for subject LAT011. After receiving erlotinib, osimertinib treatment was initiated under this study. First, on-trial imaging demonstrated a reduction in tumor volume (green circles). First progression of disease occurred after 10 months in the bottom-right lobe. The subject then underwent LAT (bottom-right lobectomy) followed by re-initiation of osimertinib. A second progression occurred in the liver. Chemotherapy was initiated, but progression at multiple liver sites occurred, and the subject died soon after this rapid progression. (B) Volcano plot of reactome pathways enriched between post- and pre-osimertinib-resistant tumors across all LAT subjects. (C) Pre- and post-osimertinib-resistant RPKM values of ASCL1 and HES1 of all LAT subjects. Only post-osimertinib RNA-seq data were available for subject LAT005. (D) ssGSEA neuroendocrine differentiation scores of pre- and post-osimertinib-resistant LAT tumors. (E) Hematoxylin and eosin (H&E), synaptophysin, and chromogranin immunohistochemical staining of tumors from subjects LAT005, LAT010, and LAT011 before treatment and upon acquired osimertinib resistance. LAT011 PDXs derived from lung (first progression) and liver (second progression) are shown. Biological replicates at post-osimertinib resistance are shown. Scale bars, 100 μm. Osi, osimertinib; Chemo, chemotherapy.

References

    1. Chong C.R., Jänne P.A. The quest to overcome resistance to EGFR-targeted therapies in cancer. Nat. Med. 2013;19:1389–1400. - PMC - PubMed
    1. Oxnard G.R., Hu Y., Mileham K.F., Husain H., Costa D.B., Tracy P., Feeney N., Sholl L.M., Dahlberg S.E., Redig A.J. Assessment of Resistance Mechanisms and Clinical Implications in Patients With EGFR T790M-Positive Lung Cancer and Acquired Resistance to Osimertinib. JAMA Oncol. 2018;4:1527–1534. - PMC - PubMed
    1. Le X., Puri S., Negrao M.V., Nilsson M.B., Robichaux J., Boyle T., Hicks J.K., Lovinger K.L., Roarty E., Rinsurongkawong W. Landscape of EGFR -dependent and -independent resistance mechanisms to osimertinib and continuation therapy post-progression in EGFR-mutant NSCLC. Clin. Cancer Res. 2018;24:6195–6203. - PMC - PubMed
    1. Yang Z., Yang N., Ou Q., Xiang Y., Jiang T., Wu X., Bao H., Tong X., Wang X., Shao Y.W. Investigating Novel Resistance Mechanisms to Third-Generation EGFR Tyrosine Kinase Inhibitor Osimertinib in Non-Small Cell Lung Cancer Patients. Clin. Cancer Res. 2018;24:3097–3107. - PubMed
    1. Shi P., Oh Y.T., Deng L., Zhang G., Qian G., Zhang S., Ren H., Wu G., Legendre B., Jr., Anderson E. Overcoming Acquired Resistance to AZD9291, A Third-Generation EGFR Inhibitor, through Modulation of MEK/ERK-Dependent Bim and Mcl-1 Degradation. Clin. Cancer Res. 2017;23:6567–6579. - PMC - PubMed

Publication types

MeSH terms

Associated data