. 2020 Jun 2:9:e55470.
doi: 10.7554/eLife.55470.

Temperature compensation in a small rhythmic circuit

Affiliations

Temperature compensation in a small rhythmic circuit

Leandro M Alonso et al. Elife. .

Abstract

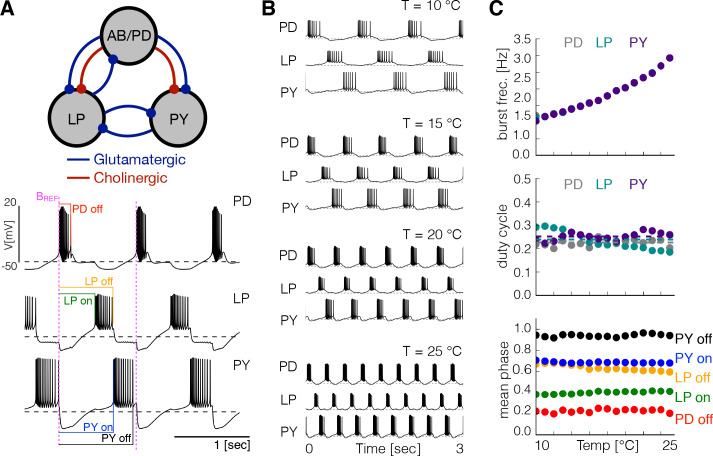
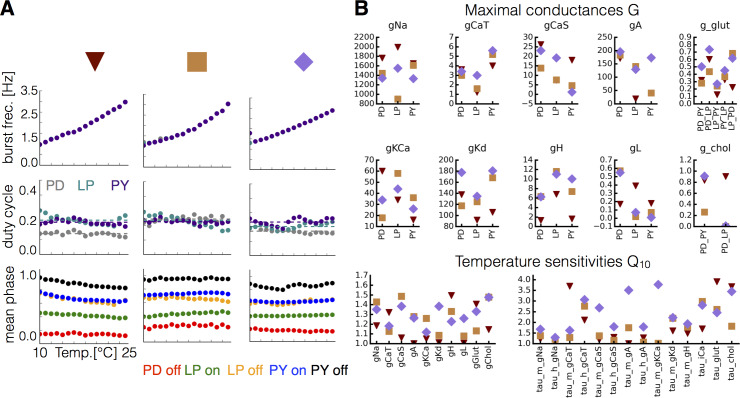
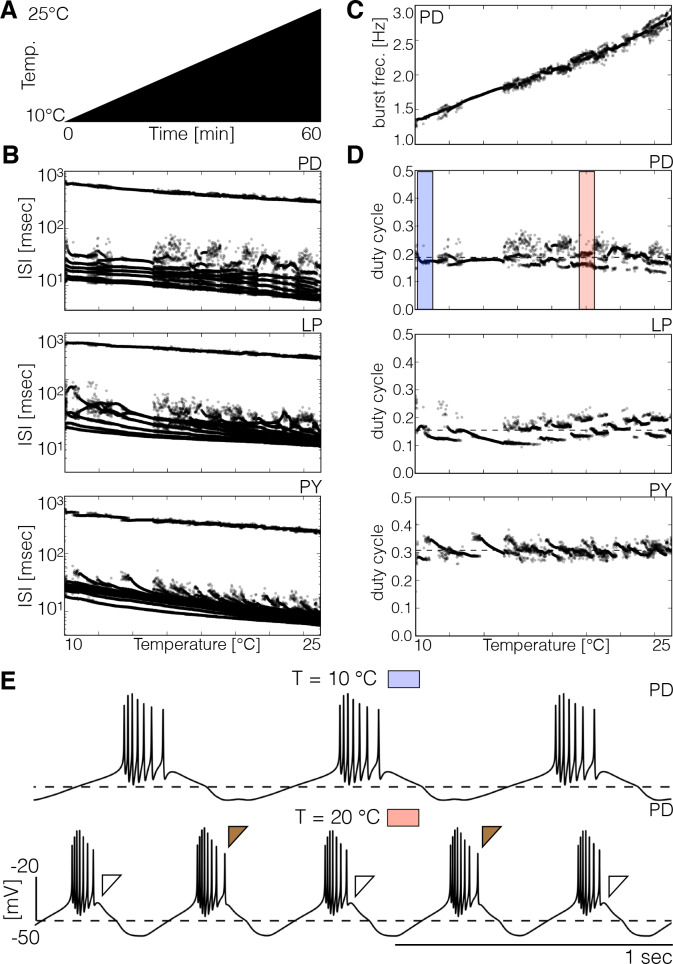
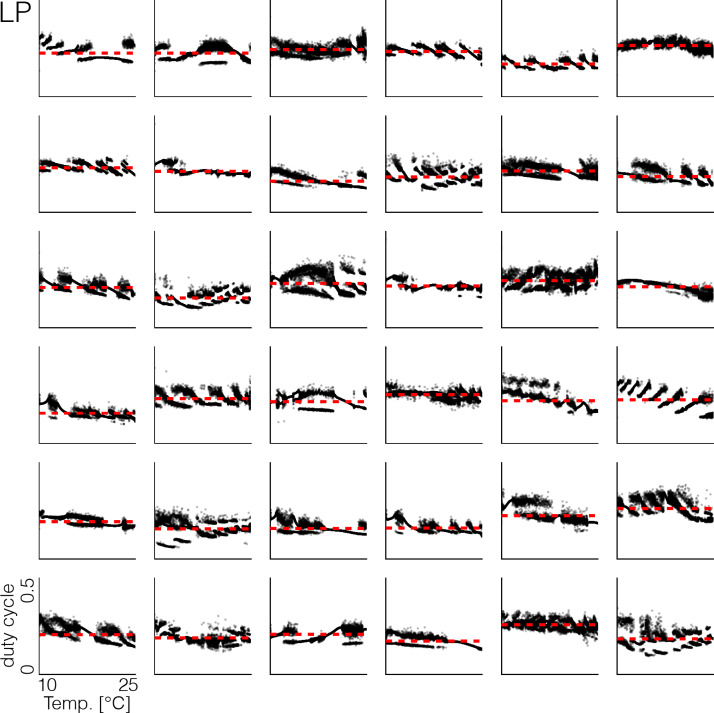
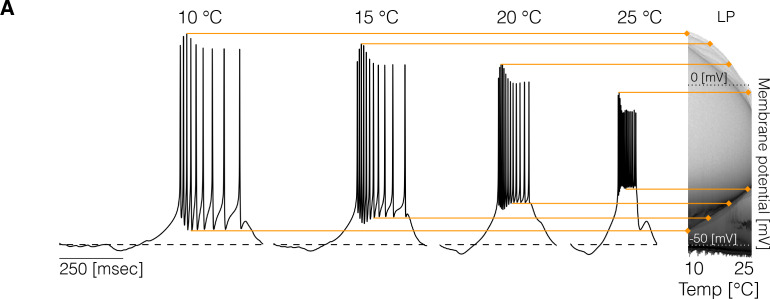
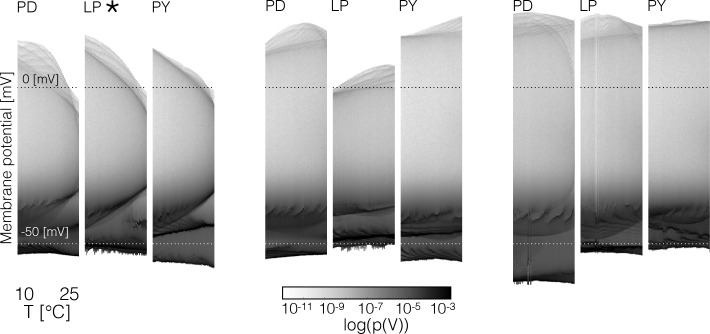
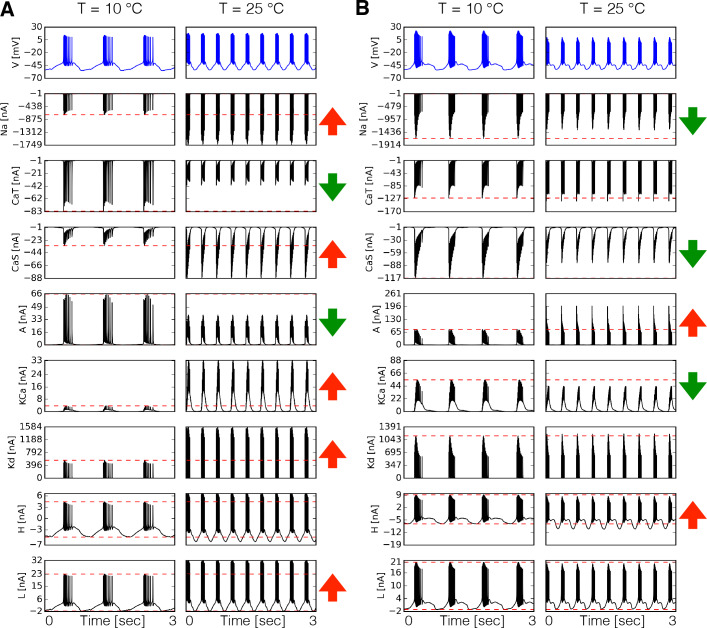
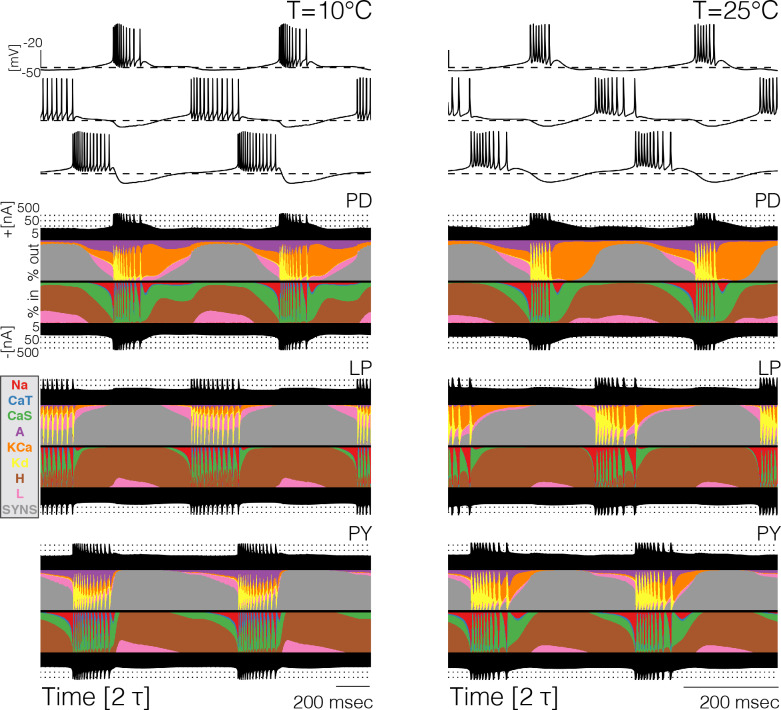
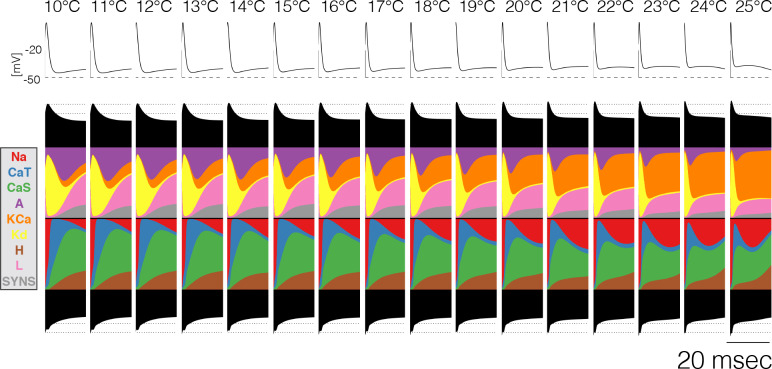
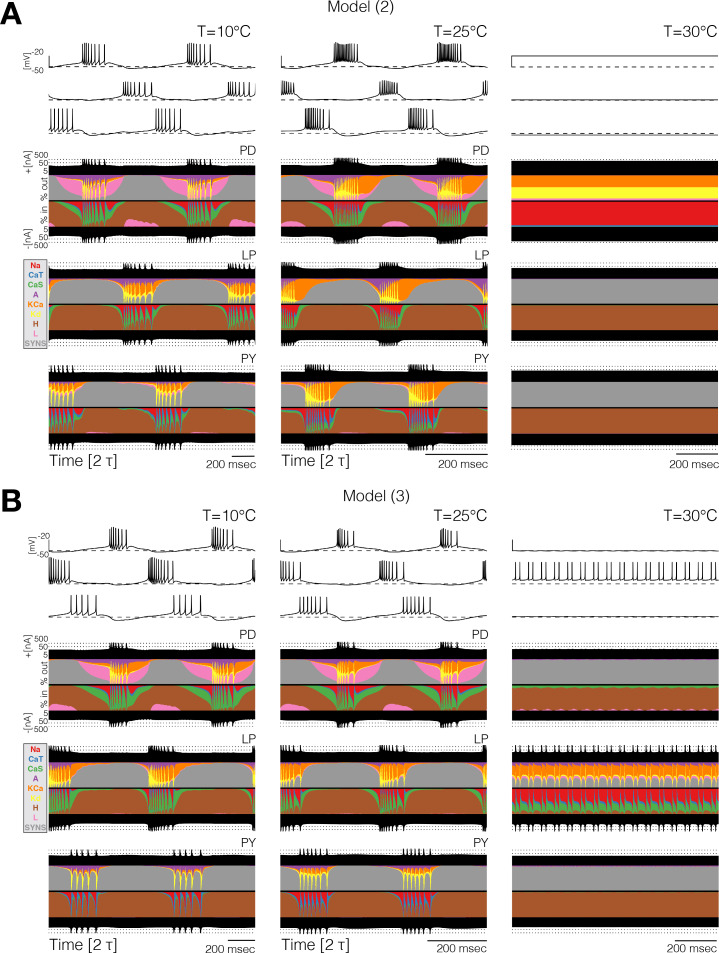
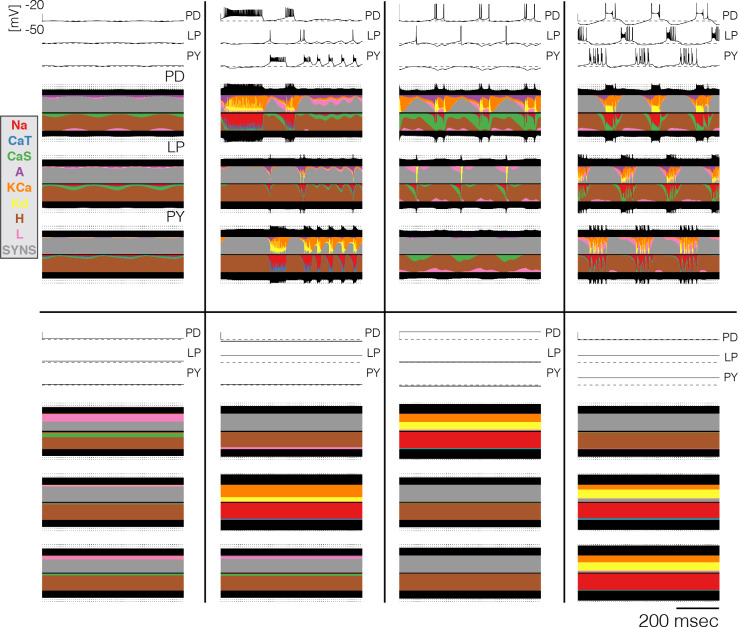
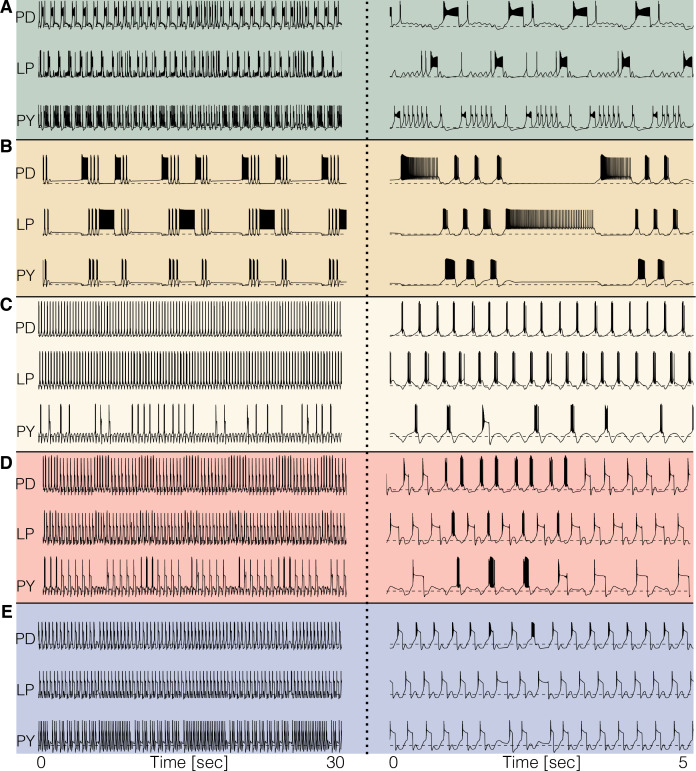
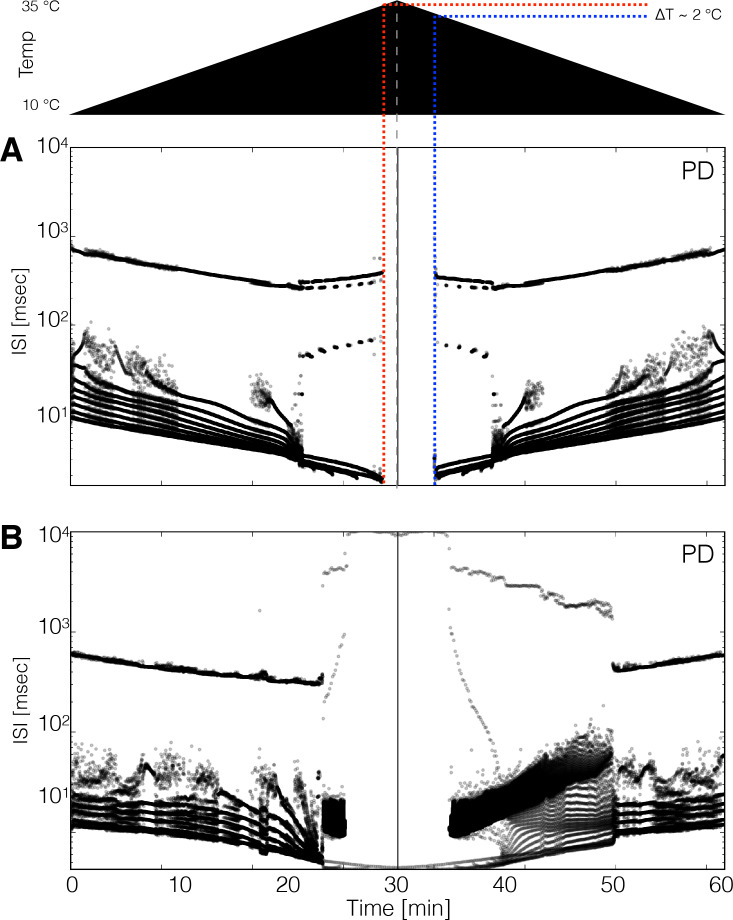
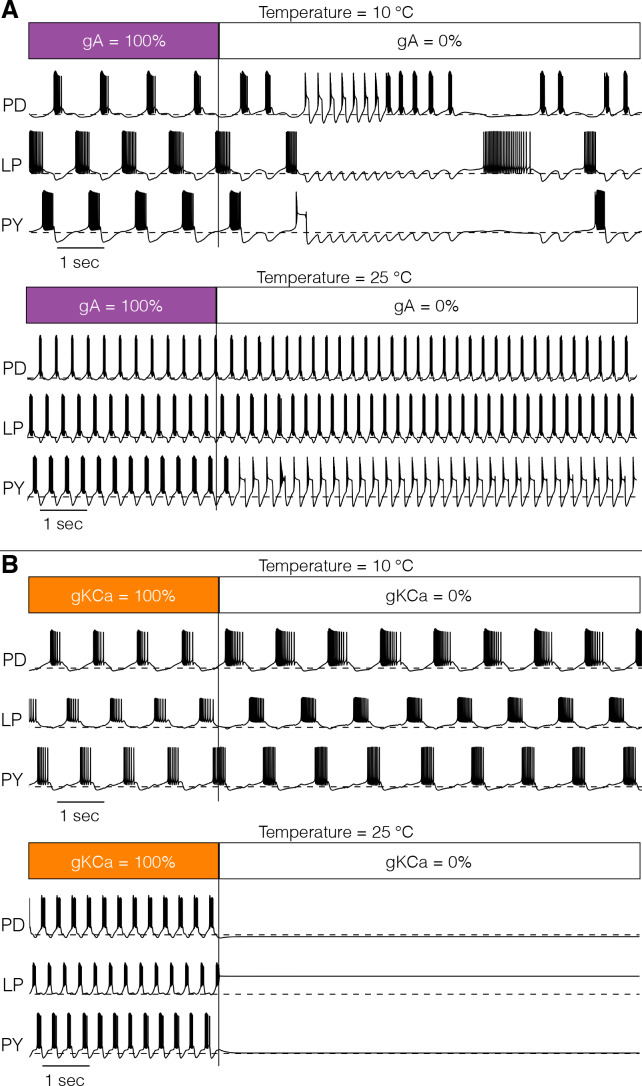
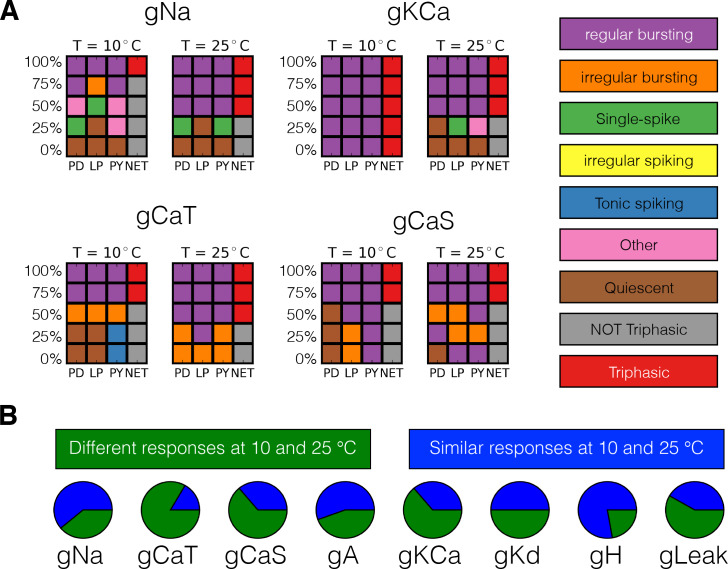
Temperature affects the conductances and kinetics of the ionic channels that underlie neuronal activity. Each membrane conductance has a different characteristic temperature sensitivity, which raises the question of how neurons and neuronal circuits can operate robustly over wide temperature ranges. To address this, we employed computational models of the pyloric network of crabs and lobsters. We produced multiple different models that exhibit a triphasic pyloric rhythm over a range of temperatures and explored the dynamics of their currents and how they change with temperature. Temperature can produce smooth changes in the relative contributions of the currents to neural activity so that neurons and networks undergo graceful transitions in the mechanisms that give rise to their activity patterns. Moreover, responses of the models to deletions of a current can be different at high and low temperatures, indicating that even a well-defined genetic or pharmacological manipulation may produce qualitatively distinct effects depending on the temperature.

Keywords: Q10; ion channels; neuronal oscillators; neuroscience; none; temperature.


Conflict of interest statement

LA, EM No competing interests declared

Figures

Figure 1.
Figure 1.. Effects of temperature in a model pyloric network.
(A) Schematic diagram of the model pyloric network in Prinz et al., 2004. The three groups interact via seven inhibitory chemical synapses. The red synapses are cholinergic from the PD neurons and all others are glutamatergic. The traces below show a representative solution that exhibits a triphasic rhythm: the activity is approximately periodic and the cells burst in a specific sequence: PD-LP-PY. (B) Activity of a temperature robust model network at 10°C - 25°C. As temperature increases the frequency of the rhythm increases but the duty cycle of the cells (the burst duration in units of the period) remains approximately constant. (C) Top: average burst frequency of each cell over temperature (values are nearly identical so dots overlap). Middle: average duty cycle of each cell (cell type indicated in colors). Bottom: average phases of the cycle at which bursts begin and terminate using the start of the PD burst as reference (indicated by label BREF in magenta). As temperature increases these phases remain approximately constant. The panels show average values over 30 s for 16 values of temperature between 10°C - 25°C.
Figure 1—figure supplement 1.
Figure 1—figure supplement 1.. Equivalent phenotype for different sets of maximal conductances and temperature sensitivities.
For each set of maximal conductances we studied, it was possible to find multiple sets of Q10 that yielded temperature compensated solutions. (A) Burst frequency (top), duty cycle (middle), and phases (bottom) over the working temperature range for three different models (indicated in colors). (B) Values of the maximal conductances (in μS) and Q10 for each model indicated by symbols (triangle, square, rectangle).
Figure 1—figure supplement 2.
Figure 1—figure supplement 2.. Spiking patterns during temperature ramps.
The spiking patterns of the cells exhibit interesting dependencies with temperature. (A) Schematic representation of the temperature ramp used in these simulations. Temperature was increased linearly between 10°C and 25°C over 60 min. (B) ISI of each cell over temperature (y-axis is logarithmic). The spiking patterns consist of one large ISI corresponding to the inter-burst interval (≥ 200 ms) and several smaller values produced by spikes within bursts. There are ranges of temperature over which the ISI takes almost the same values and the patterns result in nearly identical sets of points, and there are ranges where there is more variability. (C) Instantaneous frequency of each burst of the PD cell. (D) Duty cycle of each burst in each cell. While the duty cycle remains approximately constant on average, there are ranges of temperature for which the duty cycle alternates between two or more values (pink shaded box in PD. (E) Traces of the PD cell at 10°C (blue box) and 20°C (pink box). The brown filled and empty triangles indicate the prescence/abscence of a last spike in the burst which results in different duty cycle values for consecutive bursts.
Figure 1—figure supplement 3.
Figure 1—figure supplement 3.. Duty cycle distributions of all models.
Variability across models in duty cycle distributions of the LP cell as a function of temperature, during the same temperature ramp as in Figure 3. The precise shape of these patterns depends on the values of the maximal conductances and temperature sensitivities. Note that at all temperatures, the duty cycle of each burst remains close to the average duty cycle across temperatures (red dashed line), and thus is temperature invariant.
Figure 2.
Figure 2.. Changes in membrane potential over temperature.
(left) Representative traces of the LP cell in one model at different temperatures. (right) Membrane potential distribution at each temperature. The gray scale indicates the proportion of time the cell spends at that potential. The distribution facilitates inspecting how features such as the total amplitude of the oscillations and spiking thresholds change with temperature.
Figure 2—figure supplement 1.
Figure 2—figure supplement 1.. The panels show the membrane potential distributions of each cell over temperature for three models.
The oscillation amplitudes, spiking thresholds and other features of the sub-threshold activity show clear differences across models (* indicates the LP cell in Figure 2).
Figure 3.
Figure 3.. Dynamics of the currents at two temperatures.
Currents of the PD cell for two different models (A-B). Temperature increases the peak amplitudes of some currents and it decreases it for others, as indicated by the ⇑ and ⇓ arrows in red and green. The way these currents are modified can vary substantially across models.
Figure 4.
Figure 4.. Currentscapes at different temperatures.
The currentscapes use colors to display the percent contribution of each current type to the total inward and outward currents over time. The filled lines at the top and bottom indicate the total inward/outward currents in logarithmic scale. The panel shows the currentscapes for the three cells in the model at two temperatures. The panels show 2 periods τ of the oscillation.
Figure 5.
Figure 5.. Current contributions at the end of bursts across temperature.
The figure shows the currentscapes of the PD cell for the 20 ms following burst termination, and how these change over temperature (same model as in Figure 7A).
Figure 6.
Figure 6.. Currentscapes reveal that ‘crashes’ occur by different mechanisms.
Currentscapes of two networks at 10°C and 25°C showing phase compensation, and ‘crashes’ at 30°C.
Figure 6—figure supplement 1.
Figure 6—figure supplement 1.. Currentscapes at crashed states.
Currentscapes of the networks at high temperatures. Temperatures in these simulations listed in lexicographical order: 32°C, 30°C, 35°C, 29°C, 40°C, 35°C, 32°C, 32°C.
Figure 7.
Figure 7.. Disordered circuits at high temperatures.
The models become dysfunctional—or crash—at temperatures higher than 25°C and do so in different ways. (A-E) Membrane potential of five models. The traces on the left show 30 s of data and the traces on the right show an expanded trace of 5 s. Note the emergence of time scales much longer than that of the original rhythm. Temperatures in the simulations are (A–E): 34°C, 34°C, 33°C, 29°C, 30°C.
Figure 8.
Figure 8.. Hysteresis and multistability.
Temperature was increased from 10°C to 35°C and then decreased back to 10°C symmetrically. (Top) Schematic representation of the temperature ramp. Panels A and B show the ISI distributions of the PD cell over time for two different models. (A) The cell ceases to produce spikes before 600 s, which is also before reaching 35°C, and remains quiescent until temperature is ramped down. The temperature at which the cell resumes spiking is ≈ 2°C lower than the temperature at which it became quiescent, indicating that the system is multi-stable over that temperature range. (B) Hysteresis is more evident in this model. The spiking patterns during the down ramp differ visibly from those during the up ramp over a wide temperature range.
Figure 9.
Figure 9.. Response to perturbations at different temperatures.
The response of the models to extreme perturbations can be different at different temperatures. The figure shows the responses of models to the same perturbation at two different temperatures. (A) (top) Membrane potential over time at 10°C. The first 4 s correspond to the control condition with all currents intact. At T=4sec we removed the A current. (bottom) Same perturbation performed at 25°C (same model as in Figure 4). (B) Same protocol as in A but removing the KCa current in a different model (Figure 7A).
Figure 10.
Figure 10.. Classification of responses at different temperatures.
The models’ responses to perturbations are diverse and are in general different at different temperatures. We classified the responses of the models at two temperatures for five values of gradual decrements of each current. (A) Response to removal of Na, KCa, CaT and CaS currents for one model. (B) The pie charts show the number of models for which the responses to complete removal (0%) are classified as the same (green) or different (blue) at 10°C and 25°C.

References

    1. Abrams TW, Pearson KG. Effects of temperature on identified central neurons that control jumping in the grasshopper. The Journal of Neuroscience. 1982;2:1538–1553. doi: 10.1523/JNEUROSCI.02-11-01538.1982. - DOI - PMC - PubMed
    1. Alonso LM, Marder E. Visualization of currents in neural models with similar behavior and different conductance densities. eLife. 2019;8:e42722. doi: 10.7554/eLife.42722. - DOI - PMC - PubMed
    1. Bucher D, Taylor AL, Marder E. Central pattern generating neurons simultaneously express fast and slow rhythmic activities in the stomatogastric ganglion. Journal of Neurophysiology. 2006;95:3617–3632. doi: 10.1152/jn.00004.2006. - DOI - PubMed
    1. Buchholtz F, Golowasch J, Epstein IR, Marder E. Mathematical model of an identified stomatogastric ganglion neuron. Journal of Neurophysiology. 1992;67:332–340. doi: 10.1152/jn.1992.67.2.332. - DOI - PubMed
    1. Caplan JS, Williams AH, Marder E. Many parameter sets in a multicompartment model oscillator are robust to temperature perturbations. The Journal of Neuroscience. 2014;34:4963–4975. doi: 10.1523/JNEUROSCI.0280-14.2014. - DOI - PMC - PubMed

Publication types