. 2020 Jul 1;130(7):3603-3620.
doi: 10.1172/JCI133334.

PD-1 blockade inhibits osteoclast formation and murine bone cancer pain

Affiliations

PD-1 blockade inhibits osteoclast formation and murine bone cancer pain

Kaiyuan Wang et al. J Clin Invest. .

Abstract

Emerging immune therapy, such as with the anti-programmed cell death-1 (anti-PD-1) monoclonal antibody nivolumab, has shown efficacy in tumor suppression. Patients with terminal cancer suffer from cancer pain as a result of bone metastasis and bone destruction, but how PD-1 blockade affects bone cancer pain remains unknown. Here, we report that mice lacking Pdcd1 (Pd1-/-) demonstrated remarkable protection against bone destruction induced by femoral inoculation of Lewis lung cancer cells. Compared with WT mice, Pd1-/- mice exhibited increased baseline pain sensitivity, but the development of bone cancer pain was compromised in Pd1-/- mice. Consistently, these beneficial effects in Pd1-/- mice were recapitulated by repeated i.v. applications of nivolumab in WT mice, even though nivolumab initially increased mechanical and thermal pain. Notably, PD-1 deficiency or nivolumab treatment inhibited osteoclastogenesis without altering tumor burden. PD-L1 and CCL2 are upregulated within the local tumor microenvironment, and PD-L1 promoted RANKL-induced osteoclastogenesis through JNK activation and CCL2 secretion. Bone cancer upregulated CCR2 in primary sensory neurons, and CCR2 antagonism effectively reduced bone cancer pain. Our findings suggest that, despite a transient increase in pain sensitivity following each treatment, anti-PD-1 immunotherapy could produce long-term benefits in preventing bone destruction and alleviating bone cancer pain by suppressing osteoclastogenesis.

Keywords: Bone disease; Cancer; Cell Biology; Neuroscience; Pain.


Conflict of interest statement

Conflict of interest: RRJ is a consultant of Boston Scientific and received a research grant from the company. He also serves on the board of directors of Ascletis Pharma. RRJ and KW also filed a patent, Methods and kits for treating pain (16/612,909), in association with Duke University.

Figures

Figure 1
Figure 1. Protection of cancer-induced bone destruction and fracture in tumor-bearing Pd1−/− mice.
(A) Experimental diagram showing LLC inoculation and radiography. (B) Radiographs of tumor-bearing femora from WT mice and Pd1−/− mice on days 8, 11, and 15 after LLC inoculation. Bone destruction scores are indicated in photographs, and arrows indicate bone lesions with scores over 3. (C) Quantification of bone destruction scores (n = 10 mice). (D) Ratio of bone fracture on day 15 after tumor inoculation between WT mice and Pd1−/− mice (n = 10 mice). (E) Representative micro-CT images showing bone microstructure in the distal part of femora from naive WT and KO mice and tumor-bearing WT and KO mice 8 days after LLC inoculation. Note reduction of medullary bone and increased lesions in cortical bone in WT mouse after tumor implantation. (F) Quantification for E showing BV/TV and Conn.D in naive WT and KO mice with and without tumor (n = 3–7 male mice). Data are represented as mean ± SEM. *P < 0.05; ***P < 0.001, repeated measures 2-way ANOVA with Bonferroni’s post hoc test (C), Fisher’s exact test (D), and 2-way ANOVA with Bonferroni’s post hoc test (F). BL, baseline.
Figure 2
Figure 2. Reduction of persistent bone cancer pain in tumor-bearing Pd1−/− mice.
(A) Experimental diagram for behavioral tests. (B) von Frey test of withdrawal threshold (left) and frequency (right) in WT and Pd1−/− mice. Note that Pd1−/− mice exhibit increased basal mechanical sensitivity, but reduced mechanical allodynia, after tumor inoculation (n = 10 mice). (C) PAM showing knee hyperalgesia in WT and Pd1−/− mice (n = 10 mice). (D and E) Hargreaves and acetone tests showing heat hyperalgesia (D) and cold allodynia (E) in WT and Pd1−/− mice (n = 10 mice). Data are represented as mean ± SEM. WT versus KO. *P < 0.05; **P < 0.01; ***P < 0.001, repeated measures 2-way ANOVA with Bonferroni’s post hoc test.
Figure 3
Figure 3. Protection of cancer-induced bone destruction and fracture by i.v. nivolumab in tumor-bearing WT mice.
(A) Experimental diagram for IgG or nivolumab injection (10 mg/kg, i.v.) and radiography testing. (B) Radiographs of tumor-bearing femora of IgG- or nivolumab-treated mice. Bone destruction score is shown in each photograph, and arrows indicate bone lesions with destruction scores over 3. (C) Quantification of bone destruction scores (n = 17 or 19 mice). (D) Ratio of bone fracture of human IgG- and nivolumab-treated mice on day 15 (n = 17 or 19 mice). Note that bone fracture is protected by nivolumab. (E) Micro-CT images showing bone destruction in the distal part of tumor-bearing femora on day 8 after LLC inoculation. (F) Morphometric parameters from micro-CT showing higher BV/TV and Conn.D in distal part of ipsilateral femora in nivolumab group compared with human IgG group (n = 5–6 male mice) on day 8. Data are represented as mean ± SEM. *P < 0.05; ***P < 0.001, repeated measures 2-way ANOVA with Bonferroni’s post hoc test (C), Fisher’s exact test (D), and 2-tailed Student’s t test (F).
Figure 4
Figure 4. Effects of nivolumab on bone cancer pain and tumor burden in tumor-bearing WT mice.
(A) Experimental diagram for nivolumab or IgG treatment (10 mg/kg, i.v.) and behavioral tests. (B) von Frey test of withdrawal threshold (left) and frequency (right) (n = 17 or 19 mice). (C) PAM showing LLC-induced knee hyperalgesia in nivolumab- and human IgG–treated mice (n = 17 or 19 mice). (D and E) Hargreaves test (D) and acetone test (E) showing heat hyperalgesia (D) and cold allodynia (E) in human IgG– and nivolumab-treated mice (n = 17 or 19 mice). (F and G) In vivo bioluminescence imaging showing no effects of nivolumab or human IgG (5 × 10 mg/kg, i.v.) on total flux of LL/2-Luc2 bearing femur on days 8, 11, and 15 after tumor inoculation (n = 8 mice). Images were acquired at 15 minutes after i.p. injection of d-luciferin (30 mg/kg). Data are represented as mean ± SEM. *P < 0.05; **P < 0.01; ***P < 0.001, repeated measures 2-way ANOVA with Bonferroni’s post hoc test.
Figure 5
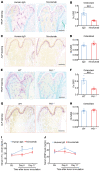
Figure 5. Effects of nivolumab or Pd1 deletion on TRAP+ osteoclasts and ALP + osteoblasts in tumor-bearing femur.
(A) Histological images of TRAP staining of osteoclasts in femurs from mice treated with human IgG or nivolumab (10 mg/kg, i.v.). Scale bar: 500 μm. (B) Quantification of TRAP staining in distal tumor-bearing femora (4–10 slices per femur, n = 5–6 male mice). (C) Histological images for ALP staining of osteoblasts of femur bones from human IgG– or nivolumab-treated mice. Scale bar: 500 μm. (D) Quantification of ALP staining of osteoblasts in distal femora (4–10 sections per femur, n = 5 male mice per group). (E and F) Representative images (E) and quantification of TRAP staining (F) in Pd1−/− mice and WT mice on postinoculation day 8 (4–10 slices per femur, n = 5 male mice). Scale bar: 500 μm. (G and H) Representative images (G) and quantification of ALP staining (H) showing osteoblasts in Pd1−/− mice and WT mice on postinoculation day 8 (4–10 slices per femur, n = 5 male mice). Scale bar: 500 μm. (I and J) ELISA analysis showing the effects of nivolumab and IgG on serum levels of CTX-I (I) and PINP (J) on postinoculation day. n = 6–7 male mice. Data are represented as mean ± SEM. *P < 0.05; ***P < 0.001, 2-tailed Student’s t test (B, D, F, and H) and repeated measures 2-way ANOVA with Bonferroni’s post hoc test (I and J). Oc.S/BS, osteoclast surface per trabecular bone surface; Ob.N/BS, osteoblast number per trabecular bone surface.
Figure 6
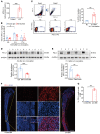
Figure 6. Bone cancer is associated with increased expression and secretion of PD-L1 in tumor-bearing mice.
(A) sPD-L1 in culture medium of LLC or control (medium only without cells) revealed by ELISA. 1–1.5 × 10⁶ cells were included per well. n = 4 cultures. (B) Increased serum sPD-L1 levels after tumor inoculation and the effects of human IgG and nivolumab. n = 6–7 male mice. (C) Flow cytometry analysis showing serum increase in PD-L1+ exosomes on day 8 after tumor inoculation. n = 4 male mice. NC, negative control. (D) Western blot revealing PD-L1 expression in ipsilateral (I) and contralateral (C) BM collected 8 days after tumor implantation. Top: representative Western blot bands. Bottom: quantification of PD-L1 expression levels. n = 6 male mice. (E) Western blot showing PD-L1 expression in tumor tissue of ipsilateral thigh (T) or paratumor tissue (P) 17 days after LLC inoculation. Top: Western blot bands. Bottom: quantification of PD-L1 expression. n = 4 male mice. (F) Immunostaining images showing PD-L1 expression in ipsilateral BM (Ipsi BM) and contralateral BM (Contra BM). Scale bar: 1000 μm. Low-magnification images on the left and right are enlarged in middle boxes. Scale bars: 50 μm. (G) Quantification of the percentage of PD-L1+ cells in BM. n = 3 male mice. Data are represented as mean ± SEM. *P < 0.05; **P < 0.01; ***P < 0.001, 2-tailed Student’s t test (A, C, D, E, and G) and repeated measures 2-way ANOVA with Bonferroni’s post hoc test (B).
Figure 7
Figure 7. Bone cancer is associated with increased PD-1 expression in tumor-bearing femora.
(A) Immunostaining images showing PD-1 expression in ipsilateral BM and contralateral BM on 8 days after inoculation. Scale bar: 1000 μm. Note the sample of contralateral BM here is the same as the contralateral BM shown in Figure 6F. Low-magnification images on the left and right are enlarged in middle boxes showing PD-1 staining in normal BM environment and in tumor microenvironment. Scale bars: 200 μm (contralateral BM); 100 μm (ipsilateral BM). (B) Double staining of PD-L1 (red) and PD-1 (white) in ipsilateral BM on day 8. The boxes in the left panels are enlarged in the right panels. Scale bars: 100 μm. (C and D) Increased expression of PD-1 in monocytes (C) and microphages (D) in ipsilateral BM inoculated with tumor compared with contralateral BM and BM of naive mice. Monocytes were labeled as CD3, CD45+, and CD14+ cells, and macrophages were identified as F4/80+ cells. Top: representative images of flow cytometry. Bottom: quantification of percentages of PD-1+ cells in monocyte and macrophage populations. n = 3–6 mice. Data are represented as mean ± SEM. *P < 0.05; **P < 0.01, 1-way ANOVA with Bonferroni’s post hoc test.
Figure 8
Figure 8. RANKL-induced osteoclastogenesis is promoted by PD-L1 via JNK.
(A) Representative images of RAW 264.7 cells stained for TRAP. Cells were stimulated with low-dose RANKL (20 ng/mL) and coincubated with human IgG (1 μg/mL), PD-L1 (100 ng/mL), or nivolumab (1 μg/mL) for 6 days. Arrows indicate TRAP+ multinucleated osteoclasts. Scale bar: 50 μm. (B) Quantification for A. n = 3 cultures. (C) Representative images of TRAP staining for BM cultures treated with human IgG (1 μg/mL), PD-L1 (100 ng/mL), or nivolumab (1 μg/mL) for 6 days. MCSF, 20 ng/mL; RANKL, 20 ng/mL. Arrows indicate TRAP+ multinucleated osteoclasts. Scale bar: 50 μm. (D) Quantification for C. n = 3 cultures. (E and F) Representative images (E) and quantification (F) of TRAP staining for primary BM cultures from WT mice or Pd1−/− mice treated with vehicle or PD-L1 (100 ng/mL). n = 3 cultures. Scale bar: 50 μm. (G and H) Western blot showing p-ERK, p-JNK, and p-p38 in BMDM treated with RANKL (20 ng/mL) or RANKL (20 ng/mL) together with PD-L1 (100 ng/mL) at different time points. (G) Representative Western blot bands. (H) Quantification for G. n = 3–4 cultures from 3 or 4 male mice. (I) Western blot showing the effect of nivolumab on PD-L1–enhanced phosphorylation of JNK. n = 3 cultures from 3 male mice. (J and K) Representative images (J) and quantification (K) of TRAP staining of primary BM cultures treated with PD-L1 (100 ng/mL) or SP600125 (10 μM). MCSF, 20 ng/mL; RANKL, 20 ng/mL. Scale bar: 50 μm. Data are represented as mean ± SEM. **P < 0.01; ***P < 0.001, 1-way ANOVA with Bonferroni’s post hoc test (B, D, F, I, and K) and 2-way ANOVA with Bonferroni’s post hoc test (H).
Figure 9
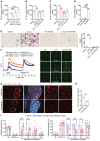
Figure 9. CCL2-CCR2 mediate PD-L1–induced osteoclast differentiation and bone cancer pain.
(AD) CCL2 levels in culture media of BMDM (AC) and in femur BM (D), revealed by ELISA. (A) Time-dependent CCL2 release during BM cell culture. MCSF, 20 ng/mL; RANKL, 40 ng/mL. n = 3 cultures. (B) Effects of PD-L1 (100 ng/mL, 1 hour) and SP600125 (20 μM) on CCL2 secretion. RANKL, 20 ng/mL. n = 4 cultures. (C) Effects of PD-L1 (100 ng/mL, 1 hour) and nivolumab (1 μg/mL) on PD-L1 secretion. n = 3 cultures. (D) CCL2 levels in BM lysate from naive mice and ipsilateral or contralateral side of LLC-inoculated mice on day 8. (E) Effects of CCL2 (50 ng/mL) and RS 504393 (1 μg/mL) on osteoclastogenesis in BM cells. MCSF, 20 ng/mL; RANKL, 20 ng/mL. Scale bar: 50 μm. n = 3 cultures. (F) Calcium influx following CCL2 treatment (50, 100, and 450 ng/mL) in cultured DRG neurons from Advillin-GCaMP6 mice. Left: average trace (n = 23–329 neurons of 3–6 coverslips from 4 mice). Right: representative images of calcium responses to CCL2 and capsaicin (300 nM). Scale bar: 100 μm. (G and H) In situ hybridization showing Ccr2 mRNA expression in ipsilateral and contralateral DRGs 15 days after tumor inoculation. (G) Representative images for Ccr2 mRNA, TuJ1, and DAPI expression. Scale bar: 100 μm. Boxes 1 and 2 are enlarged images. Scale bar: 50 μm. (H) Quantification for G (3 sections per DRG, n = 3 male mice). (I) LLC-induced mechanical allodynia in mice treated with RS504393 (10 or 30 mg/kg, i.p.) or vehicle (10% DMSO). n = 6 mice. Data in AE are represented as mean ± SEM. *P < 0.05; **P < 0.01; ***P < 0.001, 1-way ANOVA with Bonferroni’s post hoc test. 2-tailed Student’s t test used for H. Repeated measures 2-way ANOVA with Bonferroni’s post hoc test used for I. CAP, capsaicin.
Figure 10
Figure 10. Schematic of PD-L1 and PD-1 axis in modulation of osteoclast differentiation, bone destruction, and bone cancer pain.
In tumor-containing BM, tumor cells produce high levels of PD-L1 and further release sPD-L1. In the cancer microenvironment, PD-1 is highly expressed by preosteoclasts, including macrophages and monocytes, but not by mature osteoclasts. sPD-L1 binding PD-1 in preosteoclasts causes JNK activation and release of CCL2. CCL2 promotes the differentiation of osteoclasts. CCL2 also acts on CCR2 expressed on DRG neurons to elicit cancer pain. Furthermore, anti–PD-1 treatment with nivolumab could prevent the differentiation of preosteoclasts into osteoclasts in vitro and in vivo through the inhibition of CCL2 production and thus protect bone destruction and bone cancer pain.

References

    1. Costantini M, et al. Prevalence, distress, management, and relief of pain during the last 3 months of cancer patients’ life. Results of an Italian mortality follow-back survey. Ann Oncol. 2009;20(4):729–735. doi: 10.1093/annonc/mdn700. - DOI - PubMed
    1. Cleeland CS, et al. Does an oral analgesic protocol improve pain control for patients with cancer? An intergroup study coordinated by the Eastern Cooperative Oncology Group. Ann Oncol. 2005;16(6):972–980. doi: 10.1093/annonc/mdi191. - DOI - PubMed
    1. van den Beuken-van Everdingen MH, Hochstenbach LM, Joosten EA, Tjan-Heijnen VC, Janssen DJ. Update on prevalence of pain in patients with cancer: systematic review and meta-analysis. J Pain Symptom Manage. 2016;51(6):1070–1090.e9. doi: 10.1016/j.jpainsymman.2015.12.340. - DOI - PubMed
    1. Weilbaecher KN, Guise TA, McCauley LK. Cancer to bone: a fatal attraction. Nat Rev Cancer. 2011;11(6):411–425. doi: 10.1038/nrc3055. - DOI - PMC - PubMed
    1. Falk S, Dickenson AH. Pain and nociception: mechanisms of cancer-induced bone pain. J Clin Oncol. 2014;32(16):1647–1654. doi: 10.1200/JCO.2013.51.7219. - DOI - PubMed

Publication types

MeSH terms