. 2020 Aug 3;217(8):e20191734.
doi: 10.1084/jem.20191734.

Synaptic restoration by cAMP/PKA drives activity-dependent neuroprotection to motoneurons in ALS

Affiliations

Synaptic restoration by cAMP/PKA drives activity-dependent neuroprotection to motoneurons in ALS

Marcin Bączyk et al. J Exp Med. .

Abstract

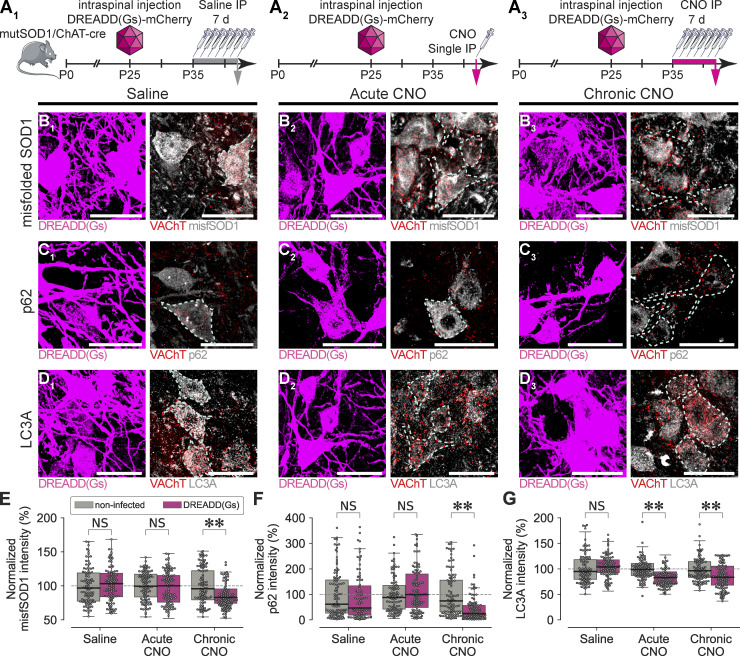
Excessive excitation is hypothesized to cause motoneuron (MN) degeneration in amyotrophic lateral sclerosis (ALS), but actual proof of hyperexcitation in vivo is missing, and trials based on this concept have failed. We demonstrate, by in vivo single-MN electrophysiology, that, contrary to expectations, excitatory responses evoked by sensory and brainstem inputs are reduced in MNs of presymptomatic mutSOD1 mice. This impairment correlates with disrupted postsynaptic clustering of Homer1b, Shank, and AMPAR subunits. Synaptic restoration can be achieved by activation of the cAMP/PKA pathway, by either intracellular injection of cAMP or DREADD-Gs stimulation. Furthermore, we reveal, through independent control of signaling and excitability allowed by multiplexed DREADD/PSAM chemogenetics, that PKA-induced restoration of synapses triggers an excitation-dependent decrease in misfolded SOD1 burden and autophagy overload. In turn, increased MN excitability contributes to restoring synaptic structures. Thus, the decrease of excitation to MN is an early but reversible event in ALS. Failure of the postsynaptic site, rather than hyperexcitation, drives disease pathobiochemistry.


Conflict of interest statement

Disclosures: The authors declare no competing interests exist.

Figures

None
Graphical abstract
Figure 1.
Figure 1.
Monosynaptic Ia EPSPs are smaller in mutant mice. (A) Stimulation and recording arrangement for tendon vibrations (450 Hz) of TS. (B) Responses in a wtSOD1 (B1) and a mutSOD1 (B2) MN. (1) Membrane potential; (2) ENG recording showing the response of the Ia sensory afferents to the vibration; and (3) vibration. Arrows on the voltage traces indicate the peak deflection at which EPSP amplitude was measured (the subsequent sag is most likely caused by a deactivation of the Ih current; Manuel et al., 2007). The insert is an expansion between the vertical dashed lines showing the modulations of the ENG (which reflect the activity of Ia afferents; blue trace) and the EPSP summation (green trace) upon the repetition of vibrations (vertical bar, 5 mV; horizontal bar, 5 ms). A summation of the EPSPs elicited by the successive vibrations occurs because the vibration period (2.5 ms) is shorter than the single EPSP duration: the EPSP elicited by the first vibration (filled arrowhead in the insert) is smaller than the EPSPs elicited by the subsequent vibrations (unfilled arrowheads). (C) Comparison of EPSP amplitudes from wtSOD1 (7.3 ± 4.7 mV, n = 32, seven mice) and mutSOD1 mice (5.1 ± 3.5 mV, n = 33, eight mice). MW, *, P = 0.015. (D) Stimulation and recording arrangement for TS nerve stimulations. (E) Representative traces of the maximal group I volley (top trace, [1]) and EPSP (bottom trace, [2]) recorded in a wtSOD1 (E1) and a mutSOD1 MN (E2). Red asterisks above the volley indicate the stimulation time. (F) Comparison of the maximal electrically evoked EPSP in wtSOD1 (3.9 ± 1.1 mV, n = 37, seven mice) and mutSOD1 animals (2.6 ± 1.2 mV, n = 34, nine mice), t test, ****, P < 0.0001. (G) Peak input resistance (wtSOD1: 3.7 ± 1.2 MΩ, n = 35; vs. mutSOD1: 3.5 ± 1.1 MΩ, n = 32, MW, P = 0.768). (H) Membrane time constant (wtSOD1: 3.4 ± 1.2 ms, n = 30; vs. mutSOD1: 3.3 ± 1.2 ms, n = 23, MW, P = 1.0). (I) Resting potential (wtSOD1: −69.6 ± 8.3 mV, n = 36; vs. mutSOD1: −66.4 ± 7.5 mV, n = 34, MW, P = 0.32). These properties were also not different in the MN sample tested with tendon vibration (not depicted); peak input resistance: wtSOD1: 3.8 ± 1.8 MΩ, n = 31; vs. mutSOD1: 3.5 ± 1.4 MΩ, n = 33, MW, P = 0.55; membrane time constant: wtSOD1: 3.2 ± 1.4 ms, n = 29; vs. mutSOD1: 3.4 ± 1.2 ms, n = 33, MW, P = 0.37; resting membrane potential: wtSOD1: −65.9 ± 10.3 mV, n = 32; vs. mutSOD1: −67.7 ± 10.3 mV, n = 33; MW, P = 0.50. (J and K) Afferent volleys (top traces) and EPSPs (bottom traces) recorded from triceps MNs evoked by two group I stimulations separated by 10-ms intervals. The stimulation intensity was adjusted to obtain submaximal EPSP amplitude. Overlay: Superimposed first and second volleys and EPSPs (black thin line, first EPSP; thicker colored trace, second EPSP). EPSP changes were not related to afferent volley fluctuations (see top traces) and were therefore caused by synaptic plasticity. (L) Comparison of the paired-pulse ratios (PPRs) of second versus first EPSP for wtSOD1 and mutant mice. For 12 of 25 mutSOD1 MNs, the paired-pulse stimulation resulted in a depression (<100%). Such a depression was not seen in wtSOD1 MNs. On average, the PPR was significantly smaller in MNs from mutant animals (0.99 ± 0.06, n = 25, from eight mice) compared with MNs from controls (1.11 ± 0.06, n = 31, from seven mice, MW, ****, P < 0.0001). Note that the EPSP decay time constant (measured on the first EPSP) was not different in mutSOD1 MNs (2.7 ± 1.0 ms, n = 25) compared with wtSOD1 MNs (2.6 ± 1.5 ms, n = 31, MW, P = 0.35; not depicted). All records were obtained with the Na+ channel blocker QX-314 in the microelectrode intracellular solution to prevent spiking. In all graphs, each point represents one MN.
Figure S1.
Figure S1.
Inputs to TS MNs and presynaptic inhibition of Ia terminals. (A) Recordings from a mutSOD1 MN following nerve stimulation at different intensities normalized to the threshold intensity for the afferent volley. The stimulation was gradually increased up to 5× threshold. Top blue traces: Afferent volley recorded on the dorsal surface of the spinal cord. Bottom green traces: Membrane potential of the MN. The red dot designates the stimulation time. Stimulation artifacts were truncated. The central latency between the volley and the EPSP onset is <0.5 ms, indicating that the EPSP is monosynaptic. (B) Quantification of the amplitude of the EPSP measured at the peak (green dots and curve) and the peak-to-peak amplitude of the volley (unfilled squares and curve), showing that both reach a maximum at ∼2× threshold intensity. At higher stimulation intensities, the amplitude plateaus, and we did not observe disynaptic EPSPs despite the possible recruitment of group II afferents. (C) Recording of Renshaw inhibition in a separate experiment, showing that disynaptic inhibition (vertical blue dotted line) arrives at longer latency than the peak of the monosynaptic EPSP. The motor axons in the nerve (L3–L5 dorsal roots cut) were stimulated at 200 Hz (red dots) to elicit a visible Renshaw inhibition through temporal facilitation. Note that it was not possible to isolate Ib inhibition or group II inhibition from Ia excitation, but these inhibitions are disynaptic and thus cannot occur faster than Renshaw inhibition. Therefore, the peak measurement of the monosynaptic EPSP is not contaminated by any inhibition. (D–H) Presynaptic inhibition in mouse MNs. We investigated whether Ia terminals from the TS are subject to presynaptic inhibition following a conditioning stimulation of group I afferents from posterior biceps (PB), i.e., the most classic pathway for presynaptic inhibition (Rudomin and Schmidt, 1999). (D) The left panel shows the unconditioned Ia monosynaptic EPSP on a wtSOD1 TS MN; the right panel shows the same Ia EPSP conditioned by group I afferents from the PB. The conditioning stimulation (black dots) is a train of three electric stimulations at 200 Hz that precedes the stimulation of the TS (red dots) by 23 ms. The conditioning stimulation reduces the test EPSP. We repeated this experiment in 14 wtSOD1 MNs (F) in which the conditioning stimulation elicited an average reduction of the test Ia EPSP of 6 ± 8%; paired t test, **, P = 0.004. Asterisk, example in D. (E) Presynaptic inhibition in a mutSOD1 MNs. Same arrangement as in D. We repeated this experiment in 13 mutSOD1 MNs (G) on which the conditioning stimulation elicited an average reduction of the test Ia EPSP of 5 ± 6%; paired t test, **, P = 0.006. Asterisk, example in E. (H) The effect of the conditioning stimulation on the size of Ia EPSPs was the same in wtSOD1 and mutSOD1 MNs (t test, P = 0.50), indicating that the strength of presynaptic inhibition is similar in the two phenotypes. Experiments were performed in four wtSOD1 mice and six mutSOD1 mice.
Figure S2.
Figure S2.
No change in the presynaptic structure of VGluT1+ synapses onto MNs. (A) Examples of immunolabeled VGluT1+ synapses juxtaposed to the soma of a WT and a mutSOD1 TS MN labeled with cholera toxin b (CTb). Scale bar: 20 µm. Insets show a 3D reconstruction of the cell soma with the location of the VGluT1+ boutons in blue. Arrowheads point to synapses visible in the optical plane of the corresponding example. (B) Immunolabeled VGluT1+ synapses on proximal dendritic segments of a WT and a mutSOD1 Neurobiotin-filled (NB) MN. Filled arrowheads point to VGluT1+ synapses on dendritic varicosities (vacuolized in the case of the mutSOD1 MN). The unfilled arrowhead points to a synapse at a distance from the vacuole. Scale bars: 5 µm. (C) Estimation of the synaptic density of VGluT1+ boutons on the soma. WT: 1.6 ± 0.5 synapses/100 µm2, n = 23 (three mice); vs. mutSOD1 2.0 ± 0.8 synapses/100 µm2; n = 17 (three mice); MW, P = 0.18. (D1) Estimation of the density of VGluT1+ boutons on proximal dendrites. WT: 28 ± 20 synapse/100 µm, n = 29 (four mice); vs. mutSOD1: 29 ± 23 synapse/100 µm, n = 29 (four mice); MW, P = 0.85. (D2) Estimation of the density of VGluT1+ boutons on distal dendrites. WT: 6 ± 4 synapse/100 µm, n = 14 (four mice); vs. mutSOD1: 7 ± 5 synapse/100 µm, n = 13 (four mice); MW, P = 0.90. (E) Synaptophysin labeling in VGluT1+ synapses juxtaposed to a MN identified by VAChT labeling. Dotted line represents the approximate outline of the MN. Note that the intensity of the VAChT signal was intentionally boosted to highlight the presence of an intracellular signal in addition to the presence of the C-boutons to identify MNs. (F) Bassoon labeling. Scale bars: 10 µm (inset: 1 µm). (G and H) No difference in cluster area of VGluT1 (WT: 1.85 ± 1.41 µm2, n = 179; vs. mutSOD1: 1.90 ± 1.36 µm2, n = 202; MW, P = 0.73) or in VGluT1 fluorescence intensity in WT and mutSOD MNs (WT: 1,459 ± 315, n = 179; vs. mutSOD1: 1,494 ± 350, n = 202; MW, P = 0.45). (I and J) No difference in cluster size of synaptophysin (WT: 2.22 ± 1.13 µm2, n = 91; vs. mutSOD1: 2.28 ± 1.04 µm2, n = 75; MW, P = 0.55) or synaptophysin immunostaining intensity (WT: 1,653 ± 190, n = 91; vs. mutSOD1: 1,669 ± 203, n = 75; MW, P = 0.61) inside VGluT1+ synapses. (K and L) No difference in the size of bassoon puncta relative to the size of the VGluT1+ bouton (WT: 24 ± 26%, n = 36; vs. mutSOD1: 17 ± 14%, n = 37; MW, P = 0.44) or bassoon puncta immunostaining intensity (WT: 1073 ± 97, n = 118; vs. mutSOD1: 1,072 ± 103, n = 118; MW, P = 0.68) in WT and mutSOD MNs. Each point on the graphs represents one synapse. Experiments in EL were conducted on four WT and four mutSOD1 mice.
Figure 2.
Figure 2.
Alterations in the postsynaptic structure of VGluT1+ synapses onto MNs. (A and B) The size of Shank1 clusters juxtaposed to VGluT1+ terminals on MNs is significantly reduced in mutSOD1 MNs (WT: 0.92 ± 0.96 µm2, n = 164; vs. mutSOD1: 0.48 ± 0.62 µm2, n = 149; MW, ****, P < 0.0001). (C and D) Homer1b clusters juxtaposed to VGluT1+ synapses are significantly smaller in mutSOD1 (WT: 1.35 ± 1.31 µm2, n = 86; vs. mutSOD1: 0.43 ± 0.52 µm2, n = 78; MW, ****, P < 0.0001). (E–G) Representative images showing the GluR4 (E), phospho-GluR1 (F), and phospho-GluR2 (G) clusters at VGluT1+ synapses in WT and mutSOD1 MNs. (H and I) Significant reduction in GluR4 cluster area (WT: 0.56 ± 0.39 µm2, n = 99; vs. mutSOD1: 0.25 ± 0.20 µm2, n = 64; MW, ****, P < 0.0001) and fluorescence intensity (WT: 1542 ± 319, n = 99 vs. mutSOD1: 1300 ± 220, n = 64; MW, ****, P < 0.0001) in mutSOD1 mice. (J and K) Significant decrease in pGluR1 cluster area (WT: 1.04 ± 0.68 µm2, n = 132; vs. mutSOD1: 0.45 ± 0.34 µm2, n = 96; MW, ****, P < 0.0001) and fluorescence intensity (WT: 915 ± 218, n = 132; vs. mutSOD1: 785 ± 122, n = 96; MW, ****, P < 0.0001) in mutSOD1 mice. (L and M) Significant decrease in pGluR2 cluster area (WT: 0.55 ± 0.37 µm2, n = 89; vs. mutSOD1: 0.39 ± 0.29 µm2, n = 109; MW, ***, P = 0.0004) and fluorescence intensity (WT: 1401 ± 281, n = 89; vs. mutSOD1: 1173 ± 198, n = 109; MW, ****, P < 0.0001) in mutSOD1 mice. Each data point represents a single synapse. In all panels, the dotted line represents the approximate outline of the MNs. Scale bars: 10 µm (insert: 1 µm). The experiment was conducted on three WT and three mutSOD1 mice at P40.
Figure S3.
Figure S3.
MN dendrites of mutSOD1 animals display age-dependent vacuolization. (A) Dendritic varicosities (unfilled arrowheads) in a WT MN at P51. (B) Dendritic varicosities (unfilled arrowheads) in a wtSOD1 MN at P98. (C) In mutSOD1 MNs, many varicosities display vacuoles (filled arrowheads). In contrast, dendritic varicosities do not display any vacuole in wtSOD1 MNs (B), indicating that the vacuoles do not result from the transgenes by themselves but are the consequence of the mutation. In mutSOD1 MNs, the vacuoles increase in size over time (C). Scale bars: 10 µm.
Figure 3.
Figure 3.
Postsynaptic activation of the PKA pathway enhances Ia EPSPs and restores synaptic structures. (A) Effect of iontophoretic injection of cAMPS-Sp on Ia EPSP amplitude. Afferent volleys (top traces) and EPSPs in TS MNs (bottom traces) evoked by electrical stimulation of the TS nerve recorded immediately before and a few minutes after the injection of the compound. (B) Effect of iontophoretic injection of cAMPS-Sp on paired-pulse ratios. Same MNs and same time points as in A. (C) Quantification of the increase in EPSP size. “Before” values were measured just before the injection; “after” values are averages over the whole duration of the recording after the injection. Each symbol represents one MN, and the stars next to the symbols represent the MNs shown in A. (C1) In wtSOD1 animals (four mice), cAMPS-Sp increased the size of the EPSPs by 7 ± 8%; n = 7; paired t test, *, P = 0.04. (C2) In mutSOD1 animals (two mice), the EPSP size increased by 14 ± 5% on average, n = 6; paired t test, **, P = 0.007. In mutant animals, the experiments were conducted in four MNs: Ia EPSPs coming from either of the two TS branches were tested in two MNs, whereas only one source of Ia excitation was tested in the remaining two MNs (see different symbols and line styles in C2). The difference persists if we consider only EPSPs elicited by stimulation of the LG nerve in each MN. The EPSP size increased by 14 ± 6% on average, n = 4; paired t test, P = 0.02. (D) Quantification of the change in the paired-pulse ratio after cAMPS-Sp injection. Same organization as in C. In wtSOD1 animals (four mice), cAMPS-Sp did not significantly change the paired-pulse ratio (D1, average difference 1 ± 2%; n = 6, paired t test, P = 0.23), while it caused an increase by 5 ± 5%, n = 6 in mutSOD1 animals (D2, two mice, paired-pulse ratio before, 1.00 ± 0.06, n = 6; vs. after, 1.05 ± 0.08, n = 6; paired t test, *, P = 0.038). As before, the difference persists if we consider only EPSPs elicited by the LG nerve in each MN. cAMPS-Sp increased the paired-pulse ratio from 1.00 ± 0.07 to 1.05 ± 0.10, n = 4; paired t test, P = 0.048. (E) Experimental design for DREADD experiments. (F) MNs expressing D(Gs) and immunostained for VGluT1 and GluR4 under either vehicle (F1), acute CNO (F2), or chronic CNO treatment (F3). The dotted line represents the approximate outline of the MNs. MNs are identified by VAChT staining. Scale bars: 20 µm (inset: 1 µm). (G) Same organization as F, but immunostained for VGluT1 and Homer1b. (H) Significant increase in GluR4 cluster area in VGlut1 synapses of D(Gs)+ MNs (magenta) compared with contralateral D(Gs) MNs (gray) upon acute (4.3 ± 2.6 µm2, n = 43; vs. 2.3 ± 1.7 µm2, n = 27; from three mice; two-way ANOVA followed by Tukey HSD, **, P = 0.001) and chronic (3.9 ± 2.5 µm2, n = 144; vs. 2.3 ± 1.5 µm2, n = 128; from four mice; Tukey HSD, **, P = 0.001) CNO treatment, but not in vehicle-treated mice (2.1 ± 1.6 µm2, n = 119; vs. 2.3 ± 1.6 µm2, n = 111; from three mice; Tukey HSD, P = 0.9). (I) Significant increase in Homer1b cluster area in D(Gs)+ MNs compared with contralateral D(Gs) MNs upon acute (2.4 ± 1.6 µm2, n = 109; vs. 1.8 ± 1.2 µm2, n = 83; two-way ANOVA followed by Tukey HSD, **, P = 0.0147) and chronic (2.4 ± 1.5, n = 88; vs. 1.6 ± 1.4 µm2, n = 69; from four mice; Tukey HSD, **, P = 0.0019) CNO treatment, but not in vehicle-treated mice (1.4 ± 1.2 µm2 in D(Gs)+ MNs, n = 51; vs. 1.3 ± 1.6 µm2 in D(Gs) MNs, n = 117; from three mice; Tukey HSD, P = 0.9).
Figure S4.
Figure S4.
Chemogenetic excitation of MNs rescues synaptic structure. (A) Image of the ventral spinal cord of a mouse injected intraspinally with an AA9 expressing inhPSAM. This section was very close to the injection site, and the infection rate was very high there, as shown by the fact that very few MNs (identified by VAChT labeling, red) did not express inhPSAM (green). Scale bar: 50 µm. (B) Timeline for the unilateral intraspinal injection of AAV9 5HT3-PSAM (actPSAM) in double transgenic mutSOD1/ChAT-cre mice followed by injection of the specific ligand PSEM308. (C and D) GluR4 (C) and Homer1b (D) immunolabeling either in noninfected MNs (actPSAM) or MNs expressing actPSAM (actPSAM+). The inset on the right is an enlargement of the region indicated with a white rectangle. In all panels, dotted lines represent the approximate outline of the MNs. Scale bar: 10 µm (inset: 1 µm). (E) Quantification of GluR4 cluster area at VGluT1+ synapses in actPSAM infected MN (actPSAM+) versus contralateral noninfected MN (actPSAM). ActPSAM MNs: 0.4 ± 0.3 µm2, n = 37; vs. actPSAM+ MNs: 0.8 ± 0.4 µm2, n = 47; MW, ****, P < 0.0001. (F) Quantification of Homer1b cluster area at VGluT1+ synapses in actPSAM-infected MNs (actPSAM+) versus contralateral noninfected MNs (actPSAM). actPSAM MNs: 0.6 ± 0.8 µm2, n = 44; vs. actPSAM+ MNs: 1.1 ± 0.9 µm2, n = 62; MW, ***, P = 0.0002. Each point on the graphs represents one synapse. (G and H) The specificity of the GluR4 antibody is demonstrated on the cerebellum of WT (G) and Gria4 knockout (H) animals. Note the dense GluR4 labeling (green) in the molecular layer of WT animals while the labeling is almost completely absent in Gria4−/− animals despite the dense VGluT2 labeling (red). Scale bars: 100 µm.
Figure 4.
Figure 4.
PKA effects on the postsynaptic side of Ia terminals do not depend on MN intrinsic excitation. (A) Experimental design for the double-chemogenetics control of MN excitation (by PSAM-GlyR-GFP, for brevity inhPSAM) and PKA signaling (by D(Gs)-mCherry) on synaptic GluR4 and Homer1b levels. (B) Uninfected MN (inhPSAM/D(Gs); B1), MNs expressing either inhPSAM only (inhPSAM+/D(Gs), green; B2), D(Gs) only (D(Gs)+/inhPSAM, magenta; B3), or both (D(Gs)+/inhPSAM+, white; B4) and immunostained for VGluT1 and GluR4. (C) Representative images of uninfected MN (C1) or expressing either inhPSAM only (green; C2) or D(Gs) only (magenta; C3) or both (white; C4) and immunostained for VGluT1 and Homer1b. The outline of each MN is marked by the dashed line. Scale bars: 20 µm (inset: 1 µm). (D) Activation of inhPSAM causes only a minor increase in GluR4 cluster area compared with noninfected MNs (1.84 ± 0.81, n = 97; vs. 1.35 ± 0.84 µm2, n = 95; one-way ANOVA followed by Tukey HSD, *, P = 0.02) whereas D(Gs) activation enhances GluR4 cluster area in VGluT1+ synapses (2.59 ± 1.45 µm2; n = 70; Tukey HSD, **, P = 0.001 compared with noninfected MNs, and P = 0.001 compared with inhPSAM+/D(Gs) MNs). The concomitant inactivation of MNs by inhPSAM and the activation of D(Gs) did not reduce the effect of D(Gs) (2.45 ± 1.30 µm2; n = 175; Tukey HSD, P = 0.80 vs. D(Gs)+/inhPSAM MNs). (E) D(Gs) activation increased the size of Homer1b clusters (3.14 ± 2.01 µm2; n = 51) compared with noninfected MNs (2.10 ± 1.41 µm2; n = 106; ANOVA followed by Tukey HSD, **, P = 0.003). Notably, inhPSAM by itself did not have any effect on Homer1b cluster area (2.23 ± 1.27 µm2; n = 52; Tukey HSD, P = 0.9) and did not diminish the effect of D(Gs) activation (3.46 ± 2.12 µm2; n = 91; Tukey HSD, P = 0.68). This experiment was conducted on five mutSOD1/ChAT-cre mice.
Figure 5.
Figure 5.
PKA activation in MNs decreases the disease markers. (A) Experimental design of vehicle treatment (A1; three mice), acute activation of the D(Gs) (A2; three mice), and chronic activation of the D(Gs) (A3; three mice). (B) MNs expressing D(Gs) and immunostained for misfolded SOD1 (B8H10) under vehicle (B1), acute CNO (B2), or chronic CNO (B3) treatment. (C) MNs expressing D(Gs) and immunostained for p62 under vehicle (C1), acute CNO (C2), or chronic CNO (C3) treatment. Arrowheads points to p62 aggregates. (D) MNs expressing D(Gs) and immunostained for LC3A under vehicle (D1), acute CNO (D2), or chronic CNO (D3) treatment. MNs are identified by VAChT staining. The dotted line represents the approximate outline of the MNs. Scale bars: 20 µm. (E) misfSOD1 levels in MNs are decreased in D(Gs)+ MNs (magenta) compared with contralateral noninfected MNs (gray) upon chronic CNO treatment (85.3 ± 16.7% of uninfected; two-way ANOVA followed by Tukey HSD, **, P = 0.001), but not upon acute CNO (97.1 ± 23.6% of uninfected) or vehicle treatment (102.0 ± 24.7% of uninfected). Each data point represents a single MN. (F) The burden of p62 inclusion in D(Gs)+ MNs was not modified by vehicle (90.6 ± 91.7% of contralateral uninfected) or acute CNO (116.2 ± 84.8% of uninfected) treatment but was reduced compared with contralateral noninfected MNs upon chronic CNO treatment (42.9 ± 50.6% of contralateral; Tukey HSD, **, P = 0.001). (G) LC3A immunostaining intensity in MNs was unaltered in D(Gs)+ neurons compared with contralateral noninfected MNs upon vehicle treatment (104.7 ± 22.2% of uninfected), whereas acute D(Gs) activation (84.8 ± 18.6% of uninfected; Tukey HSD, **, P = 0.001) or chronic D(Gs) activation (84.8 ± 22.9% of uninfected; Tukey HSD, **, P = 0.001) resulted in a significant decrease in LC3A intensity.
Figure 6.
Figure 6.
PKA decreases disease markers through enhanced MN firing. (A) Experimental design for the double-chemogenetics controls of MN excitation (by inhPSAM) and PKA signaling (by D(Gs)-mCherry) on synaptic levels of misfolded SOD1 proteins and LC3A. (B) Representative images of uninfected MN (inhPSAM/D(Gs); B1), MNs expressing inhPSAM only (inhPSAM+/D(Gs), green; B2), D(Gs) only (D(Gs)+/inhPSAM, magenta; B3), or both (D(Gs)+/inhPSAM+, white; B4) and immunostained for misfolded SOD1 (B8H10). (C) Same arrangement of MNs immunostained for LC3A. The outlines of infected MNs are shown with a dashed line. Scale bars: 20 µm. (D) Reduction of MN firing by inhPSAM did not significantly affect the misfSOD1 burden (112.9 ± 24.5% of control noninfected; one-way ANOVA followed by Tukey HSD, P = 0.087). In contrast, D(Gs) activation significantly reduced misfSOD1 burden (74.2 ± 29.0% of control uninfected; Tukey HSD, **, P = 0.001). However, reduction of MN firing combined with D(Gs) activation abolished the beneficial effect of the D(Gs) alone (95.9 ± 31.6% of uninfected; Tukey HSD, **, P = 0.001). (E) The accumulation of LC3A in MNs was significantly increased upon reduced firing by inhPSAM (116.7 ± 18.3% of control; one-way ANOVA followed by Tukey HSD, **, P = 0.001) and significantly decreased by D(Gs) activation (90.1 ± 16.8% of control noninfected; Tukey HSD, **, P = 0.001); the reduction of MN firing significantly decreased the effect of concomitant D(Gs) activation (103.8 ± 18.0% of control; Tukey HSD, **, P = 0.001). Data from five mutSOD1/ChAT-cre animals per group.
Figure 7.
Figure 7.
Chemogenetic manipulations impact the activity of the MNs. (A) Experimental design for the assessment of single- and double-chemogenetic treatments on c-Fos expression in MNs. (B) Little (unfilled arrowhead) or moderate (filled arrowhead) expression of c-Fos in noninfected MNs. (C) Because of very low levels at baseline, inhPSAM does not further decrease c-Fos expression. (D) Activation of actPSAM significantly increased the expression of c-Fos in infected MNs. (E) Activation of DREADD(Gs) significantly increased the expression of c-Fos in infected MNs. (F) Double-chemogenetic experiments yielded MNs that were infected solely with AAV encoding D(Gs), a few MNs that were infected solely with inhPSAM (not depicted), and MNs infected by both D(Gs) and inhPSAM AAVs (filled arrowheads). In MNs expressing both inhPSAM and D(Gs), c-Fos levels were significantly lower than in those expressing D(Gs) alone. (G) Quantification of c-Fos levels across the different treatments: noninfected: 400 ± 310 AU, n = 145; vs. inhPSAM: 369 ± 219 AU, n = 68; one-way ANOVA followed by Tukey HSD, P = 0.9; actPSAM 750 ± 372 AU, n = 24; Tukey HSD, **, P = 0.001 vs. noninfected; D(Gs) alone 1,200 ± 569 AU, n = 103; Tukey HSD, **, P = 0.001 vs. noninfected, and **, P = 0.001 vs. actPSAM; D(Gs) + inhPSAM: 720 ± 424 AU, n = 71; Tukey HSD, **, P = 0.001 vs. D(Gs) alone. In all panels, the dashed lines show the approximate outline of the MN cell bodies. Scale bars: 50 µm. Data are from four independent mutSOD1/ChAT-Cre mice.
Figure 8.
Figure 8.
Impairment of descending EPSPs evoked by MLF stimulation and of VGlut2 postsynaptic structures on MNs. (A) Superimposed recordings from a wtSOD1 and a mutSOD1 MN in response to a 200-Hz train stimulation of the MLF repeated at 3 Hz. The responses displayed a mixture of monosynaptic (black arrows) and disynaptic (unfilled arrow) EPSPs. Note that the first shock in the train elicited essentially a monosynaptic response. Top trace: Volley recorded at the cervical level. Middle trace: Volley recorded at the lumbar level. Bottom trace: Membrane potential of the MN. Stimulation artifacts were truncated. (B) Comparison of the amplitude of the first (monosynaptic) EPSP of the train. wtSOD1: 0.9 ± 0.5 mV, n = 19; vs. mutSOD1: 0.6 ± 0.3 mV, n = 20; MW, *, P = 0.022. (C) Comparison of the amplitude of the last EPSP of the train (late response of the complex EPSP that includes nonmonosynaptic components, unfilled arrowhead). wtSOD1: 3.9 ± 1.6 mV; n = 21; vs. mutSOD1: 2.5 ± 1.1 mV; n = 17; MW, *, P = 0.012. (D) The input resistance was not significantly different between wtSOD1 and mutSOD1 MNs: 3.9 ± 1.5 MΩ, n = 20; vs. 3.7 ± 1.1 MΩ, n = 19; t test, P = 0.71. (E) The membrane time constant was not significantly different between wtSOD1 and mutSOD1 MNs: 3.1 ± 1.0 ms, n = 20; vs. 3.0 ± 0.7 ms, n = 19; t test, P = 0.84. (F) The resting membrane potential was not significantly different between wtSOD1 and mutSOD1 MNs: −66.7 ± 8.2 mV, n = 20; vs. mutSOD1: −65.2 ± 7.0 mV, n = 19; t test, P = 0.54. Each point on the graphs represents one MN. Experiments were performed in seven mutSOD1 mice and six wtSOD1 mice. (G–J) The postsynaptic side of VGluT2+ synapses was disrupted. Each panel shows a large view of the MN (scale bar: 20 μm) with a zoom of the region(s) inside the box(es) in inset (scale bars: 2 μm). The dashed lines show the approximate contour of the MN cell bodies. (G) GluR4 cluster area was significantly reduced in mutSOD1 MNs: 0.08 ± 0.05 µm2, n = 980; vs. WT: 0.11 ± 0.07 µm2, n = 780; t test, ****, P = 1.8 × 10⁻²⁵. (H) Phosphorylated GluR1 cluster area was also significantly decreased: mutSOD1: 0.10 ± 0.08 µm2, n = 986; vs. WT: 0.12 ± 0.09 µm2, n = 989; t test, ****, P = 1.1 × 10⁻⁵. (I) Phosphorylated GluR2 cluster area was reduced compared with controls: mutSOD1: 0.11 ± 0.11 µm2, n = 487; vs. WT: 0.19 ± 0.13 µm2, n = 478; t test, ****, P = 3.0 × 10⁻²². (J) The cluster area of the postsynaptic scaffolding protein Shank2 was reduced in mutSOD1 MNs compared with controls: mutSOD1: 0.10 ± 0.08 µm2, n = 587; vs. WT: 0.20 ± 0.19 µm2, n = 604; t test, ****, P = 6.5 × 10⁻²⁷. (K) In contrast, the size and labeling intensity of the presynaptic VGluT2+ boutons was slightly increased in mutant animals. mutSOD1 VGluT2 bouton size: 0.57 ± 0.38 µm2, n = 587; vs. WT: 0.50 ± 0.37 µm2, n = 586; t test, **, P = 0.004 (K1); mutSOD1 VGluT2 labeling intensity: 791 ± 194 AU, n = 587; vs. WT: 757 ± 185 AU, n = 586; t test, **, P = 0.0017 (K2).
Figure S5.
Figure S5.
Methodological considerations for MLF-evoked EPSP measurements. (A) Representation of the path of the stimulation electrode (dashed line) in stereotaxic coordinates (adapted from Franklin and Paxinos, 2008). (B) Recordings of the lumbar volley produced by a single shock stimulation at 25 μA at each of the depths represented by a cross in A. The electrode was placed where the amplitude of the volley was maximal (in this case, 5.3 mm). (C) At the end of the experiment, an electrolytic lesion was performed at the location of the stimulation electrode to confirm correct placement. Scale bar: 0.5 mm. (D) Example of recording in which only monosynaptic EPSPs were visible (filled arrow). Note the lack of disynaptic EPSP “bump” on the response to the last stimulation. (E) Example of recording in which only disynaptic excitation (unfilled arrowhead) was visible. In this cell, the stimulation of descending fibers did not evoke monosynaptic EPSP, indicating that they did not project directly to this MN. The disynaptic EPSP started to appear in response to the second stimulation (unfilled arrowhead) and grew upon stimulation repetition, indicating temporal summation of the excitatory interneurons activated by the descending fibers. The latency of disynaptic response is ∼1 ms longer than for the monosynaptic response. Note that because this MN did not display any monosynaptic component, it was not included in our analysis.
Figure 9.
Figure 9.
Schematic representation of the main findings. Chemogenetic interventions (in green) on intrinsic excitability (using actPSAM) and dysfunctional excitatory synapses (in red) through the cAMP/PKA pathway converge to restore adequate MN firing, which in turn reduces the burden of cellular abnormalities that drives MN degeneration.

Similar articles

Cited by

References

    1. Akay T., Tourtellotte W.G., Arber S., and Jessell T.M.. 2014. Degradation of mouse locomotor pattern in the absence of proprioceptive sensory feedback. Proc. Natl. Acad. Sci. USA. 111:16877–16882. 10.1073/pnas.1419045111 - DOI - PMC - PubMed
    1. Aldrin-Kirk P., Heuer A., Wang G., Mattsson B., Lundblad M., Parmar M., and Björklund T.. 2016. DREADD Modulation of Transplanted DA Neurons Reveals a Novel Parkinsonian Dyskinesia Mechanism Mediated by the Serotonin 5-HT6 Receptor. Neuron. 90:955–968. 10.1016/j.neuron.2016.04.017 - DOI - PMC - PubMed
    1. Alstermark B., and Ogawa J.. 2004. In vivo recordings of bulbospinal excitation in adult mouse forelimb motoneurons. J. Neurophysiol. 92:1958–1962. 10.1152/jn.00092.2004 - DOI - PubMed
    1. Alvarez F.J., Titus-Mitchell H.E., Bullinger K.L., Kraszpulski M., Nardelli P., and Cope T.C.. 2011. Permanent central synaptic disconnection of proprioceptors after nerve injury and regeneration. I. Loss of VGLUT1/IA synapses on motoneurons. J. Neurophysiol. 106:2450–2470. 10.1152/jn.01095.2010 - DOI - PMC - PubMed
    1. Babiec W.E., Guglietta R., and O’Dell T.J.. 2016. Basal levels of AMPA receptor GluA1 subunit phosphorylation at threonine 840 and serine 845 in hippocampal neurons. Learn. Mem. 23:127–133. 10.1101/lm.040675.115 - DOI - PMC - PubMed

Publication types

MeSH terms

Substances