. 2020 Jun 2:9:e51260.
doi: 10.7554/eLife.51260.

Dopaminergic modulation of the exploration/exploitation trade-off in human decision-making

Affiliations

Dopaminergic modulation of the exploration/exploitation trade-off in human decision-making

Karima Chakroun et al. Elife. .

Abstract

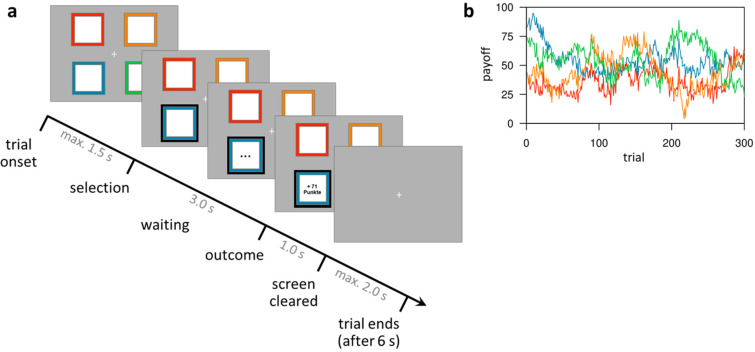
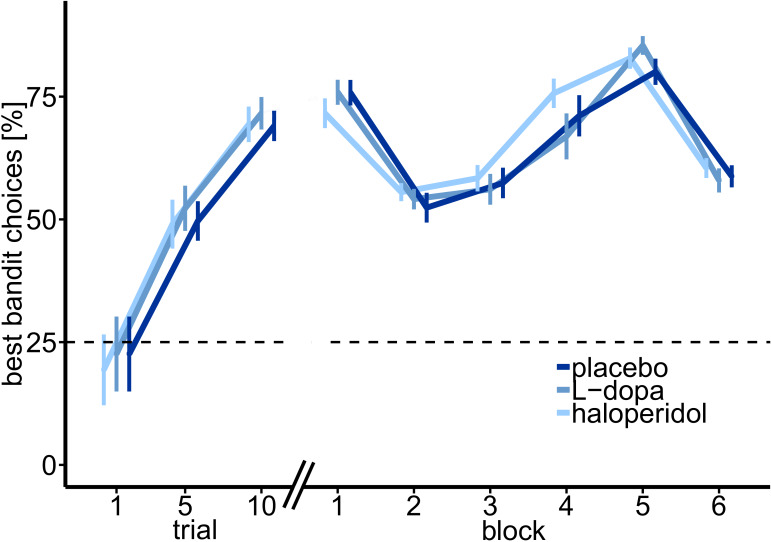
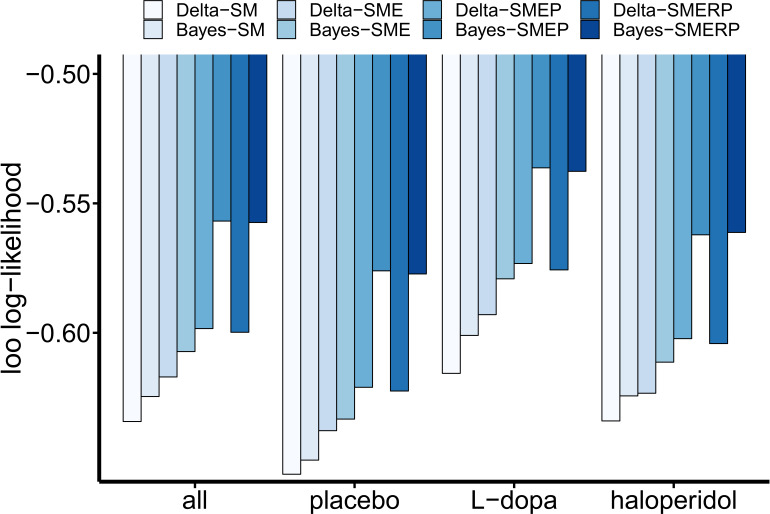
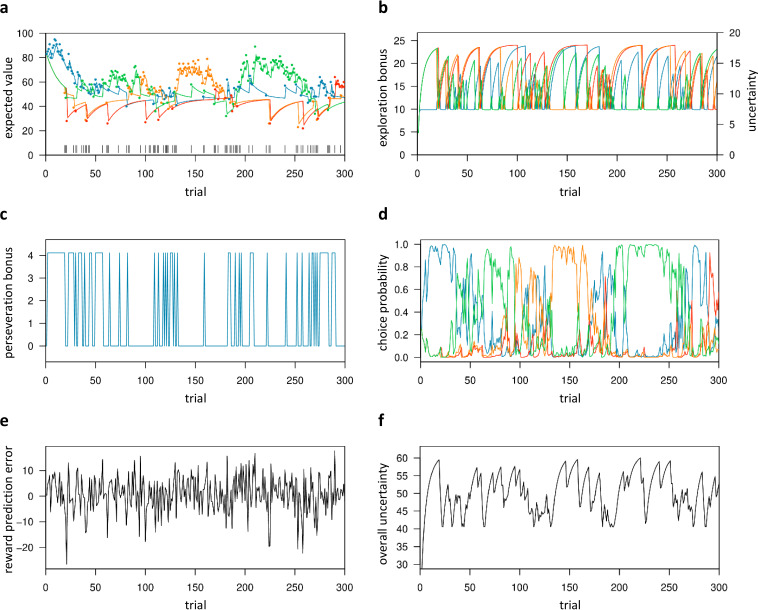
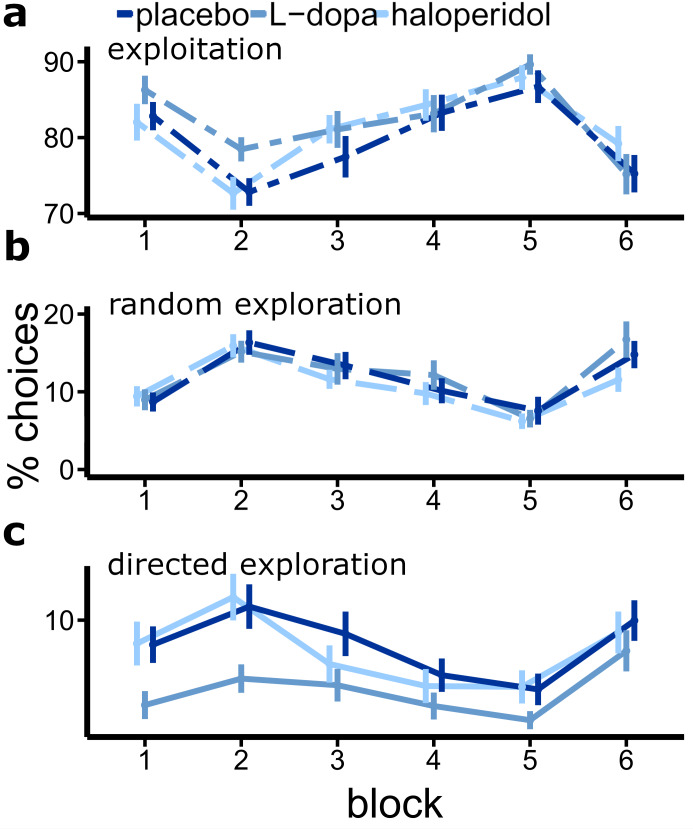
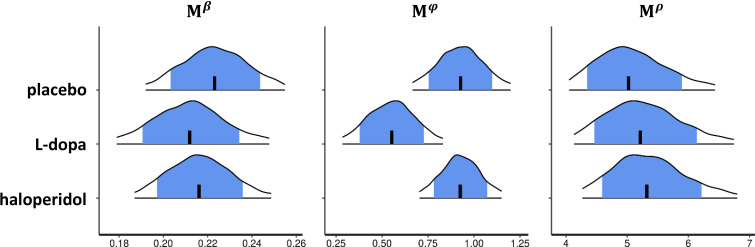
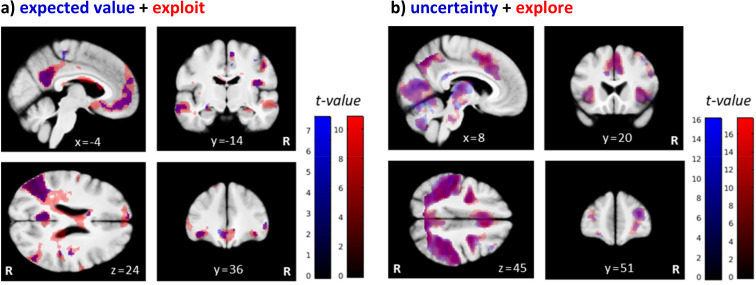
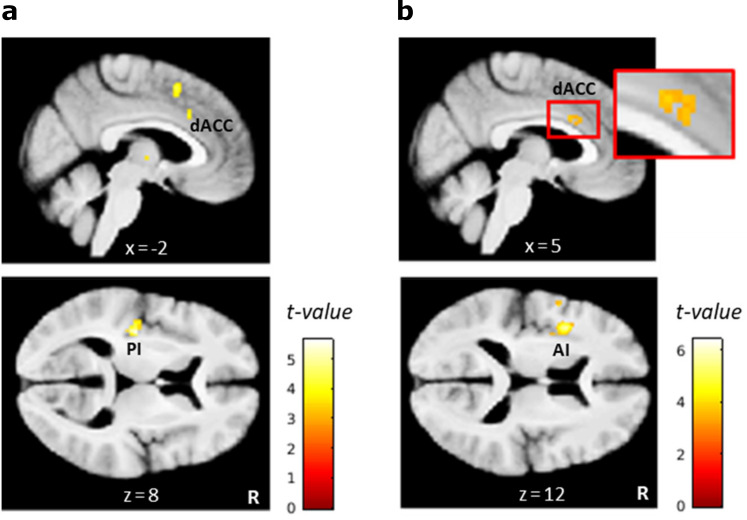
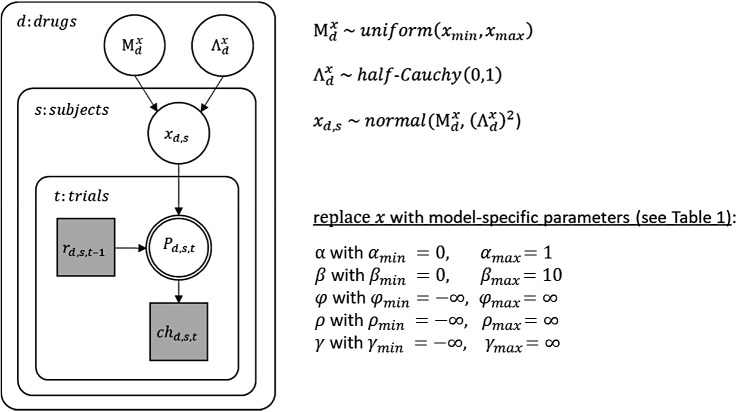
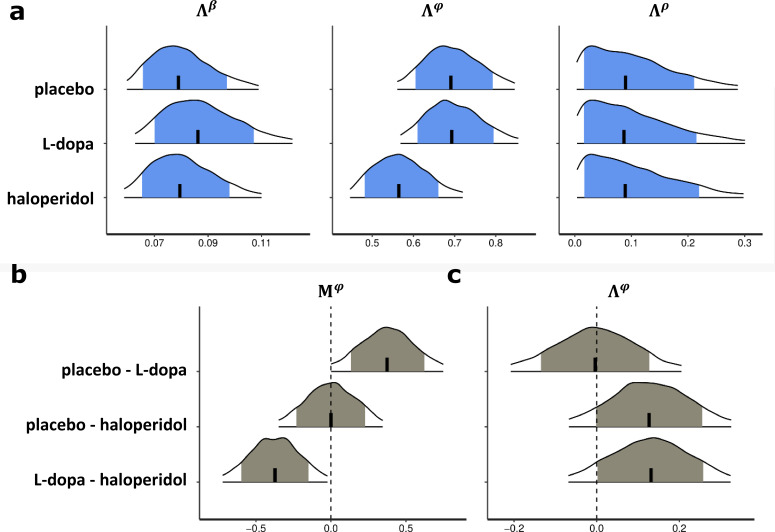
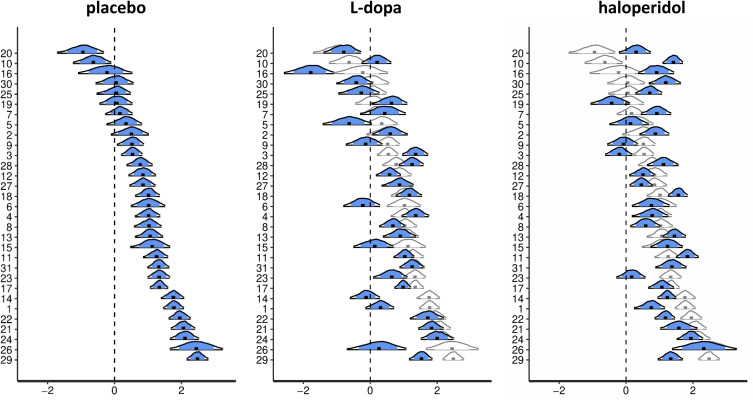
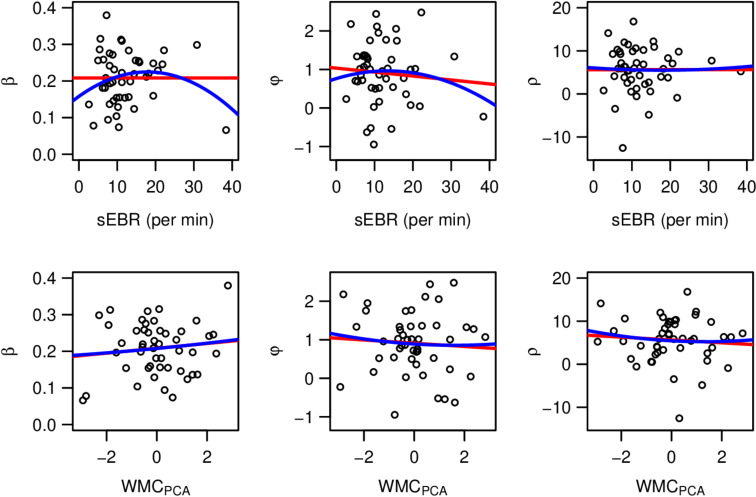
Involvement of dopamine in regulating exploration during decision-making has long been hypothesized, but direct causal evidence in humans is still lacking. Here, we use a combination of computational modeling, pharmacological intervention and functional magnetic resonance imaging to address this issue. Thirty-one healthy male participants performed a restless four-armed bandit task in a within-subjects design under three drug conditions: 150 mg of the dopamine precursor L-dopa, 2 mg of the D2 receptor antagonist haloperidol, and placebo. Choices were best explained by an extension of an established Bayesian learning model accounting for perseveration, directed exploration and random exploration. Modeling revealed attenuated directed exploration under L-dopa, while neural signatures of exploration, exploitation and prediction error were unaffected. Instead, L-dopa attenuated neural representations of overall uncertainty in insula and dorsal anterior cingulate cortex. Our results highlight the computational role of these regions in exploration and suggest that dopamine modulates how this circuit tracks accumulating uncertainty during decision-making.

Keywords: computational modeling; decision-making; dopamine; exploration; human; neuroscience; pharmacological fMRI.


Conflict of interest statement

KC, DM, AW, FG, JP No competing interests declared

Figures

Figure 1.
Figure 1.. Task design of the restless four-armed bandit task (Daw et al., 2006).
(a) Illustration of the timeline within a trial. At trial onset, four colored squares (bandits) are presented. The participant selects one bandit within 1.5 s, which is then highlighted and, after a waiting period of 3 s, the payoff is revealed for 1 s. After that, the screen is cleared and the next trial starts after a fixed trial length of 6 s plus a variable intertrial interval (not shown) with a mean of 2 s. (b) Example of the underlying reward structure. Each colored line shows the payoffs of one bandit (mean payoff plus Gaussian noise) that would be received by choosing that bandit on each trial.
Figure 2.
Figure 2.. Percentage of optimal choices (highest payoff) throughout the task.
Shown are the mean percentage of choosing the best bandit in trials 1–10, and over task blocks of trials 11–50 (block 1) and 51–300 separated in 5 blocks of 50 trials each, over all participants, and for each drug session separately. Participants started with randomly (~25%) choosing one bandit in trial 1 (21.5% ± 7.49%, M ± SE). After five trials participants already chose the most valuable bandit with 49.03 ± 4.98% (M ± SE).
Figure 3.
Figure 3.. Results of the cognitive model comparison.
Leave-one-out (LOO) log-likelihood estimates were calculated over all drug conditions (n = 31 subjects with t = 3*300 trials) and once separately for each drug condition (n = 31 with t = 300). All LOO estimates were divided by the total number of data points in the sample (n*t) for better comparability across the different approaches. Note that the relative order of LOO estimates is invariant to linear transformations. Delta: simple delta learning rule; Bayes: Bayesian learner; SM: softmax (random exploration); E: directed exploration; R: total uncertainty-based random exploration; P: perseveration.
Figure 4.
Figure 4.. Trial-by-trial variables of the best-fitting Bayesian model (Bayes-SMEP).
Trial-by-trial estimates are shown for the placebo data of one representative subject with posterior medians: β=0.29, φ = 1.34, and ρ=4.11 (random exploration, directed exploration, and perseveration). (a) Colored lines depict the expected values (μ^pre) of the four bandits, whereas colored dots denote actual payoffs. Vertical black lines mark trials classified as exploratory (Daw et al., 2006). (b) Exploration bonus (φσ^pre) and uncertainty (σ^pre) for each bandit. (c) Perseveration bonus (Iρ). This bonus is a fixed value added only to the bandit chosen in the previous trial, shown here for one bandit. (d) Choice probability (P). Each colored line represents one bandit. (e) Reward prediction error (δ). (f) The subject’s overall uncertainty (Σσ^pre), that is the summed uncertainty over all four bandits.
Figure 5.
Figure 5.. Drug effects on the percentage of exploitations and explorations (bandit with highest uncertainty is chosen).
Shown are the mean percentage of directed explorations for each drug session over six blocks of 50 trials each (error bars indicate standard error of the mean).
Figure 6.
Figure 6.. Drug effects for the group-level parameter estimates of the best-fitting Bayesian model.
Shown are posterior distributions of the group-level mean (M) of all choice parameters (β, φ, ρ), separately for each drug condition. Each plot shows the median (vertical black line), the 80% central interval (blue (grey) area), and the 95% central interval (black contours); β: random exploration, φ: directed exploration; ρ: perseveration parameter. For drug effects on the standard deviation of the group-level median parameters φ,β and ρ see Appendix 1—figure 1a. See Appendix 1—figure 1b and c for pairwise drug-related differences of the group-level mean (M) and (c) standard deviation (Λ) of φ.
Figure 7.
Figure 7.. Brain regions differentially activated by exploratory and exploitative choices.
Shown are overlays of statistical parametric maps (SPMs) for the contrast (a) the parametric regressor expected value (μ^pre) of the chosen bandit (in blue) and the binary trial classification related contrast exploit > explore (‘exploit’ in red), and for (b) the parametric regressor uncertainty (σ^pre) (in blue) and the contrast explore > exploit (‘explore’ in red), over all drug conditions. For visualization purposes: thresholded at p<0.001, uncorrected. R: right.
Figure 8.
Figure 8.. L-dopa effects on neural coding of overall uncertainty.
(a) Regions in which activity correlated positively with the overall uncertainty in the placebo condition included the dorsal anterior cingulate cortex (dACC) and left posterior insula (PI). (b) Regions in which the correlation with overall uncertainty was reduced under L-dopa compared to placebo included the dACC and left anterior insula (AI). Thresholded at p<0.001, uncorrected. R: right.
Figure 9.
Figure 9.. Graphical description of the hierarchical Bayesian modeling scheme.
In this graphical scheme, nodes represent variables of interest (squares: discrete variables; circles: continuous variables) and arrows indicate dependencies between these variables. Shaded nodes represent observed variables, here rewards (r) and choices (ch) for each trial (t), subject (s), and drug condition (d). For each subject and drug condition, the observed rewards until trial t-1 determine (deterministically) choice probabilities (P) on trial t, which in turn determine (stochastically) the choice on that trial. The exact dependencies between previous rewards and choice probabilities are specified by the different cognitive models and their model parameters (x). Note that the double-bordered node indicates that the choice probability is fully determined by its parent nodes, that is the reward history and the model parameters. As the model parameters differ between all applied cognitive models, they are indicated here by an x as a placeholder for one or more model parameter(s). Still, the general modeling scheme was the same for all models: Model parameters were estimated for each subject and drug condition and were assumed to be drawn from a group-level normal distribution with mean Mx and standard deviation Λx for any parameter x. Note that group-level parameters were estimated separately for each drug condition. Each group-level mean (Mx) was assigned a non-informative (uniform) prior between the limits xmin and xmax as listed above. Each group-level standard deviation (Λx) was assigned a half Cauchy distributed prior with location parameter 0 and scale 1. Subject-level parameters included α,β,φ, ρ, and γ depending on the cognitive model (see Table 1).
Appendix 1—figure 1.
Appendix 1—figure 1.. Group-level parameter estimates of the winning model .
Shown are the posterior distributions of the (a) group-level standard deviation (Λ) for all choice parameters (β,φ,ρ) of the winning model, separately for each drug condition, and (b) of the pairwise drug-related differences of the group-level mean (M) and (c) standard deviation (Λ) of . For each posterior distribution, the plot shows the median (vertical black line), the 80% central interval (blue/grey area), and the 95% central interval (black contours). β: softmax parameter; φ: exploration bonus parameter; ρ: perseveration bonus parameter.
Appendix 1—figure 2.
Appendix 1—figure 2.. Drug effects for the subject-level parameter estimates of the directed exploration parameter φ.
Shown are posterior distributions of the subject-level parameter φ from the best-fitting Bayesian model, separately for each drug condition. Each plot shows the median (black dot), the 80% central interval (blue area), and the 95% central interval (black contours). For the L-dopa and haloperidol conditions, posterior distributions (in blue) are overlaid on the posterior distributions of the placebo condition (in white) for better comparison.
Appendix 1—figure 3.
Appendix 1—figure 3.. Test for an inverted-U relationship between DA baseline proxy measures (spontaneous eye blink rate (sEBR) & working memory capacity (WMCPCA)) and the posterior medians of the three choice parameters (β,φ,ρ) of the winning (Bayes-SMEP) model.
Model parameters: β: softmax parameter; φ: exploration bonus parameter; ρ: perseveration bonus parameter.
Appendix 1—figure 4.
Appendix 1—figure 4.. Test for an inverted-U relationship between choice behavior and DA baseline.
Choice behavior was assessed by four model-free choice variables (payout, %bestbandit, meanrank, %switches). DA baseline function was assessed by the two DA proxies spontaneous eyeblink rate (sEBR) and working memory capacity (WMC). For the latter, the first principal component across three different WMC tasks was used, denoted by WMCPCA. Each plot shows two regression lines that were fitted to the data, one for the “linear model” (red line) and one for the “quadratic model” (blue line). Note that data from a pilot study and the placebo condition of the main study were combined for this analysis to increase the sample size to n=47. β: softmax parameter; φ: exploration bonus parameter; ρ: perseveration bonus parameter.
Appendix 1—figure 5.
Appendix 1—figure 5.. Brain regions differentially activated by exploratory and exploitative choices.
Shown are statistical parametric maps (SPMs) for (a) the contrast explore > exploit and (b) the contrast exploit > explore over all drug conditions. AG: angular gyrus; AI: anterior insula; Cb: cerebellum; dACC: dorsal anterior cingulate cortex; FPC: frontopolar cortex; HC: hippocampus; IPS: intraparietal sulcus; vmPFC: ventromedial prefrontal cortex; OFC: orbitofrontal cortex; PCC: posterior cingulate cortex; SMA: supplementary motor area; T: thalamus. For visualization purposes thresholded at p<0.001, uncorrected. R: right.
Appendix 1—figure 6.
Appendix 1—figure 6.. Brain activation patterns for different types of explorations .
Shown are pairwise overlays of the statistical parametric maps for the contrasts explore > exploit (‘overall’ in green), directed > exploit (‘directed’ in red), and random > exploit (‘random’ in blue) over all drug conditions. While the first contrast is based on a binary choice classification according to which all choices not following the highest expected value are explorations, the other two contrast are based on a trinary choice classification, which further subdivides explorations into choices following the highest exploration bonus (directed) and choices not following the highest exploration bonus (random). All activation maps thresholded at p<0.05, uncorrected for display purposes. R: right.
Appendix 1—figure 7.
Appendix 1—figure 7.. Striatal coding of the model-based prediction error (PE).
Activity in the bilateral ventral striatum correlated positively with the PE signal. For visualization purposes thresholded at p<0.001, uncorrected. R: right.
Author response image 1.
Author response image 1.. Shown are leave-one-out (LOO) log-likelihood estimates calculated for our winning model (BAYES-SMEP), the model with an additional term capturing uncertainty-based random exploration (BAYES-SMERP), and the respective alternative model formulations (‘shift’) over all drug conditions (n=31 subjects with t=3*300 trials) and once separately for each drug condition (n=31 with t=300).
All LOO estimates were divided by the total number of data points in the sample (n*t) for better comparability across the different approaches. Bayes: Bayesian learner; SM: softmax (random exploration); E: directed exploration; R: total uncertainty-based random exploration; P: perseveration.

References

    1. Addicott MA, Pearson JM, Froeliger B, Platt ML, McClernon FJ. Smoking automaticity and tolerance moderate brain activation during explore-exploit behavior. Psychiatry Research: Neuroimaging. 2014;224:254–261. doi: 10.1016/j.pscychresns.2014.10.014. - DOI - PMC - PubMed
    1. Addicott MA, Pearson JM, Sweitzer MM, Barack DL, Platt ML. A primer on foraging and the explore/Exploit Trade-Off for psychiatry research. Neuropsychopharmacology. 2017;42:1931–1939. doi: 10.1038/npp.2017.108. - DOI - PMC - PubMed
    1. Almey A, Milner TA, Brake WG. Estrogen receptors in the central nervous system and their implication for dopamine-dependent cognition in females. Hormones and Behavior. 2015;74:125–138. doi: 10.1016/j.yhbeh.2015.06.010. - DOI - PMC - PubMed
    1. Anderson BDO, Moore JB. Optimal Filtering. Prentice Hall Information and System Sciences Series. Prentice-Hall; 1979.
    1. Andrews-Hanna JR, Smallwood J, Spreng RN. The default network and self-generated thought: component processes, dynamic control, and clinical relevance. Annals of the New York Academy of Sciences. 2014;1316:29–52. doi: 10.1111/nyas.12360. - DOI - PMC - PubMed

Publication types