. 2020 Sep 1;130(9):4740-4758.
doi: 10.1172/JCI135922.

BET bromodomain inhibition attenuates cardiac phenotype in myocyte-specific lamin A/C-deficient mice

Affiliations

BET bromodomain inhibition attenuates cardiac phenotype in myocyte-specific lamin A/C-deficient mice

Gaelle Auguste et al. J Clin Invest. .

Abstract

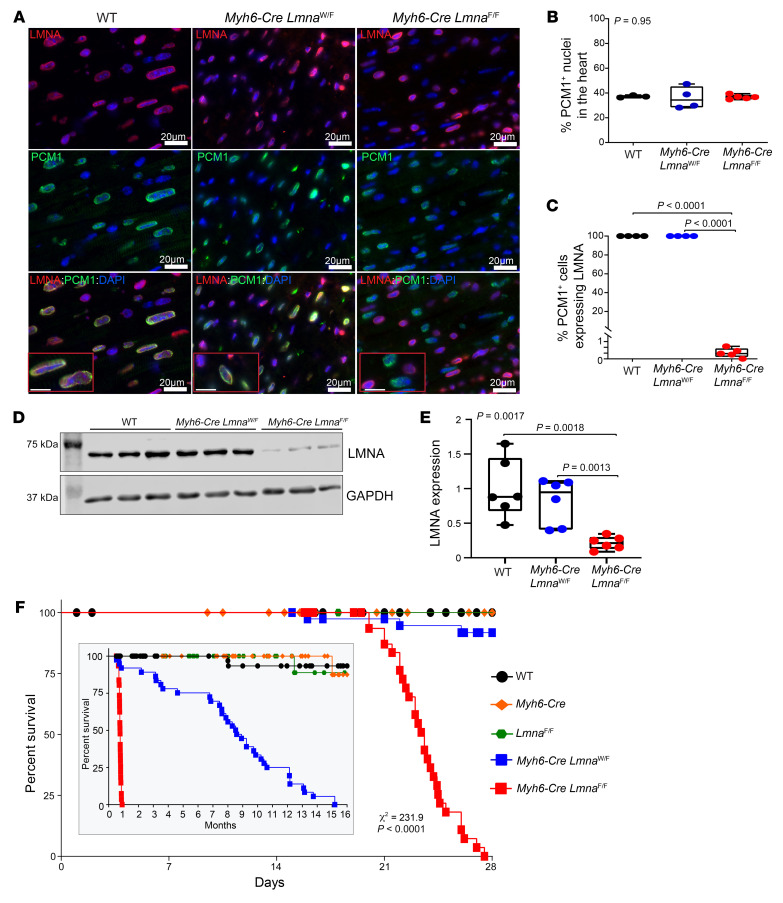
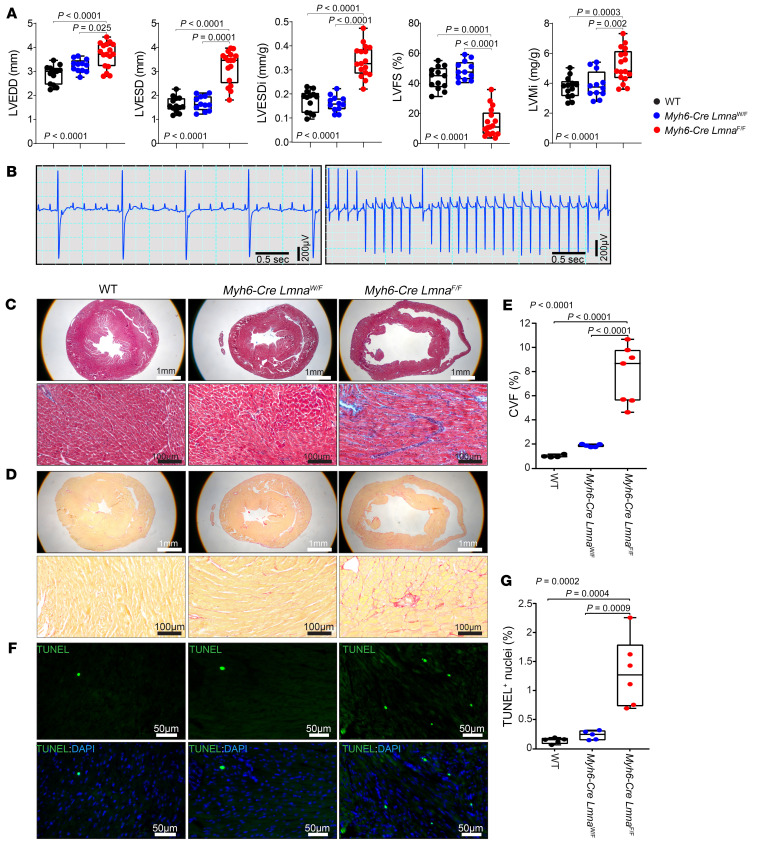
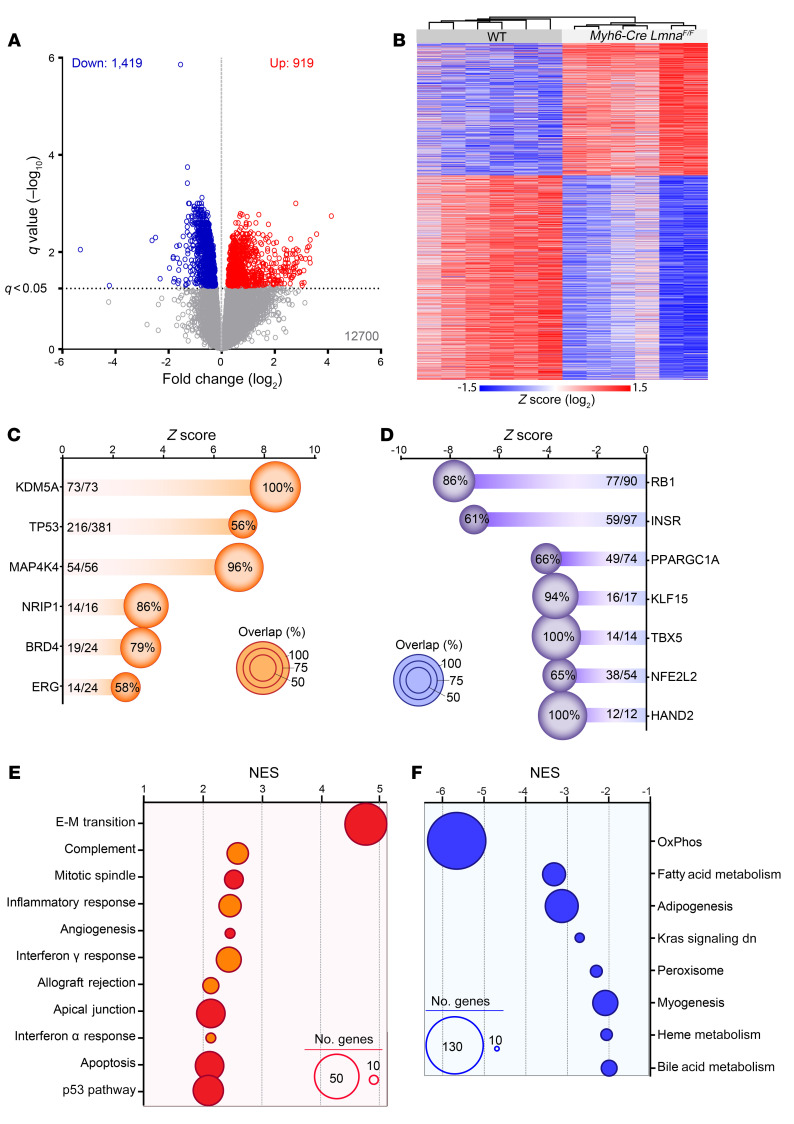
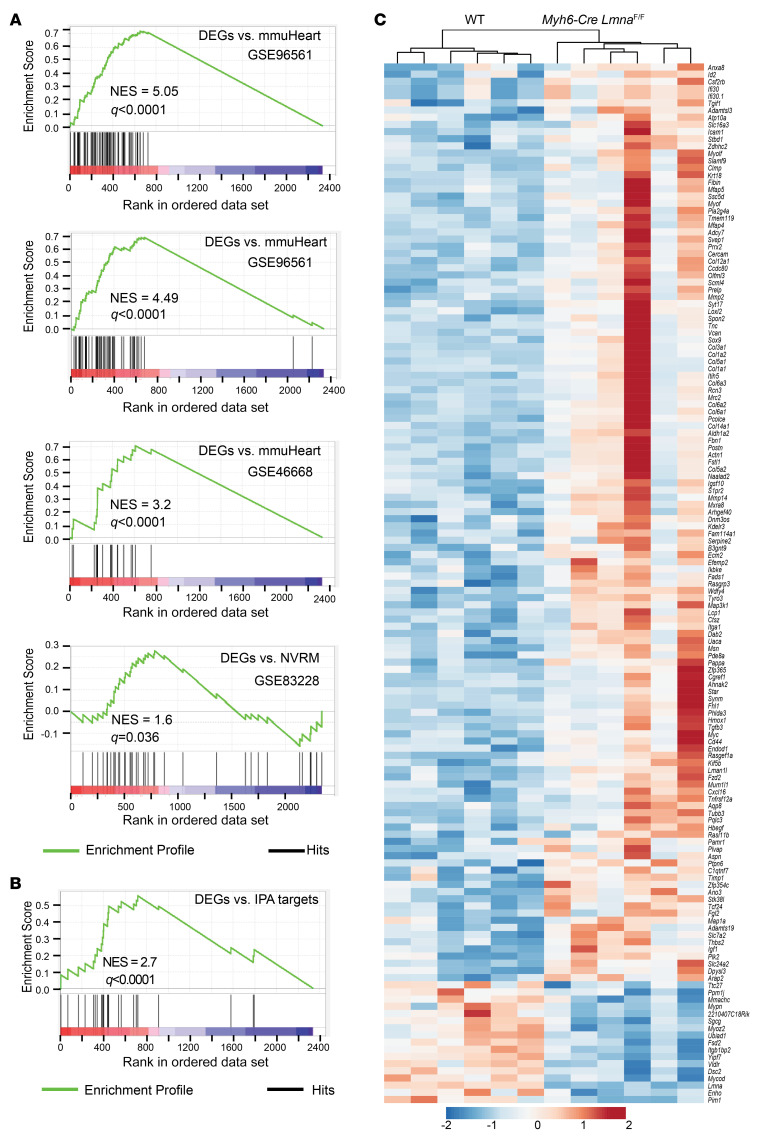
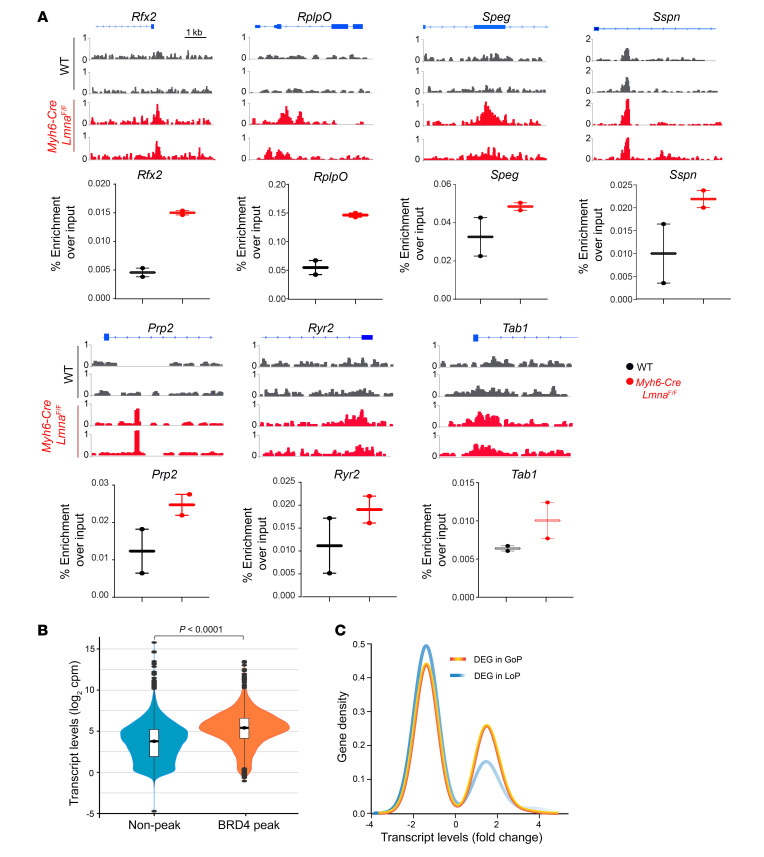
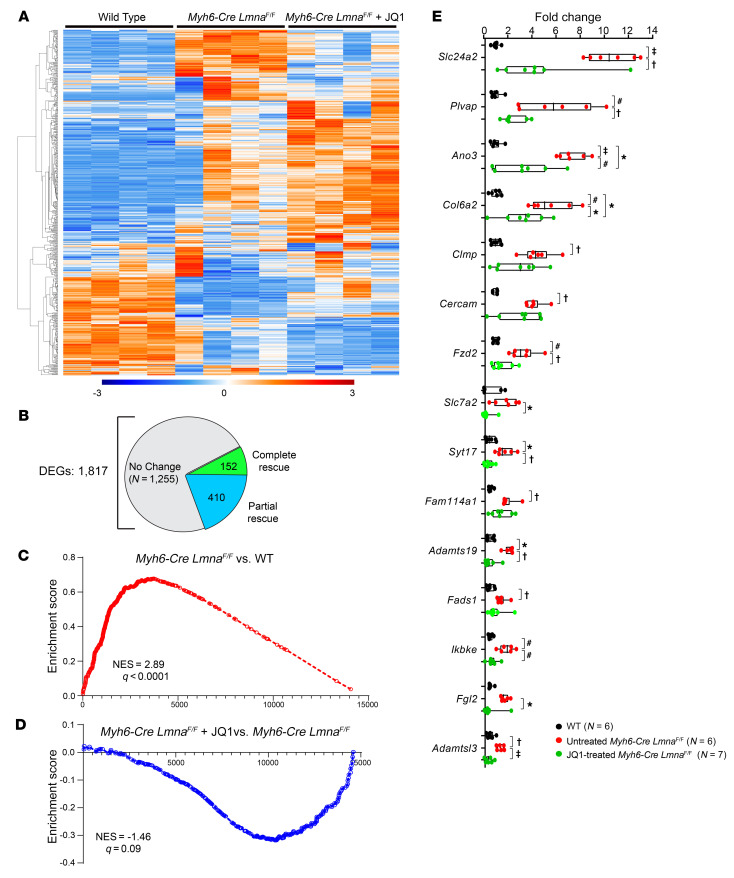
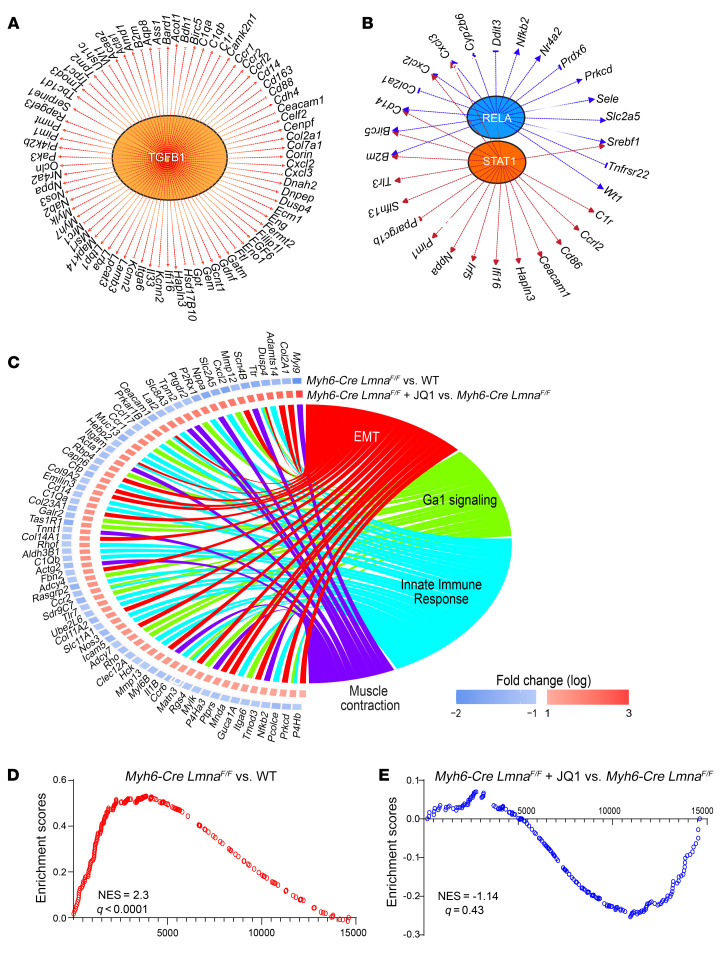
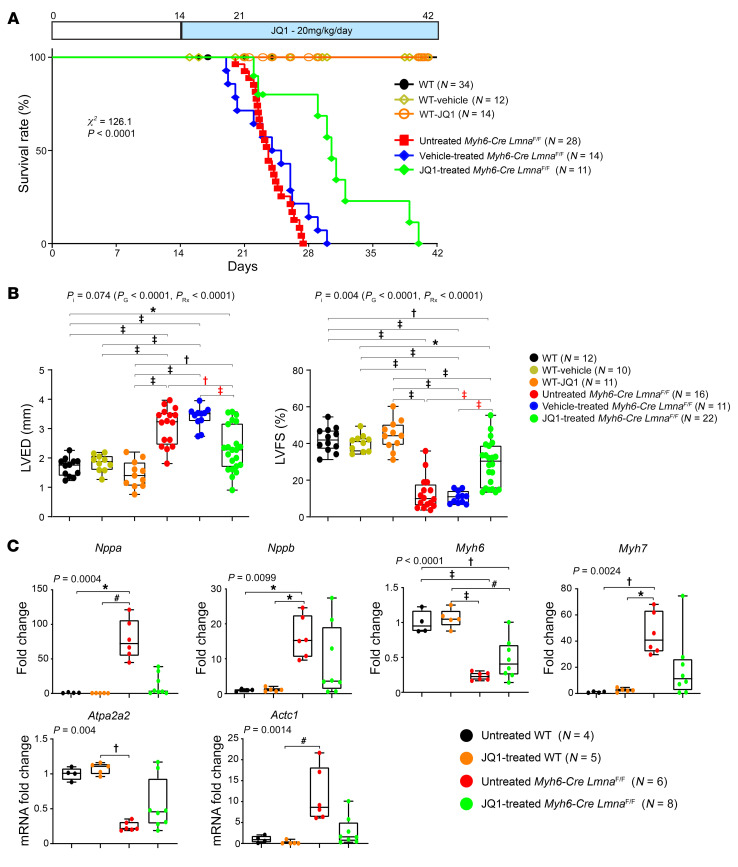
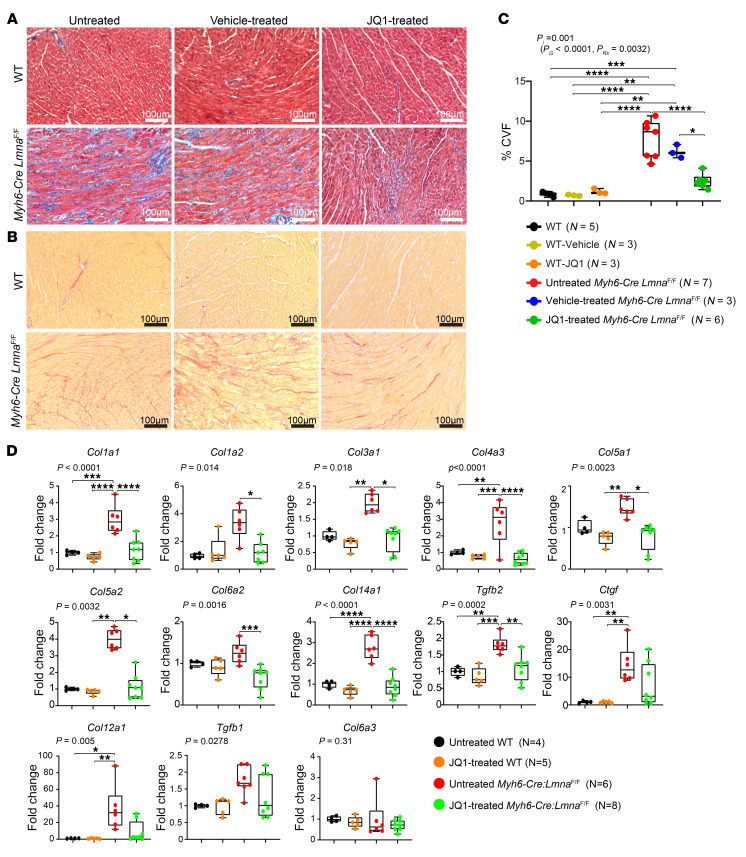
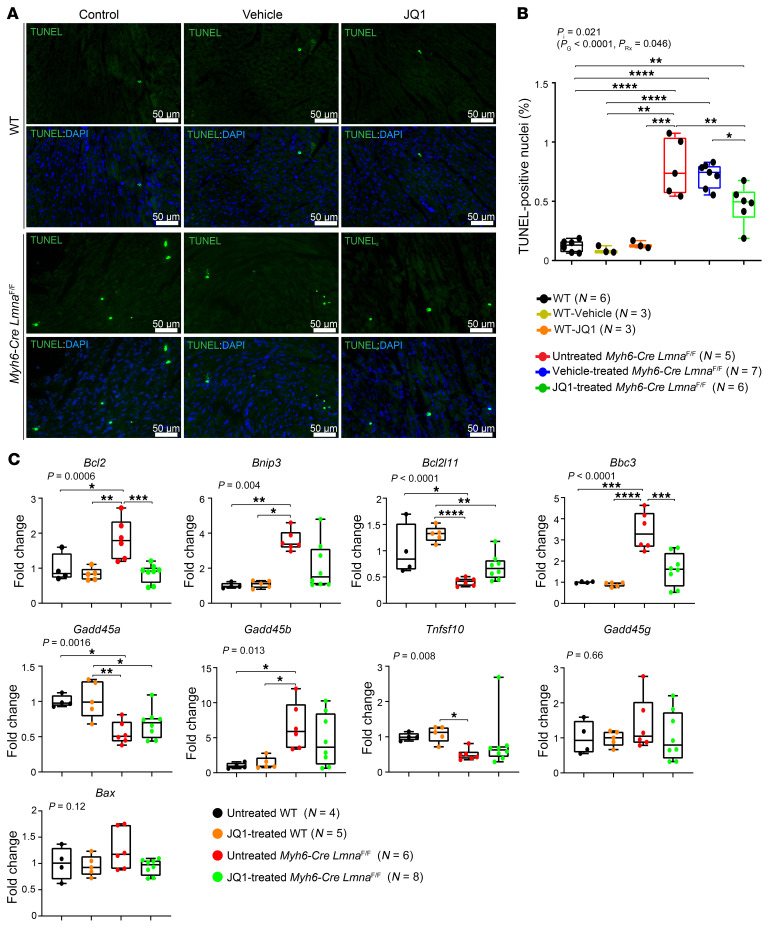
Mutation in the LMNA gene, encoding lamin A/C, causes a diverse group of diseases called laminopathies. Cardiac involvement is the major cause of death and manifests as dilated cardiomyopathy, heart failure, arrhythmias, and sudden death. There is no specific therapy for LMNA-associated cardiomyopathy. We report that deletion of Lmna in cardiomyocytes in mice leads to severe cardiac dysfunction, conduction defect, ventricular arrhythmias, fibrosis, apoptosis, and premature death within 4 weeks. The phenotype is similar to LMNA-associated cardiomyopathy in humans. RNA sequencing, performed before the onset of cardiac dysfunction, led to identification of 2338 differentially expressed genes (DEGs) in Lmna-deleted cardiomyocytes. DEGs predicted activation of bromodomain-containing protein 4 (BRD4), a regulator of chromatin-associated proteins and transcription factors, which was confirmed by complementary approaches, including chromatin immunoprecipitation sequencing. Daily injection of JQ1, a specific BET bromodomain inhibitor, partially reversed the DEGs, including those encoding secretome; improved cardiac function; abrogated cardiac arrhythmias, fibrosis, and apoptosis; and prolonged the median survival time 2-fold in the myocyte-specific Lmna-deleted mice. The findings highlight the important role of LMNA in cardiomyocytes and identify BET bromodomain inhibition as a potential therapeutic target in LMNA-associated cardiomyopathy, for which there is no specific effective therapy.

Keywords: Cardiology; Cardiovascular disease; Fibrosis; Heart failure.


Conflict of interest statement

Conflict of interest: The authors have declared that no conflict of interest exists.

Figures

Figure 1
Figure 1. Conditional deletion of Lmna gene in cardiomyocytes in mice.
(A) Representative immunofluorescence staining of thin myocardial section from 3-week-old WT, Myh6-Cre LmnaW/F, and Myh6-Cre LmnaF/F mice showing localization of LMNA (red) at the nuclear membrane in PCM1-labeled (green) cardiomyocytes. Nuclei were counterstained with DAPI (blue). Scale bars: 20 μm, 10 μm (insets). (B) Quantitative data of PCM1-labeled nuclei in WT (n = 3), Myh6-Cre LmnaW/F (n = 4), and Myh6-Cre LmnaF/F (n = 5, P = 0.95). (C) Quantitative data of PCM1-labeled nuclei showing expression of LMNA in WT, Myh6-Cre LmnaW/F, and Myh6-Cre LmnaF/F (n = 5, P < 0.0001). (D) Western blots showing expression of LMNA in isolated cardiomyocyte cell lysates in 2-week-old WT, Myh6-Cre LmnaW/F, and Myh6-Cre LmnaF/F and the corresponding GAPDH as a loading control. (E) Quantitative data on LMNA expression levels in cardiomyocytes in WT (n = 6), Myh6-Cre LmnaW/F (n = 6), and Myh6-Cre LmnaF/F mice (n = 6, P = 0.0017). (F) Kaplan-Meier curve showing the survival of WT (n = 52), Myh6-Cre (n = 38), LmnaF/F (n = 50), Myh6-Cre LmnaW/F (n = 40), and Myh6-Cre LmnaF/F (n = 37) mice during the first 4 weeks (χ2 = 231, P < 0.0001) and 16 months (inset; χ2 = 344, P < 0.0001) after birth. P values shown in B, C, and E were calculated by 1-way ANOVA followed by Tukey’s post hoc pairwise comparison test.
Figure 2
Figure 2. Cardiac phenotype in 3-week-old WT, Myh6-Cre LmnaW/F, and Myh6-Cre LmnaF/F mice.
(A) Selected echocardiographic parameters showing left ventricular end-diastolic diameter (LVEDD), left ventricular end-systolic diameter (LVESD), left ventricular end-systolic diameter indexed to body weight (LVESDi), left ventricular fractional shortening (LVFS), and left ventricular mass indexed to body weight (LVMi) in 3-week-old WT (n = 13), Myh6-Cre LmnaW/F (n = 12), and Myh6-Cre LmnaF/F (n = 17) mice. P values shown were obtained using ordinary 1-way ANOVA and Bonferroni’s post hoc test for comparisons of the LVEDD, LVESDi, and LVMi, and Kruskal-Wallis and Dunn’s post hoc test for comparisons for LVESD and LVFS. (B) Selected representative surface ECG recordings showing third-degree atrioventricular block (no association between P and QRS waves) and ventricular tachycardia observed in the Myh6-Cre LmnaW/F (n = 19) and Myh6-Cre LmnaF/F mice (n = 19). (C and D) Masson’s trichrome–stained (top panel) and Picrosirius red–stained (bottom panel) representative myocardial sections in 3-week-old WT, Myh6-Cre LmnaW/F, and Myh6-Cre LmnaF/F mice. (E) Corresponding quantitative data on percentage collagen volume fraction (CVF) in myocardial sections in the WT (n = 4), Myh6-Cre LmnaW/F (n = 5), and Myh6-Cre LmnaF/F (n = 7) mice. (F) TUNEL-stained thin myocardial sections in 3-week-old WT, Myh6-Cre LmnaW/F, and Myh6-Cre LmnaF/F mice. TUNEL-positive cells are shown in green and nuclei, counterstained with DAPI, in blue. (G) Quantitative data showing percentage of TUNEL-positive nuclei in the WT (n = 5), Myh6-Cre LmnaW/F (n = 5), and Myh6-Cre LmnaF/F (n = 6) mice. P values shown in E and G were calculated using ordinary 1-way ANOVA and Tukey’s post hoc test.
Figure 3
Figure 3. Differentially expressed genes in 2-week-old WT and Myh6-Cre LmnaF/F mouse cardiomyocytes.
(A) Volcano plot depicting differentially expressed genes (DEGs) showing downregulation of 1419 and upregulation of 919 genes in Myh6-Cre LmnaF/F (n = 6) compared with WT mouse cardiomyocytes (n = 6). (B) Heatmap and unsupervised hierarchical clustering of the DEGs in WT and Myh6-Cre LmnaF/F mouse cardiomyocytes, showing clustering according to the genotype. (C and D) Ingenuity Pathway Analysis (IPA) for inferred activated (C) and suppressed (D) upstream regulators of the DEGs in Myh6-Cre LmnaF/F mouse cardiomyocytes. Z score and percentage of overlap of the DEGs with the IPA database are depicted on the graphs. The size of each circle is proportional to the percentage of genes considered as downstream targets of each regulator in the RNA-Seq data set. (E and F) Top significantly enriched hallmark pathways activated (E) or inhibited (F), inferred using Gene Set Enrichment Analysis (GSEA). Normalized enrichment score (NES) and number of genes involved (size of the circle) are depicted for each pathway.
Figure 4
Figure 4. Evidence of BET bromodomain activation in Myh6-Cre LmnaF/F mouse cardiomyocytes.
(A) GSEA plot of DEGs in Myh6-Cre LmnaF/F mouse cardiomyocytes against predicted BRD target genes gathered from whole mouse heart after transaortic constriction or myocardial infarction (GSE96561, GSE96561, and GSE48110) and in rat neonatal ventricular cardiomyocytes (NVRM; GSE83228). (B) GSEA of DEGs in Myh6-Cre LmnaF/F mouse cardiomyocytes against predicted BRD target genes obtained from IPA. (C) Heatmap and unsupervised hierarchical clustering of 145 DEGs in Myh6-Cre LmnaF/F mouse cardiomyocytes obtained after overlapping with the GSEA data shown in A and B.
Figure 5
Figure 5. BRD4 activation in Myh6-Cre LmnaF/F mouse cardiomyocytes.
(A) ChIP-qPCR in WT and Myh6-Cre LmnaF/F mouse cardiomyocyte chromatin extracts (n = 2 for each genotype) and IGV tracks from ChIP-Seq showing BRD4 enrichment in the corresponding regions assessed. (B) Violin plots depicting transcript levels of all genes at nonpeak and BRD4 peak regions in Myh6-Cre LmnaF/F mouse cardiomyocytes (P < 0.0001 by Kruskal-Wallis). (C) Transcript levels of DEGs plotted against gene density at the GoP and LoP genomic regions, showing a higher density of genes with increased transcript levels in the GoP regions.
Figure 6
Figure 6. Effect of BET bromodomain inhibition on the transcriptome of Myh6-Cre LmnaF/F mouse cardiomyocytes.
(A) Heatmap of the DEGs in WT, Myh6-Cre LmnaF/F, and JQ1-treated Myh6-Cre LmnaF/F mouse cardiomyocytes (n = 4 for each). (B) Pie chart depicting the number of genes that were rescued and partially rescued upon JQ1 treatment in Myh6-Cre LmnaF/F mouse cardiomyocytes from the differentially expressed genes between WT and Myh6-Cre LmnaF/F myocytes. (C and D) GSEA plots of the BRD4 target genes showing induction in Myh6-Cre LmnaF/F compared with WT cardiomyocytes (NES = 2.89, q < 0.0001) (C), and partial suppression in JQ1-treated Myh6-Cre LmnaF/F compared with Myh6-Cre LmnaF/F (NES = –1.46, q = 0.09) (D). (E) RT-qPCR data showing transcript levels of selected BRD4 target genes in WT (n = 6), untreated (n = 6), and JQ1-treated Myh6-Cre LmnaF/F mouse cardiomyocytes (n = 7). P values were obtained with ordinary 1-way ANOVA or Kruskal-Wallis; *P < 0.05, P < 0.01, #P < 0.001, P < 0.0001.
Figure 7
Figure 7. Upstream regulators and biological pathways altered after BET bromodomain inhibition in Myh6-Cre LmnaF/F mouse cardiomyocytes.
(A and B) Major putative inferred upstream regulators and their targets from IPA overlap analysis of the completely and partially rescued genes upon JQ1 treatment in Myh6-Cre LmnaF/F. (C) Circos plot showing the top significantly enriched hallmark pathways inferred from the completely and partially rescued genes upon JQ1 treatment in Myh6-Cre LmnaF/F using GSEA, with the log2 fold change depicting the relative expression of the genes involved in these pathways: (I) Myh6-Cre LmnaF/F compared with WT cardiomyocytes; (II) JQ1-treated Myh6-Cre LmnaF/F compared with Myh6-Cre LmnaF/F. (D and E) GSEA plots of EMT showing induction in Myh6-Cre LmnaF/F compared with WT cardiomyocytes (NES = 2.3, q < 0.0001) (D), and partial suppression in JQ1-treated Myh6-Cre LmnaF/F compared with Myh6-Cre LmnaF/F (NES = –1.14, q = 0.43) (E).
Figure 8
Figure 8. Phenotypic effects of BET bromodomain protein inhibition in Myh6-Cre LmnaF/F mice.
(A) Kaplan-Meier survival curves in the untreated (black line; n = 34), vehicle-treated (yellow line; n = 12), and JQ1-treated WT (orange line; n = 14), as well as untreated (red line; n = 28), vehicle-treated (blue line; n = 14), and JQ1-treated Myh6-Cre LmnaF/F (green line; n = 11), mice. (B) Selected echocardiographic parameters after 1 week of treatment in 3-week-old untreated (black dots; n = 12), vehicle-treated (yellow dots; n = 10), and JQ1-treated WT (orange dots; n = 11), as well as untreated (red dots; n = 16), vehicle-treated (blue dots; n = 11), and JQ1-treated (green dots; n = 22) Myh6-Cre LmnaF/F, mice. P values shown were obtained using 2-way ANOVA and Bonferroni’s post hoc test for comparisons; *P < 0.05, P < 0.01, #P < 0.001, P < 0.0001. PI, P value for interaction; PG, P value for genotype, PRx, P value for treatment effect. (C) Expression levels of known markers of cardiac dysfunction, quantified by RT-qPCR, after 1 week of treatment in 3-week-old untreated (black dots; n = 4) and JQ1-treated WT (orange dots; n = 5) mice, as well as untreated (red dots; n = 6) and JQ1-treated (green dots; n = 8) Myh6-Cre LmnaF/F mice. Because untreated and vehicle-treated mice were indistinguishable, only untreated and JQ1-treated mice were analyzed. P values shown were obtained with ordinary 1-way ANOVA or Kruskal-Wallis; *P < 0.05, P < 0.01, #P < 0.001, P < 0.0001.
Figure 9
Figure 9. Effect of BET bromodomain protein inhibition on myocardial fibrosis in the Myh6-Cre LmnaF/F mice.
(A and B) Representative Masson’s trichrome–stained (top panels) and Picrosirius red–stained (bottom panels) myocardial sections after 1 week of treatment in 3-week-old untreated, vehicle, and JQ1-treated WT and Myh6-Cre LmnaF/F mice. (C) Corresponding quantitative data showing the percentage of CVF in myocardial sections in untreated (black dots; n = 5), vehicle-treated (yellow dots; n = 3), and JQ1-treated WT (orange dots; n = 3), as well as untreated (red dots; n = 7), vehicle-treated (blue dots; n = 3), and JQ1-treated (green dots; n = 6) Myh6-Cre LmnaF/F, mice. P values were calculated using 2-way ANOVA and Tukey’s post hoc test for comparisons; *P < 0.05, **P < 0.01, ***P < 0.001, ****P < 0.0001. (D) Transcript levels of selected BRD4 target genes involved in fibrosis in the heart as quantified by RT-qPCR in untreated (black dots; n = 4) and JQ1-treated (orange dots; n = 5) WT mice, as well as untreated (red dots; n = 6) and JQ1-treated (green; n = 8) Myh6-Cre LmnaF/F mice. P values shown were obtained with ordinary 1-way ANOVA or Kruskal-Wallis; *P < 0.05, **P < 0.01, ***P < 0.001, ****P < 0.0001.
Figure 10
Figure 10. Effect of BET bromodomain protein inhibition on myocardial apoptosis in the Myh6-Cre LmnaF/F mice.
(A) Representative TUNEL-stained thin myocardial sections in 3-week-old untreated, vehicle-treated, and JQ1-treated WT mice along with untreated, vehicle-treated, and JQ1-treated Myh6-Cre LmnaF/F mouse hearts. Nuclei were counterstained with DAPI. (B) Corresponding quantitative data showing percentage of TUNEL-labeled nuclei in myocardial sections in untreated (black dots; n = 6), vehicle-treated (yellow dots; n = 3), and JQ1-treated (orange dots; n = 3) WT and untreated (red dots; n = 5), vehicle-treated (blue dots; n = 7), and JQ1-treated (green dots; n = 6) Myh6-Cre LmnaF/F mouse hearts. P values were calculated using 2-way ANOVA and Tukey’s post hoc test for comparisons; *P < 0.05, **P < 0.01, ***P < 0.001, ****P < 0.0001. (C) Transcript levels of selected BRD4 target genes involved in apoptosis, as quantified by RT-qPCR, are depicted in 3-week-old untreated (black dots; n = 4) and JQ1-treated (orange dots; n = 5) WT mice, and in untreated (red dots; n = 6) and JQ1-treated (green dots; n = 8) Myh6-Cre LmnaF/F mouse hearts. P values shown were obtained with ordinary 1-way ANOVA or Kruskal-Wallis; *P < 0.05, **P < 0.01, ***P < 0.001, ****P < 0.0001.

Comment in

References

    1. Benjamin EJ, et al. Heart disease and stroke statistics — 2019 update: a report from the American Heart Association. Circulation. 2019;139(10):e56–e528. - PubMed
    1. Savarese G, Lund LH. Global public health burden of heart failure. Card Fail Rev. 2017;3(1):7–11. doi: 10.15420/cfr.2016:25:2. - DOI - PMC - PubMed
    1. Ambrosy AP, et al. The global health and economic burden of hospitalizations for heart failure: lessons learned from hospitalized heart failure registries. J Am Coll Cardiol. 2014;63(12):1123–1133. doi: 10.1016/j.jacc.2013.11.053. - DOI - PubMed
    1. McNally EM, Mestroni L. Dilated cardiomyopathy: genetic determinants and mechanisms. Circ Res. 2017;121(7):731–748. doi: 10.1161/CIRCRESAHA.116.309396. - DOI - PMC - PubMed
    1. Metra M, et al. Advanced chronic heart failure: a position statement from the Study Group on Advanced Heart Failure of the Heart Failure Association of the European Society of Cardiology. Eur J Heart Fail. 2007;9(6–7):684–694. - PubMed

Publication types

MeSH terms