. 2020 Jun 9;4(11):2392-2403.
doi: 10.1182/bloodadvances.2019001075.

Multiple mutations at exon 2 of RHOA detected in plasma from patients with peripheral T-cell lymphoma

Affiliations

Multiple mutations at exon 2 of RHOA detected in plasma from patients with peripheral T-cell lymphoma

Barbara Ottolini et al. Blood Adv. .

Abstract

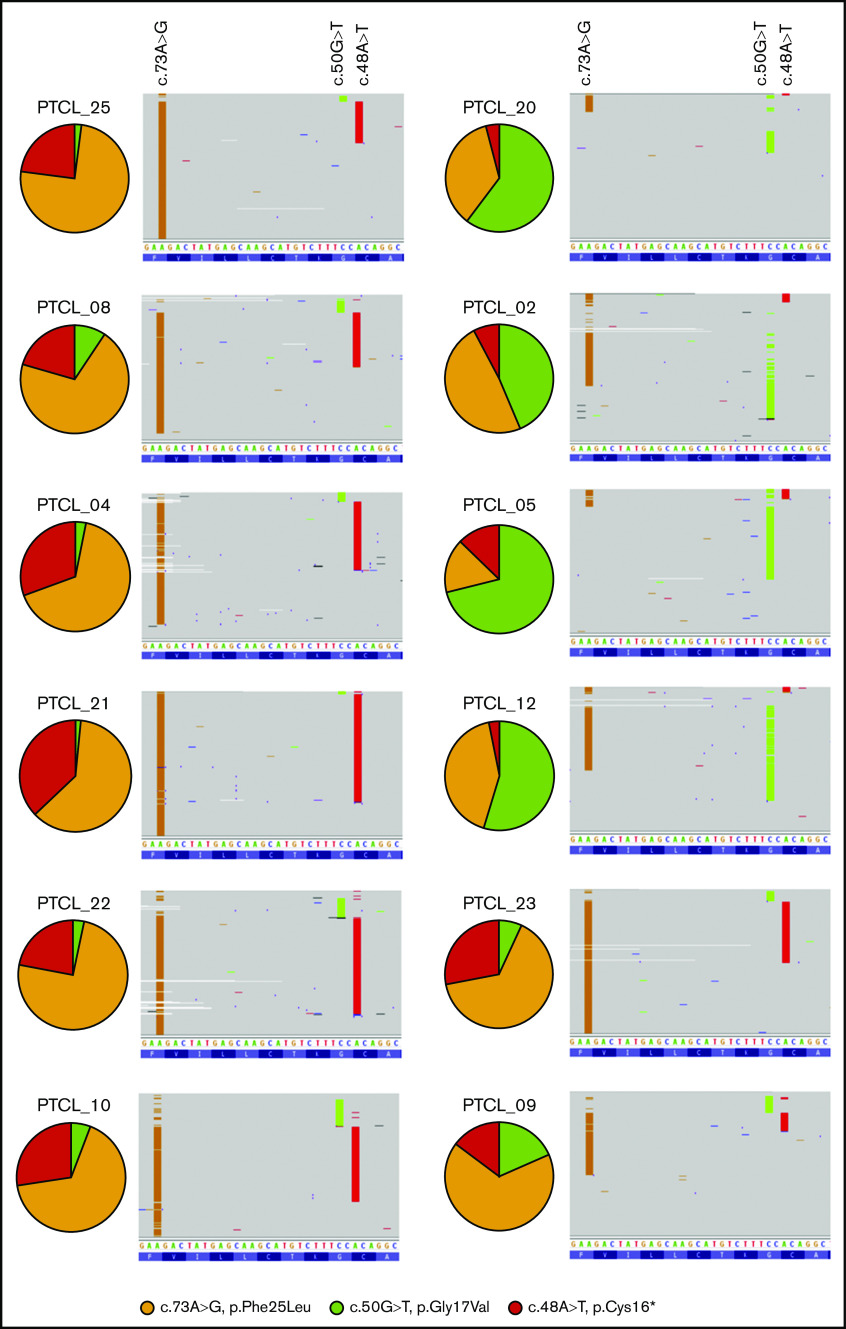
The mutational landscape of peripheral T-cell lymphoma (PTCL) is being revealed through sequencing of lymph node samples, but there has been little work on the mutational load that is present in cell-free DNA (cfDNA) from plasma. We report targeted sequencing of cfDNA from PTCL patients to demonstrate c.50G>T (p.Gly17Val) in RHOA as previously described in angioimmunoblastic T-cell lymphoma (AITL) and a group of PTCL not otherwise specified (NOS) but also detect novel mutations at c.73A>G (p.Phe25Leu) and c.48A>T (p.Cys16*) of exon 2, which were confirmed by Sanger sequencing. In a group of AITL and PTCL-NOS analyzed by droplet digital polymerase chain reaction, 63% (12/19) showed c.50G>T (p.Gly17Val), 53% (10/19) c.73A>G (p.Phe25Leu), and 37% (7/19) c.48A>T (pCys16*). Sequencing of lymph node tissue in 3 out of 9 cases confirmed the presence of c.73A>G (p.Phe25Leu). Inspection of individual sequencing reads from individual patients showed that a single RHOA allele could contain >1 mutation, suggesting haplotypes of mutations at RHOA. Serial sampling showed changes to RHOA mutational frequency with treatment and the apparent occurrence of clones bearing specific haplotypes associated with relapse. Therefore, sequencing of RHOA from cfDNA has revealed new mutations and haplotypes. The clinical significance of these findings will need to be explored in clinical trials, but liquid biopsy might have potential for guiding treatment decisions in PTCL.


Conflict of interest statement

Conflict-of-interest disclosure: The authors declare no competing financial interests.

Figures

None
Graphical abstract
Figure 1.
Figure 1.
RHOA mutations detected in peripheral blood. (A) The results of targeted deep sequencing from cfDNA of RHOA exon 2 by Illumina CAPP-seq. Mutations were detected at presentation (n = 5) at c.50G>T (p.Gly17Val), c.73A>G (p.Phe25Leu), and c.48A>T (pCys16*). Diagnosis (either AITL or PTCL-NOS) is indicated. In all cases, the malignant T-cells expressed PD-1. (B) ddPCR assays from cfDNA for the 3 RHOA mutations. Diagnosis and PD-1 status are shown. Red shading indicates PD-1 expression; for cases with gray shading, PD-1 is negative, and for those with a diagonal line, PD-1 is not determined. (C) Mutational frequency by ddPCR results was correlated with VAF from Ion Torrent sequencing for the 3 RHOA mutations in samples at presentation and during the course of treatment (28 samples from 21 patients). Linear regression (red line) and 95% confidence interval are shown. For c.50G>T (p.Gly17Val), R2 = 0.65 and P = .0001; for c.73A>G (p.Phe25Leu), R2 = 0.974 and P = .0001; and for c.48A>T (pCys16*), R2 = 0.862 and P = .0001. (D) Sanger sequencing fluorograms from cloned PCR product showing the 3 RHOA mutations c.50G>T, c.73A>G, and c.48A>T (pCys16*). Mut, mutated; WT, wild-type.
Figure 2.
Figure 2.
Comparison of targeted sequencing using DNA from plasma or FFPE lymph node sections. (A) Plots compare amounts of mutation in plasma (human genome equivalents [hGE]) with VAF (%) in lymph node from FFPE tissue. Results are presented for 9 individual cases together with a combined plot of all patients. Individual RHOA mutations and other detected and mutated genes are color coded as shown. (B) Four cores were sequenced from a single lymph node. Results of the sequencing are indicated in the table with a color scale being used to indicate the VAF. Middle panel shows a hematoxylin and eosin–stained lymph node section indicating the positions of cores labeled C1 to C4. Right panel shows immunofluorescence staining of a sequential lymph node section to show heterogeneity of CD4 staining.
Figure 3.
Figure 3.
RHOA mutational frequencies and haplotypes vary between individuals. Haplotypes at RHOA exon 2 from each PTCL case in which the baseline plasma sample contained a total RHOA mutational burden (VAF) >10%. The pie chart represents the proportions of each individual exon 2 mutation as a fraction of all reads bearing a RHOA mutation. Panels to the right show down-sampled read pileups (representing ∼10% of all reads) with the position of mutations indicated above and the DNA sequence below.
Figure 4.
Figure 4.
RHOA mutations can be followed over time and correlate with radiological measures of response. Clonal tides representing mutation dynamics for RHOA and, where possible, TET2 and IDH2, during treatment of 5 PTCL cases. VAFs are plotted as indicated by the color key to the lower right. The dotted vertical lines indicate the points at which samples were taken. (A) PTCL_08 was treated with cyclophosphamide, Adriamycin, vincristine, and prednisolone (CHOP) chemotherapy and achieved a radiological complete response. Subsequent consolidation was with ifosfamide, epirubicin, and etoposide (IVE) followed by a lomustine, etoposide, cytarabine, melphalan (HDT/LEAM)–conditioned autologous stem cell transplant. Data were obtained from Ion Torrent sequencing. (B) PTCL_02 had disease refractory to 2 lines of chemotherapy (CHOP and IVE) before achieving a PET-negative response with gemcitabine, dexamethasone, and cisplatin (GDP). Treatment was then consolidated with an autologous followed by an allogeneic stem cell transplant. The data for the 4 timepoints indicated by black dotted lines are taken from Ion Torrent sequencing data and those indicated by red dotted lines from ddPCR. (C) PTCL_25 was treated with CHOP with etoposide (CHOEP) chemotherapy but did not respond and then received IVE followed by HDT/LEAM autologous stem cell transplant. PTCL recurred 2 years later, and reinduction chemotherapy with GDP achieved a transient partial response before further progression occurred and the patient died. Data were obtained from Ion Torrent sequencing. (D) PTCL_10 was treated with CHOP chemotherapy and achieved a partial remission on CT scan. The remission lasted ∼18 months, but she then represented with a rising peripheral blood lymphocyte count, pruritus, and skin lesions. CT scan (day 476) showed lung nodules. Lymph node biopsy confirmed relapsed lymphoma, and she was retreated with GDP. In this case, loss of mutant RHOA after GDP was associated with disease progression. Data were obtained from Ion Torrent sequencing. (E) PTCL_09 was treated with CHOP chemotherapy but progressed clinically and was treated with IVE, achieving a partial response. The response was consolidated with GDP and autologous stem cell transplantation. Data were obtained from ddPCR.
Figure 5.
Figure 5.
Inferred clonal architecture of RHOA mutations and changes to RHOA mutations or haplotypes over time. IGV pileups from a single patient, PTCL_25, (Figure 4C) at 2 timepoints T1 (A) and T4 (B). The data are interpreted to show evolution from a wild-type gene sequence to one showing 2 mutations via a gene sequence bearing a single mutation as shown in the panels to the right of the read pileups. (C) Inferred phylogenetic tree inferred from IGV read pileups. At T1 the dominant clone bears a single c.73A>G (p.Phe25Leu) (dark green) with a subclone that shows both c.73A>G (p.Phe25Leu) and c.48A>T (pCys16*) (light green). At the later timepoint, T4, the dominant clone bears a single c.50G>T (p.Gly17Val) (blue) with a subclone bearing c.50G>T (p.Gly17Val) and c.73A>G (p.Phe25Leu) (purple). Analysis showed the same RHOA phylogenetic tree for both PTCL_10 and PTCL_25. The branch of the tree to the left shows the inferred predominant clonal arrangement at the early timepoint (T1) whereas the branch to the right shows the clones, which emerge at timepoint, T4. For both cases stacked bar charts show the relative frequencies of RHOA mutations or haplotypes in PTCL_25 (D) and PTCL_10 (E). The empty columns indicate that samples were analyzed at these timepoints but that no mutant RHOA was detected. The phylogenetic tree derived from the haplotype data for PTCL_10 is identical to that of PTCL_25 (Figure 5C).

References

    1. Foss FM, Zinzani PL, Vose JM, Gascoyne RD, Rosen ST, Tobinai K. Peripheral T-cell lymphoma. Blood. 2011;117(25):6756-6767. - PubMed
    1. Vose J, Armitage J, Weisenburger D; International T-Cell Lymphoma Project . International peripheral T-cell and natural killer/T-cell lymphoma study: pathology findings and clinical outcomes. J Clin Oncol. 2008;26(25):4124-4130. - PubMed
    1. de Leval L, Rickman DS, Thielen C, et al. . The gene expression profile of nodal peripheral T-cell lymphoma demonstrates a molecular link between angioimmunoblastic T-cell lymphoma (AITL) and follicular helper T (TFH) cells. Blood. 2007;109(11):4952-4963. - PubMed
    1. Piccaluga PP, Agostinelli C, Califano A, et al. . Gene expression analysis of peripheral T cell lymphoma, unspecified, reveals distinct profiles and new potential therapeutic targets. J Clin Invest. 2007;117(3):823-834. - PMC - PubMed
    1. Couronné L, Bastard C, Bernard OA. TET2 and DNMT3A mutations in human T-cell lymphoma. N Engl J Med. 2012;366(1):95-96. - PubMed

Publication types

Substances