

Tissue-resident macrophages actively suppress IL-1beta release via a reactive prostanoid/IL-10 pathway
- PMID: 32484988
- PMCID: PMC7360975
- DOI: 10.15252/embj.2019103454
Tissue-resident macrophages actively suppress IL-1beta release via a reactive prostanoid/IL-10 pathway
Abstract
The alarm cytokine interleukin-1β (IL-1β) is a potent activator of the inflammatory cascade following pathogen recognition. IL-1β production typically requires two signals: first, priming by recognition of pathogen-associated molecular patterns leads to the production of immature pro-IL-1β; subsequently, inflammasome activation by a secondary signal allows cleavage and maturation of IL-1β from its pro-form. However, despite the important role of IL-1β in controlling local and systemic inflammation, its overall regulation is still not fully understood. Here we demonstrate that peritoneal tissue-resident macrophages use an active inhibitory pathway, to suppress IL-1β processing, which can otherwise occur in the absence of a second signal. Programming by the transcription factor Gata6 controls the expression of prostacyclin synthase, which is required for prostacyclin production after lipopolysaccharide stimulation and optimal induction of IL-10. In the absence of secondary signal, IL-10 potently inhibits IL-1β processing, providing a previously unrecognized control of IL-1β in tissue-resident macrophages.
Keywords: IL-10; IL-1beta; macrophages; prostacyclin.
© 2020 The Authors. Published under the terms of the CC BY 4.0 license.
Conflict of interest statement
AABR is a co‐inventor on granted patents (US 10,538,487, EP 3259253) and patent applications (WO2018215818, WO2017140778, WO2016131098) for NLRP3 inhibitors, which are licensed to Inflazome Ltd, a company headquartered in Dublin, Ireland. Inflazome is developing drugs that target the NLRP3 inflammasome to address unmet clinical needs in inflammatory disease.
Figures
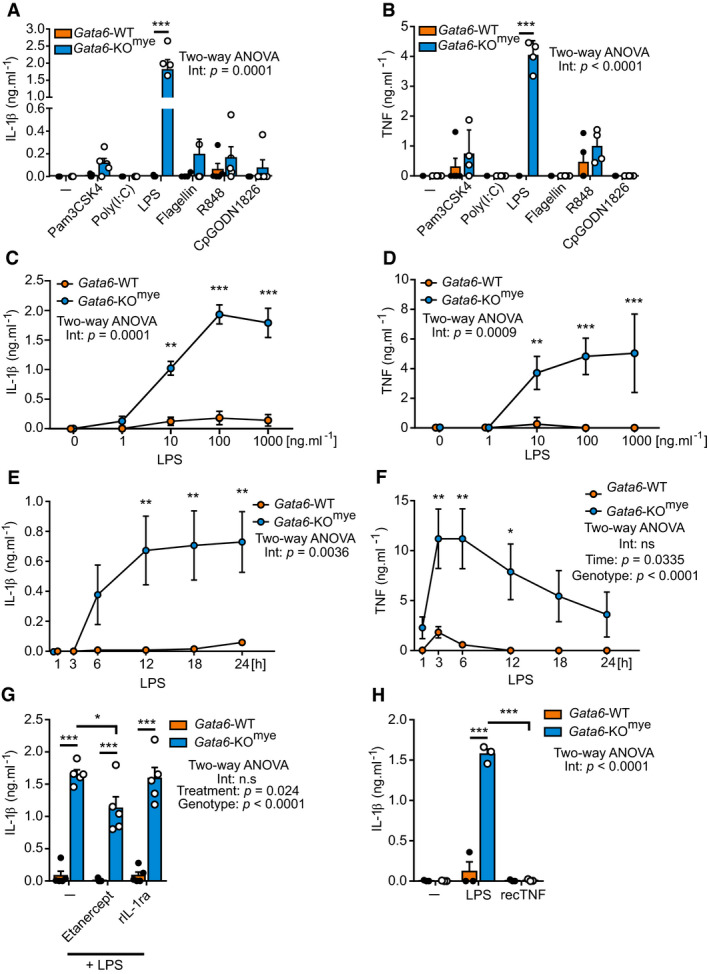
- A, B
Gata6‐WT and Gata6‐KOmye peritoneal macrophages (pMФ) were unstimulated (–) or stimulated with TLR2L Pam3CSK4 (500 ng/ml), TLR3L Poly(I:C) (1 μg/ml), TLR4L ultrapure LPS (100 ng/ml), TLR5L flagellin (100 ng/ml), TLR7 and 8L R848 (1 μg/ml) or TLR9L CpG ODN1826 (5 μM). Culture supernatants were collected 24 h after the start of stimulation and IL‐1β and TNF ELISA were performed. n = 5, two‐way ANOVA analysis with Tukey's multiple comparison post‐test.
- C, D
IL‐1β (C) and TNF (D) ELISA of Gata6‐WT and Gata6‐KOmye pMФ stimulated for 24 h with the indicated LPS concentrations. n = 3, two‐way ANOVA analysis with Sidak's multiple comparison post‐test.
- E, F
IL‐1β (E) and TNF (F) ELISA from Gata6‐WT and Gata6‐KOmye pMФ stimulated with LPS (100 ng/ml) for the indicated times. n = 3, two‐way ANOVA analysis with Sidak's multiple comparison post‐test.
- G
IL‐1β ELISA of Gata6‐WT and Gata6‐KOmye pMФ stimulated for 18 h with 100 ng/ml LPS or recombinant IL‐1 receptor antagonist (rIL‐1ra), n = 4–5, two‐way ANOVA analysis with Tukey's multiple comparison post‐test.
- H
IL‐1β ELISA of Gata6‐WT and Gata6‐KOmye pMФ stimulated for 18 h with 100 ng/ml LPS or 100 ng/ml recombinant TNF (recTNF), n = 4–5, two‐way ANOVA analysis with Tukey's multiple comparison post‐test.
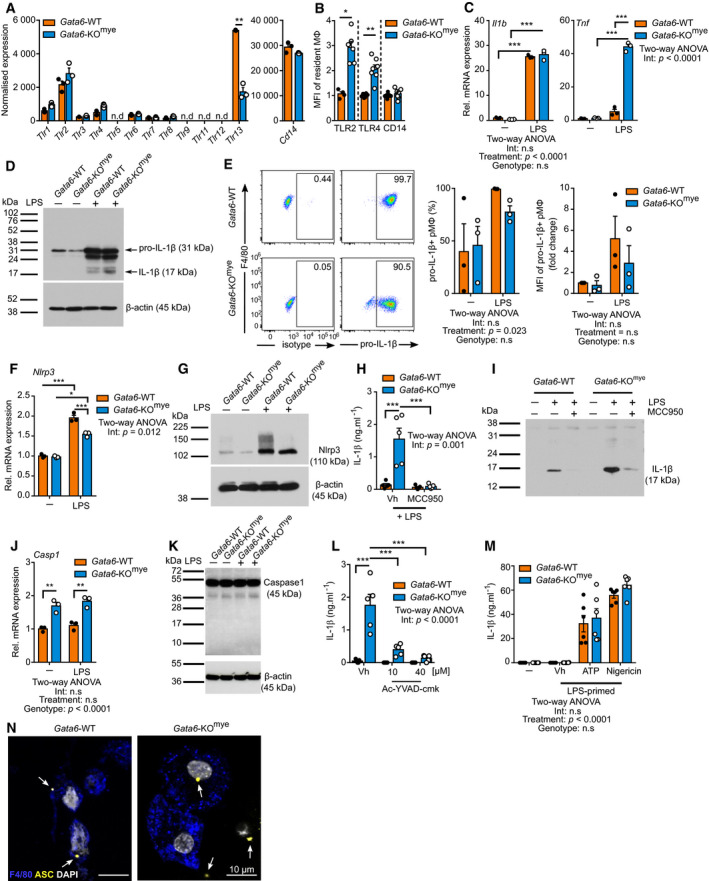
- A
Normalized expression of Tlr and Cd14 genes following microarray analysis performed on unstimulated cell‐sorted Gata6‐WT and Gata6‐KOmye pMФ. Data are shown as mean ± SEM from three biological replicates. Statistical significance was determined using empirical Bayesian statistic corrected for false discovery rate by the Benjamini–Hochberg procedure. n.d = non‐detectable.
- B
Mean fluorescence intensity (MFI) of extracellular TLR2, TLR4 and CD14 expression on naïve Gata6‐WT and Gata6‐KOmye pMФ. n = 4–7 individual mice per group.
- C, D
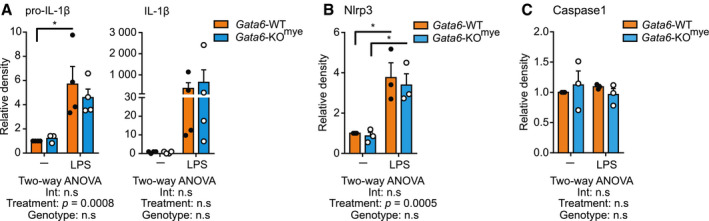
Il1b and Tnf mRNA relative expression (C) and IL‐1β Western blot protein analysis (D) of Gata6‐WT and Gata6‐KOmye pMФ stimulated with 100 ng/ml LPS for 3 and 6 h respectively. Data shown are representative of at least three independent experiments. Western blot was performed on whole cell lysates.
- E
Representative dot plot, percentage and mean fluorescence intensity (MFI) analysis of pro‐IL‐1β+ Gata6‐WT and Gata6‐KOmye pMФ flow cytometry analysis 3 h after stimulation with 100 ng/ml LPS. n = at least three independent experiments.
- F
Nlrp3 mRNA relative expression of Gata6‐WT and Gata6‐KOmye pMФ stimulated with 100 ng/ml LPS for 3 h. Data shown are pooled from three independent experiments.
- G
Western blot protein analysis of Gata6‐WT and Gata6‐KOmye pMФ stimulated with 100 ng/ml LPS for 6 h. Data shown are representative of at least three independent experiments. Western blot was performed on whole cell lysates.
- H, I
IL‐1β ELISA (H) and Western blot protein analysis (I) of supernatants collected from Gata6‐WT and Gata6‐KOmye pMФ stimulated with 100 ng/ml LPS and either vehicle control (Vh, DMSO) or 10 μM MCC950 for 24 h (n = 5). Data shown in (H) are pooled from five independent replicates.
- J, K
Caspase1 (Casp1) mRNA relative expression (J) and Western blot protein analysis (K) of Gata6‐WT and Gata6‐KOmye pMФ stimulated with 100 ng/ml LPS for 3 and 6 h respectively. Data shown are pooled from three independent experiments.
- L
IL‐1β ELISA of Gata6‐WT and Gata6‐KOmye pMФ stimulated with 100 ng/ml LPS and either vehicle control (Vh, DMSO) or Ac‐YVAD‐cmk for 24 h. Data shown are pooled of five independent replicates.
- M
IL‐1β ELISA of Gata6‐WT and Gata6‐KOmye pMФ stimulated with 100 ng/ml LPS for 3 h, followed by a 30 min pulse with either vehicle control (Vh), 5 mM ATP or 20 μM nigericin. Data shown are pooled of five independent replicates.
- N
Representative picture of confocal immunofluorescence analysis of Gata6‐WT and Gata6‐KOmye pMФ stimulated with 100 ng/ml LPS for 3 h, followed by a 30 min pulse with 5 mM ATP. The white arrows show ASC specks. Scale bar = 10 μm.
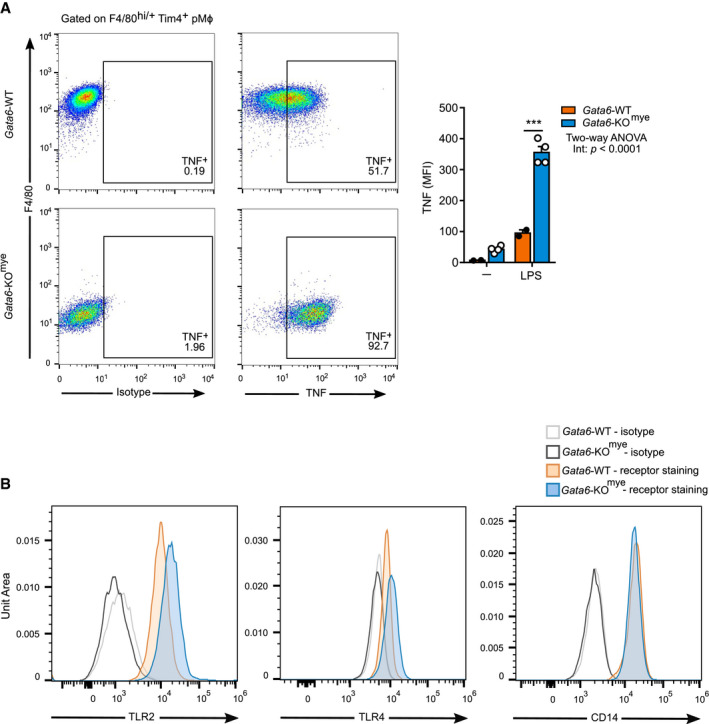
Representative flow cytometry analysis of TNF expression in Gata6‐WT and Gata6‐KOmye pMФ stimulated for 3 h with 100 ng/ml LPS and 0.1 % (v/v) GolgiBlock. Data shown are representative of at least three independent experiments. Data are expressed as mean ± SEM. Two‐way ANOVA analysis followed by Tukey's multiple comparison post‐test was performed. ***P < 0.001.
Histogram overlays of flow cytometry analysis of cell surface expression of TLR2, TLR4 and CD14 of Gata6‐WT and Gata6‐KOmye pMФ.
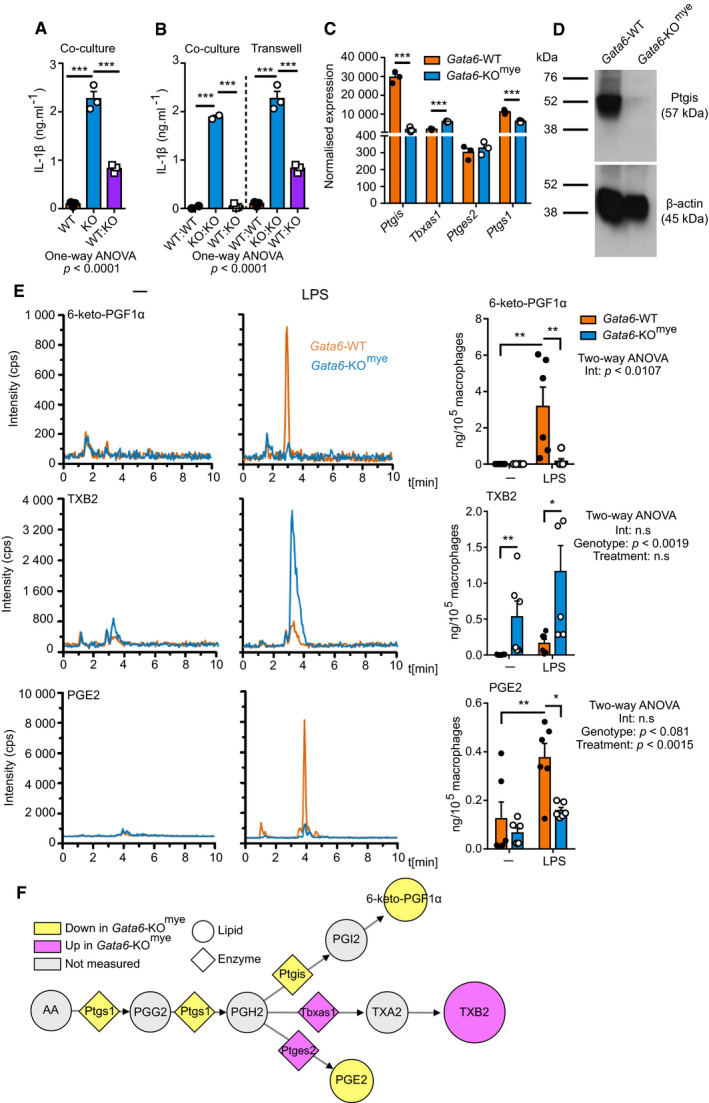
IL‐1β ELISA analysis of supernatants of Gata6‐WT and Gata6‐KOmye pMФ in monoculture or co‐cultured (ratio 1:1) and stimulated for 24 h with 100 ng/ml LPS. Data shown are pooled from three independent experiments. One‐way ANOVA statistical analysis with Tukey's multiple comparison test was performed.
IL‐1β ELISA analysis of supernatants of Gata6‐WT and Gata6‐KOmye pMФ co‐cultured in the same well (co‐culture) or using Transwell system (ratio 1:1) and stimulated for 24 h with 100 ng/ml LPS. Data shown are pooled from three independent experiments. One‐way ANOVA statistical analysis with Tukey's multiple comparison test was performed.
Microarray analysis of Ptgis, Tbxas1, Ptges2 and Ptgs1 expression from Gata6‐WT and Gata6‐KOmye pMФ isolated from naïve mice. Data are shown as mean ± SEM from three biological replicates. Statistical significance was determined using empirical Bayesian statistic corrected for false discovery rate by the Benjamini–Hochberg procedure.
Western blot analysis of Ptgis protein level of unstimulated pMФ from Gata6‐WT and Gata6‐KOmye mice.
Mass spectrometry analysis of 6‐keto‐PGF1α, TXB2 and PGE2 content of Gata6‐WT and Gata6‐KOmye pMФ unstimulated (–) or stimulated for 3 h with 100 ng/ml LPS. n = 6. Two‐way ANOVA statistical analysis with Tukey's multiple comparison post‐test was performed.
Representation of the variation of the prostanoid synthesis pathway in Gata6‐KOmye pMФ created using Cytoscape software. Circle shape represent lipids, diamond shape enzymes, yellow downregulation and purple upregulation of the expression/production in Gata6‐KOmye cells. The size of the circles represents relative levels observed in Gata6‐KOmye cells.
- A
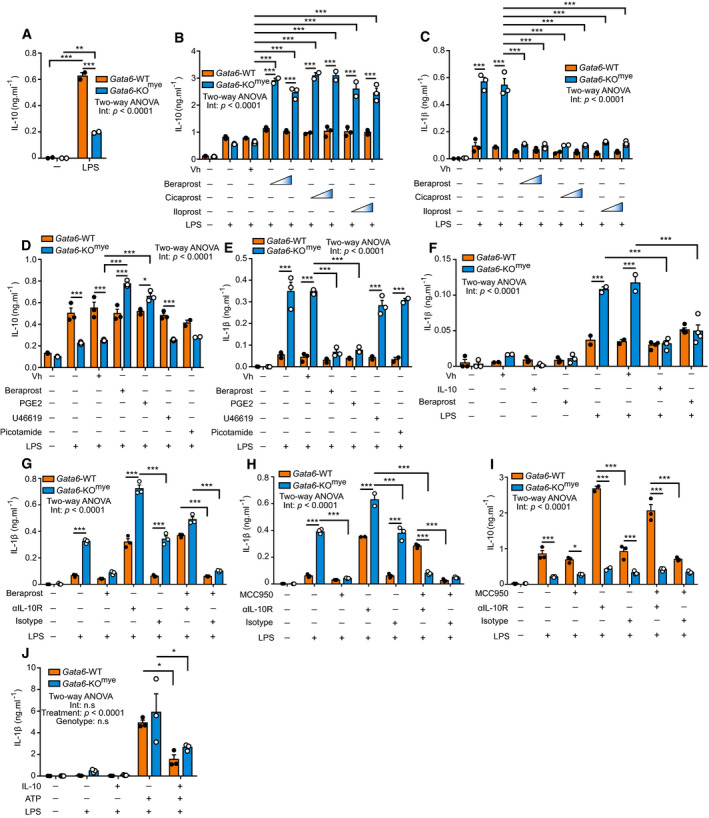
IL‐10 ELISA of supernatants of Gata6‐WT and Gata6‐KOmye pMФ unstimulated (–) or stimulated with 100 ng/ml LPS. Data shown are representative of at least five independent experiments.
- B, C
IL‐10 (B) and IL‐1β (C) ELISA of supernatants of Gata6‐WT and Gata6‐KOmye pMФ unstimulated (–) or stimulated with 100 ng/ml LPS, beraprost (1 and 10 μM), cicaprost (1 and 10 μM), iloprost (1 or 10 nM) or vehicle control (Vh, DMSO). Data shown are representative of at least three independent experiments.
- D, E
IL‐10 (D) and IL‐1β (E) ELISA of supernatants of Gata6‐WT and Gata6‐KOmye pMФ unstimulated (–) or stimulated with 100 ng/ml LPS, 10 μM beraprost, 10 μM PGE2, 10 μM U46619, 100 μM picotamide or vehicle control (Vh, methyl acetate). Data shown are representative of at least three independent experiments.
- F
IL‐1β ELISA of supernatants of Gata6‐WT and Gata6‐KOmye pMФ unstimulated (–) or stimulated with 100 ng/ml LPS, 10 ng/ml IL‐10, 10 μM beraprost or vehicle control (Vh). Data shown are representative of at least 3 independent experiments.
- G
IL‐1β ELISA of supernatants of Gata6‐WT and Gata6‐KOmye pMФ unstimulated (–) or stimulated with 100 ng/ml LPS, 10 μM beraprost, 5 μg/ml αIL‐10R or isotype antibody. Data shown are representative of at least three independent experiments.
- H, I
IL‐1β (H) and IL‐10 (I) ELISA of supernatants of Gata6‐WT and Gata6‐KOmye pMФ unstimulated (–) or stimulated with 100 ng/ml LPS, 10 μM MCC950, 5 μg/ml αIL‐10R or isotype antibody All stimulations were performed for 16 h. Data shown are representative of at least three independent experiments.
- J
IL‐1β ELISA of supernatants of Gata6‐WT and Gata6‐KOmye pMФ unstimulated (–) or stimulated with 100 ng/ml LPS, 10 ng/ml IL‐10 and 5 mM ATP. Data shown are a pool of three independent experiments.
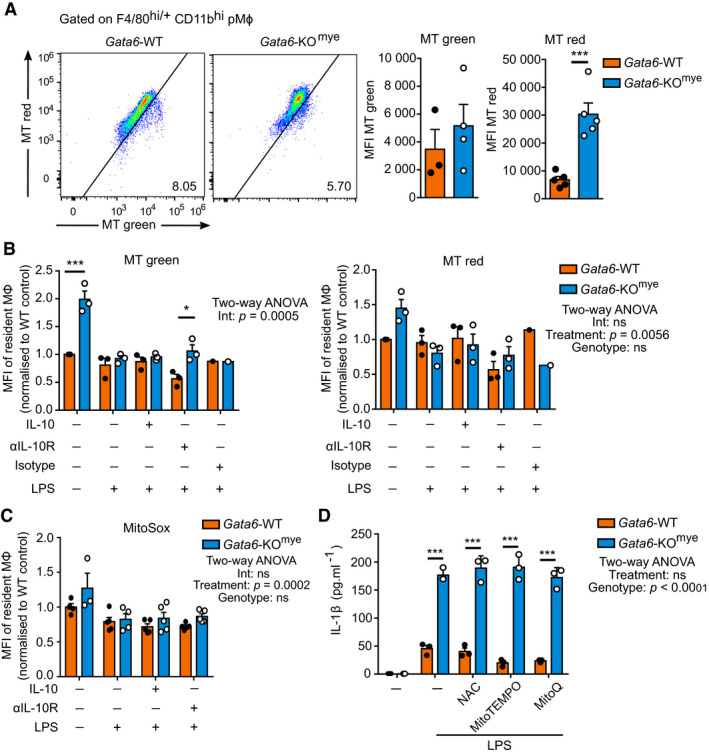
Flow cytometry analysis of MitoTracker (MT) Green and Red integration in Gata6‐WT and Gata6‐KOmye naïve pMФ (gated on F4/80hi/+ Tim4+) in vivo, 30 min after intraperitoneal injection (i.p.) of 1 μM of MitoTracker Green and Red. Data shown are representative of 3–5 independent mice of each genotype and are expressed as mean ± SEM. Student's t‐test analysis was performed.
Flow cytometry analysis of MitoTracker Green and Red staining in Gata6‐WT and Gata6‐KOmye pMФ (gated on F4/80hi/+ Tim4+) unstimulated (–) or after LPS (100 ng/ml), IL‐10 (10 ng/ml), αIL‐10R (5 μg/ml) or isotype (5 μg/ml) stimulation for 16 h in vitro. Data shown are pooled from three independent experiments and normalized to WT unstimulated.
Flow cytometry analysis of MitoSOX staining in Gata6‐WT and Gata6‐KOmye pMФ (gated on F4/80hi/+ Tim4+) unstimulated (–) or after LPS (100 ng/ml), IL‐10 (10 ng/ml) and αIL‐10R (5 μg/ml) stimulation for 16 h in vitro. Data shown are pooled from 2 independent experiments and normalized to WT unstimulated.
IL‐1β ELISA of supernatants of Gata6‐WT and Gata6‐KOmye pMФ unstimulated (–) or stimulated with 100 ng/ml LPS, 500 μM MitoTEMPO, 10 mM NAC, 0.5 μM MitoQ for 16 h. Data are representative of at least 3 experiments.
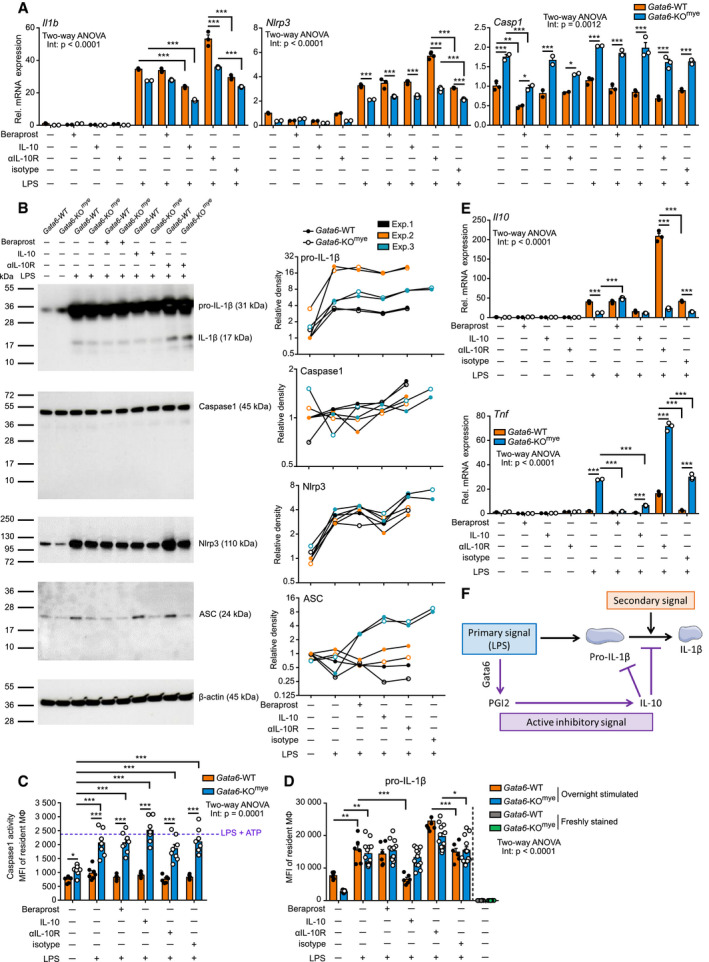
mRNA expression analysis of Il1b, Nlrp3 and caspase1 (Casp1) of Gata6‐WT and Gata6‐KOmye pMФ stimulated for 3 h with 100 ng/ml LPS, 10 μM beraprost, 10 ng/ml IL‐10, 5 μg/ml αIL‐10R or 5 μg/ml isotype. Data are representative of at least three independent experiments.
Western blot analysis (left) and quantification (right) of Gata6‐WT and Gata6‐KOmye pMФ stimulated for 6 h with 100 ng/ml LPS, 10 μM beraprost, 10 ng/ml IL‐10 or 5 μg/ml αIL‐10R. Data are representative of three independent experiments.
Caspase1 activity analysis of Gata6‐WT and Gata6‐KOmye pMФ stimulated for 16 h with 100 ng/ml LPS, 10 μM beraprost, 10 ng/ml IL‐10, 5 μg/ml αIL‐10R or 5 μg/ml isotype. n = 5–8 individual mice.
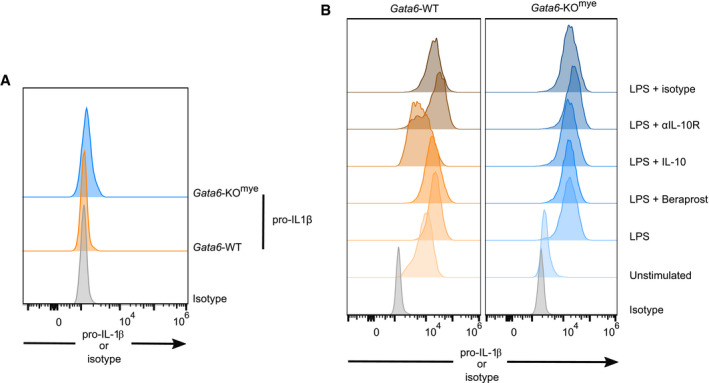
Mean fluorescence intensity (MFI) of pro‐IL‐1β of Gata6‐WT and Gata6‐KOmye pMФ stimulated for 3 h with 100 ng/ml LPS, 10 μM beraprost, 10 ng/ml IL‐10, 5 μg/ml αIL‐10R or 5 μg/ml isotype for 16 h or freshly isolated. n = 6–13 individual mice. Data were log‐transformed before performing statistical analysis.
mRNA expression analysis of Il10 and Tnf of Gata6‐WT and Gata6‐KOmye pMФ stimulated for 3 h with 100 ng/ml LPS, 10 μM beraprost, 10 ng/ml IL‐10 or 5 μg/ml αIL‐10R. Data are representative of at least three independent experiments.
Representation of the mechanism of action of the Gata6‐PGI2‐IL‐10 active inhibitory signal on IL‐1β processing.
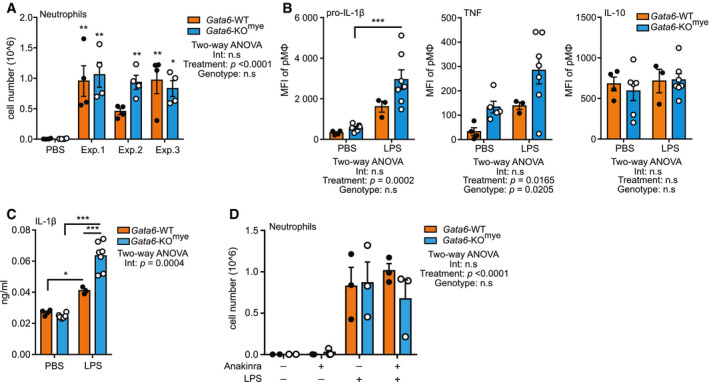
Flow cytomerty analysis of neutrophil (Ly6G+ CD11b+) number recruited to the peritoneal cavity of Gata6‐WT and Gata6‐KOmye mice 4 h after i.p injection of 1 ng ultra‐pure LPS. Three independent experiments are shown, n = 4 mice per group. Significance are indicated by * over the bar, compared to the corresponding control (Gata6‐WT or Gata6‐KOmye PBS injected).
Flow cytometry analysis of intracellular cytokines in Gata6‐WT and Gata6‐KOmye pMΦ, 3 h after i.p injection of PBS or 1 ng ultra‐pure LPS.
ELISA analysis of IL‐1β contained in the peritoneal fluid of Gata6‐WT and Gata6‐KOmye mice, 3 h after i.p injection of PBS or 1 ng ultra‐pure LPS. n = 3–6 mice per group.
Flow cytomerty analysis of neutrophil (Ly6G+ CD11b+) number recruited to the peritoneal cavity of Gata6‐WT and Gata6‐KOmye mice 4 h after i.p injection of 1 ng ultra‐pure LPS combined or not with 50 mg/ml Anakinra, n = 2–3 mice per group. Results are expressed as mean ± SEM. Two‐way ANOVA analysis followed by Tukey's multiple comparison post‐test was performed. *P < 0.05, **P < 0.01, ***P < 0.001.
References
-
- Berlato C, Cassatella MA, Kinjyo I, Gatto L, Yoshimura A, Bazzoni F (2002) Involvement of suppressor of cytokine signaling‐3 as a mediator of the inhibitory effects of IL‐10 on lipopolysaccharide‐induced macrophage activation. J Immunol 168: 6404–6411 - PubMed
-
- Bresnihan B, Newmark R, Robbins S, Genant HK (2004) Effects of anakinra monotherapy on joint damage in patients with rheumatoid arthritis. Extension of a 24‐week randomized, placebo‐controlled trial. J Rheumatol 31: 1103–1111 - PubMed
-
- Brock TG, McNish RW, Peters‐Golden M (1999) Arachidonic acid is preferentially metabolized by cyclooxygenase‐2 to prostacyclin and prostaglandin E2. J Biol Chem 274: 11660–11666 - PubMed
-
- Bryant C, Fitzgerald KA (2009) Molecular mechanisms involved in inflammasome activation. Trends Cell Biol 19: 455–464 - PubMed
Publication types
MeSH terms
Substances
Associated data
- Actions
Grants and funding
LinkOut - more resources
Full Text Sources
Molecular Biology Databases
