

Proteome profiling in cerebrospinal fluid reveals novel biomarkers of Alzheimer's disease
- PMID: 32485097
- PMCID: PMC7266499
- DOI: 10.15252/msb.20199356
Proteome profiling in cerebrospinal fluid reveals novel biomarkers of Alzheimer's disease
Abstract
Neurodegenerative diseases are a growing burden, and there is an urgent need for better biomarkers for diagnosis, prognosis, and treatment efficacy. Structural and functional brain alterations are reflected in the protein composition of cerebrospinal fluid (CSF). Alzheimer's disease (AD) patients have higher CSF levels of tau, but we lack knowledge of systems-wide changes of CSF protein levels that accompany AD. Here, we present a highly reproducible mass spectrometry (MS)-based proteomics workflow for the in-depth analysis of CSF from minimal sample amounts. From three independent studies (197 individuals), we characterize differences in proteins by AD status (> 1,000 proteins, CV < 20%). Proteins with previous links to neurodegeneration such as tau, SOD1, and PARK7 differed most strongly by AD status, providing strong positive controls for our approach. CSF proteome changes in Alzheimer's disease prove to be widespread and often correlated with tau concentrations. Our unbiased screen also reveals a consistent glycolytic signature across our cohorts and a recent study. Machine learning suggests clinical utility of this proteomic signature.
Keywords: Alzheimer's disease; cerebrospinal fluid; mass spectrometry; neurodegeneration; proteomics.
© 2020 The Authors. Published under the terms of the CC BY 4.0 license.
Conflict of interest statement
The authors declare that they have no conflict of interest.
Figures

Overview of the study populations (cohorts) and schematic proteomic workflow. The CSF of three cohorts comprising AD and control subjects was analyzed. The total number of subjects per cohort group is depicted. Light and dark shades represent female and male subjects, respectively. “Ctrl” refers to non‐AD control subjects.
Number of proteins identified and quantified passing the 1% FDR cutoffs in each sample. Horizontal lines show the mean and the error bars ± SD. The dashed line indicates the level of the meta‐median (1,233 proteins) of the group medians of quantified proteins. Number of samples per group as shown in A).
Data completeness curve. The number of proteins in the dataset (Y axis) depending on the minimum number of samples in which the proteins have each been quantified (X axis) is plotted. The arrows indicate 50%, 75%, and 100% data completeness.
Median CSF protein abundance distribution as calculated from MS intensities of quantified peptides of each protein. The top ten most abundant proteins and hemoglobins are highlighted.
Global correlation map of proteins generated by clustering the Pearson correlation coefficients of all possible protein combinations. The abundance of proteins with common regulation correlates across samples, and they therefore form a cluster. Prominent clusters are annotated with functional terms obtained from bioinformatics enrichment analysis. The position of tau (gene name MAPT) is labeled on the Y axis. The inset shows the color code for Pearson correlation coefficients.

- A
Age of participants at the time point of CSF collection. Bars represent mean and standard deviation. Participant numbers are 29, 31, 26, 12, 16, 33, 26, and 24 for Sweden AD, Sweden biochemical controls, Magdeburg AD, Magdeburg biochemical controls, Berlin AD, Berlin depression controls, and Berlin subjective cognitive impairment (SCI) controls.
- B–F
CSF concentration of t‐tau (B), p‐tau181 (C), Aβ1–42 (D), Aβ1–40 (E), and the Aβ1–42/Aβ1–40 concentration ratio (F) as measured by ELISA. Bars represent mean and standard deviation. NA indicates that these data were not available. Participant numbers as in A) if data were available.
- G–I
CSF concentrations of t‐tau plotted versus Aβ1–42 for samples of the Sweden (G), Magdeburg (H), and Berlin (I) cohorts. Samples classified as AD according to the biochemical criteria of this study colored in red, samples as non‐AD in blue.
- J–K
CSF concentration of t‐tau plotted versus the Aβ1–42/Aβ1–40 concentration ratio for samples of the Magdeburg (J) and Berlin (K) cohorts. Samples classified as AD according to the biochemical criteria of this study colored in red, samples as non‐AD in blue.
- L
Mini‐mental state examination (MMSE) scores, a measure of cognitive performance. Bars represent mean and standard deviation. These data were only available for the Berlin cohort. Participant numbers are 33, 26, and 24 for Berlin AD, Berlin depression controls, and Berlin subjective cognitive impairment (SCI) controls.

- A–C
Comparison of inter‐participant variation and technical assay variation. Coefficients of variation (CVs) were determined in a separate experiment for intra‐plate CVs (A) and inter‐plate CVs (B) to benchmark protein quantitation. Biological CVs were calculated from the main study data (C). Proteins with a CV below 20% are highlighted in blue. Numbers of proteins above and below this CV cutoff are given above and below the cutoff line, respectively. The CV experiment data resulted from an independent protein search, and thus, the total number of identified proteins is not identical to the main study. The data show that technical variation is much smaller than inter‐participant variation.
- D
Annotation enrichment results for the tau (MAPT)‐associated cluster in Fig 1E. Enrichment in the cluster over the entire background CSF proteome vs. enrichment significance (−log10 of Benjamini–Hochberg‐adjusted P‐values). Terms of interest with links to neurons are highlighted in black.
- A–C
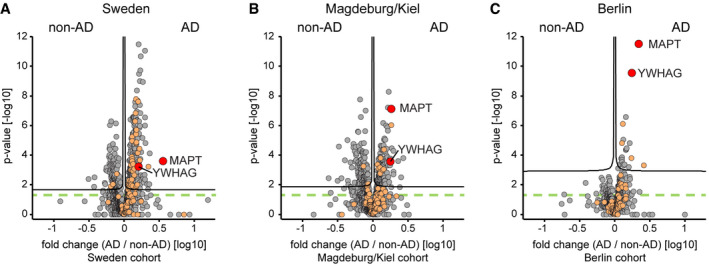
Protein AD/non‐AD fold changes plotted vs. statistical significance for Sweden (A), Magdeburg/Kiel (B), and Berlin (C) cohorts. Proteins associated with the GO annotation neuron projection labeled in orange. Proteins above the dashed green line are statistically significant (P < 0.05), and those above the black curves have a q‐value below 0.05 (see Materials and Methods).
- A, B
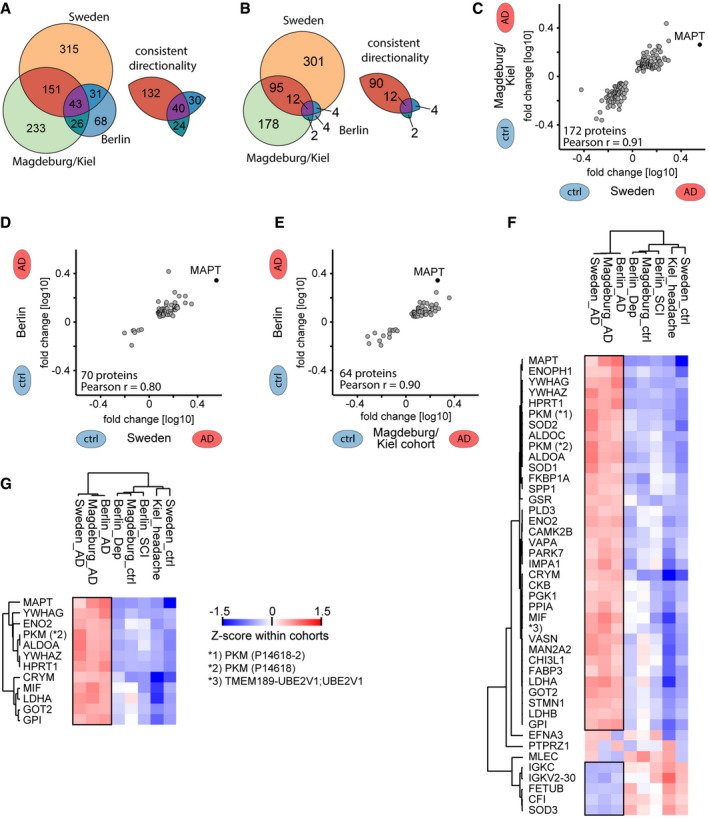
On the left, number of proteins that differ significantly (P‐value < 0.05 in A; q‐value < 0.05 in B) in abundance by AD status within each cohort. On the right, number of proteins thereof that have a consistent directionality of either elevated or reduced abundance in AD CSF in pairwise comparisons of cohorts.
- C–E
Correlation of protein AD/non‐AD fold changes in pairwise combinations of two cohorts each. Combinations are Sweden vs. Magdeburg/Kiel (C), Sweden vs. Berlin (D), and Magdeburg/Kiel vs. Berlin (E). Proteins included differ significantly (P < 0.05) and consistently in abundance by AD status in both cohorts each.
- F, G
Proteins that differ significantly (P < 0.05 in E; q < 0.05 in F) in abundance by AD status across all three cohorts. Z‐scored abundances of proteins in the AD and non‐AD groups of all cohorts shown by the heat map (see Materials and Methods). Hierarchical clustering separates AD from non‐AD groups. Pyruvate kinase PKM (PKM) was quantified in two isoforms, and UniProt IDs are given in parentheses. Black frames highlight proteins with consistent AD/non‐AD fold changes across cohorts.

- A, B
AD versus non‐AD association of our 40‐protein signature does not depend on the different control groups within the Berlin (A) and Magdeburg/Kiel (B) cohorts. AD versus non‐AD fold changes for comparisons against the two distinct non‐AD control groups, i.e. AD/depression vs. AD/subjective cognitive impairment (all Berlin) and AD/Magdeburg ctrl vs. AD/Kiel ctrl, are plotted for the Berlin and Magdeburg/Kiel cohorts.
- C
Linear regression model of protein intensity against AD/non‐AD status. Estimator strength for significant (P < 0.05) covariates age and sex shown by heat map. In case of age, the product of estimator (per 1 year) and the interquartile range (eleven years) in this dataset shown as strength. Overall explanation of variance by the regression model shown by R 2 values.

- A–C
Correlation of proteins with ELISA‐measured t‐tau concentration across samples within the Sweden (A), Magdeburg (B), and Berlin (C) cohorts. Proteins with a q‐value below 0.05 are labeled in yellow. Proteins of the 40‐protein signature are colored in red for those with higher abundance in AD CSF and in blue for those with higher abundance in non‐AD CSF.
- D
Three‐cohort summary of proteins significantly correlating with ELISA‐measured t‐tau. Protein names given for the 29 proteins out of the 40‐protein signature with significant (P < 0.05) correlation in each of the three cohorts. Pyruvate kinase PKM (PKM) was quantified in two isoforms, and UniProt IDs are given in parentheses.
- E
Overlap of proteins significantly differing by AD status with proteins significantly correlating to ELISA‐measured t‐tau.
- F
Annotation enrichment in the AD versus non‐AD fold change dimension. Terms with positive enrichment means are enriched in AD CSF over non‐AD CSF. Conversely, terms with enrichment means below zero are enriched in non‐AD compared with AD CSF. Annotations filtered for significance of enrichment (P < 0.05) and term size (10–100 proteins per term) in all three cohorts.
- G, H
Protein abundance distribution of CSF (G) and brain (H) showing the abundances of AD‐modulated CSF proteins. Proteins of our 40‐protein signature are highlighted in red (elevated abundance in AD) and blue (elevated abundance in non‐AD). Proteins linked to glucose metabolism are highlighted in purple and labeled.
- A
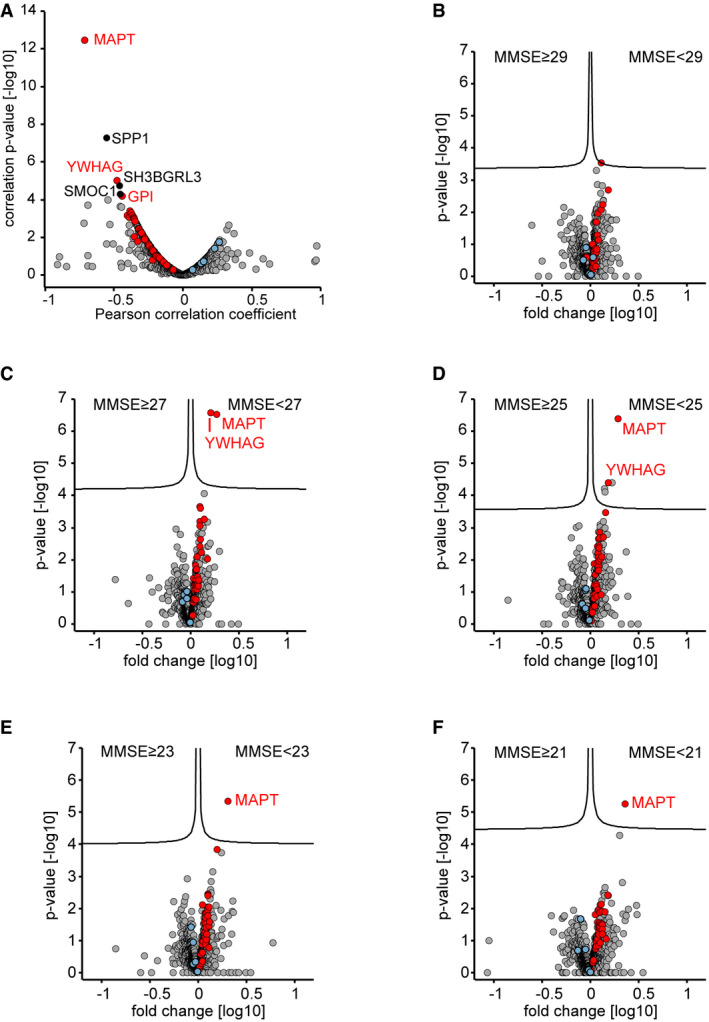
Correlation of proteins to the mini‐mental state examination (MMSE) scores in the Berlin cohort. Proteins with a correlation q‐value below 0.05 are labeled. Proteins of the 40‐protein signature are colored in red for proteins with increased abundance in AD CSF and in blue for proteins with increased abundance in non‐AD CSF.
- B–F
CSF proteome alterations between groups of lower MMSE scores (poor neuropsychological performance) and groups of higher MMSE score as separated by cutoffs of 29 (A), 27 (B), 25 (C), 23 (D), and 21 (E). Proteins of the 40‐protein signature are colored in red for proteins with increased abundance in AD CSF and in blue for proteins with increased abundance in non‐AD CSF.
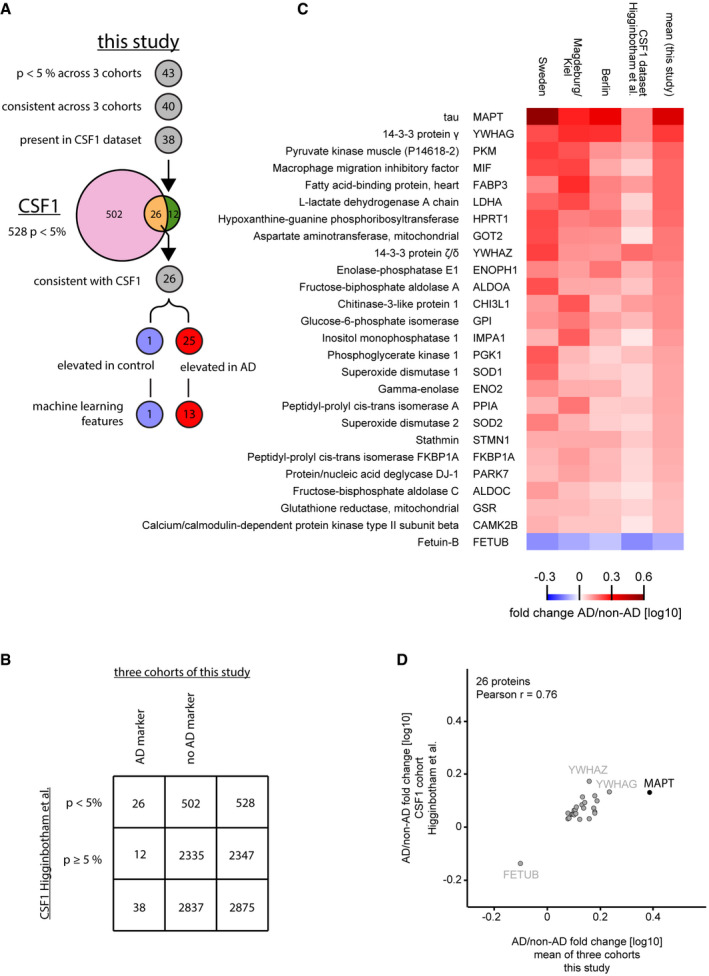
Overlap of proteins identified as AD‐regulated in the two studies. Out of the 43 proteins significantly (P < 0.05 across 3 cohorts) associated with AD or non‐AD in this study, 40 exhibited consistent difference across 3 cohorts (40‐protein signature). Of these, 38 were present in the CSF1 dataset of the Higginbotham et al study containing 2,875 proteins. In that dataset 528 proteins were significantly (P < 0.05) different between AD and control, 26 of the 38 matched proteins found as potential AD markers in this study overlapped. All 26 proteins had a consistent association with either AD or non‐AD CSF across the CSF1 dataset and this study, 25 thereof were elevated in AD CSF and one protein elevated in non‐AD CSF.
Contingency table for analysis of enrichment of our three‐cohort panel in the significantly AD vs. non‐AD altered proportion of the CSF1 dataset.
Heat map comparing the AD versus non‐AD fold changes for the 26 protein intersection of significant (P < 0.05) proteins between our study and the CSF1 dataset. Proteins were ranked based on the mean fold change of our study.
AD/non‐AD fold changes of significant (P < 0.05) and consistent proteins of this study correlate well with fold changes of the CSF1 cohort.

Decision tree to classify AD vs. non‐AD participants based on the protein levels of a core 26 protein set. Splits are indicated by black triangles. A tree with a minimum depth of six can correctly classify the participants by AD status.
Receiver operating characteristic (ROC) curve for the model based on XGBoost. The diagonal line indicates random performance. Blue line represents the mean performance of the model when trained on six stratified train—test splits (k‐fold). The gray areas represent the standard deviation of ROC values.
Confusion matrix indicating model performance when predicted on the test split of the cross‐validation. Overall accuracy is 0.85.
References
-
- Abbatiello SE, Mani DR, Schilling B, Maclean B, Zimmerman LJ, Feng X, Cusack MP, Sedransk N, Hall SC, Addona T et al (2013) Design, implementation and multisite evaluation of a system suitability protocol for the quantitative assessment of instrument performance in liquid chromatography‐multiple reaction monitoring‐MS (LC‐MRM‐MS). Mol Cell Proteomics 12: 2623–2639 - PMC - PubMed
-
- Aebersold R, Mann M (2016) Mass‐spectrometric exploration of proteome structure and function. Nature 537: 347–355 - PubMed
-
- Arevalo‐Rodriguez I, Smailagic N, Roque I Figuls M, Ciapponi A, Sanchez‐Perez E, Giannakou A, Pedraza OL, Bonfill Cosp X, Cullum S (2015) Mini‐Mental State Examination (MMSE) for the detection of Alzheimer's disease and other dementias in people with mild cognitive impairment (MCI). Cochrane Database Syst Rev CD010783 - PMC - PubMed
-
- Baldacci F, Lista S, Cavedo E, Bonuccelli U, Hampel H (2017) Diagnostic function of the neuroinflammatory biomarker YKL‐40 in Alzheimer's disease and other neurodegenerative diseases. Expert Rev Proteomics 14: 285–299 - PubMed
-
- Barthélemy NR, Fenaille F, Hirtz C, Sergeant N, Schraen‐Maschke S, Vialaret J, Buée L, Gabelle A, Junot C, Lehmann S et al (2016) Tau protein quantification in human cerebrospinal fluid by targeted mass spectrometry at high sequence coverage provides insights into its primary structure heterogeneity. J Proteome Res 15: 667–676 - PubMed
Publication types
MeSH terms
Substances
LinkOut - more resources
Full Text Sources
Other Literature Sources
Medical
Molecular Biology Databases
Miscellaneous
