. 2020 Aug 5;107(3):436-453.e12.
doi: 10.1016/j.neuron.2020.05.014. Epub 2020 Jun 1.

CD49f Is a Novel Marker of Functional and Reactive Human iPSC-Derived Astrocytes

Affiliations

CD49f Is a Novel Marker of Functional and Reactive Human iPSC-Derived Astrocytes

Lilianne Barbar et al. Neuron. .

Abstract

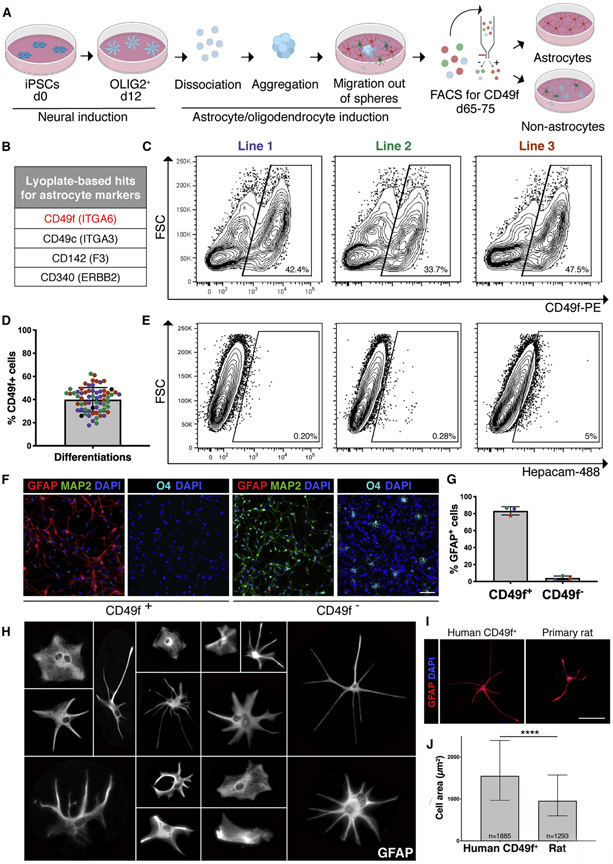
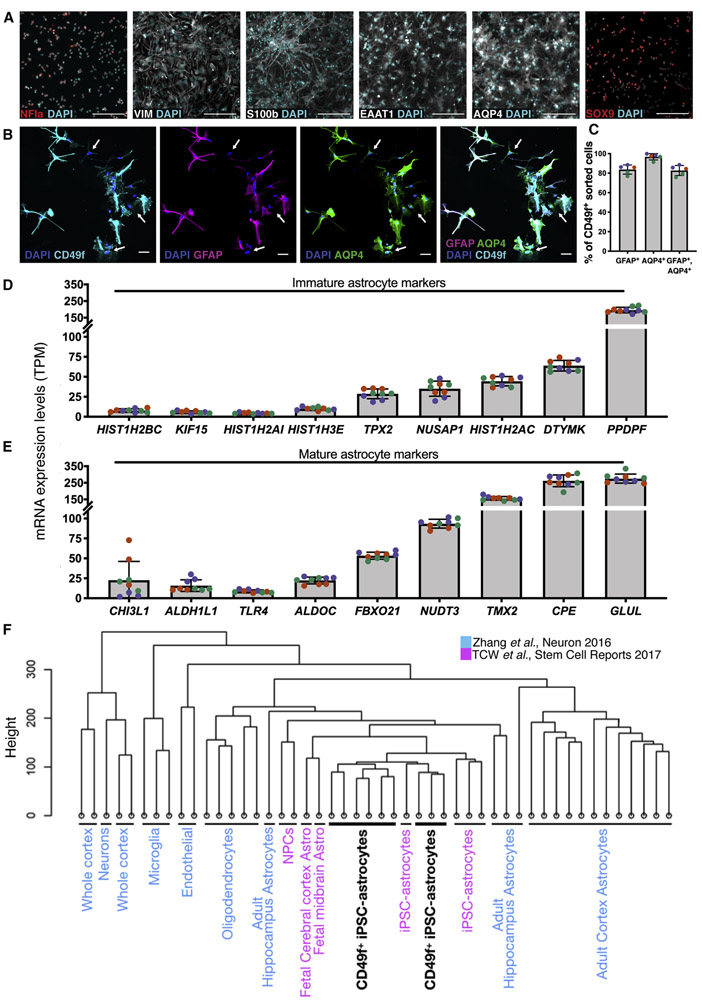
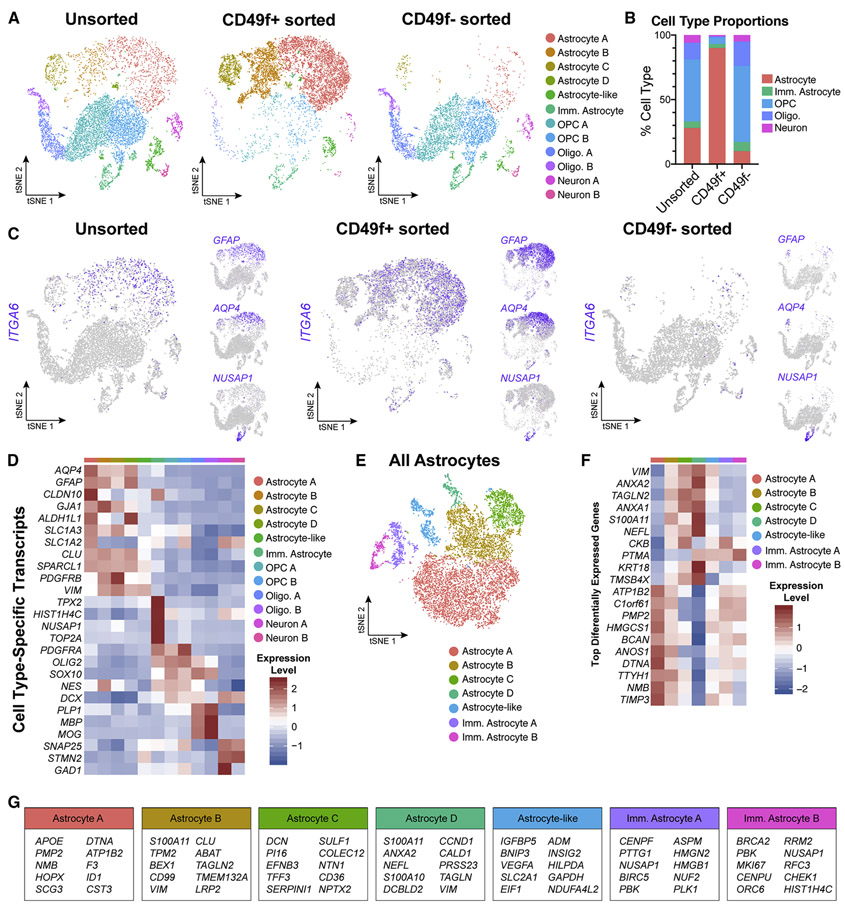
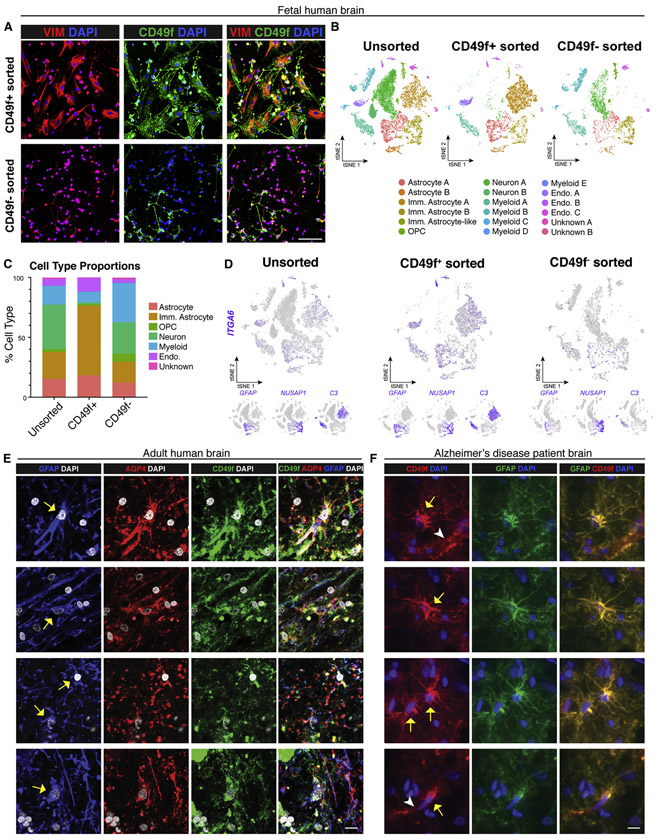
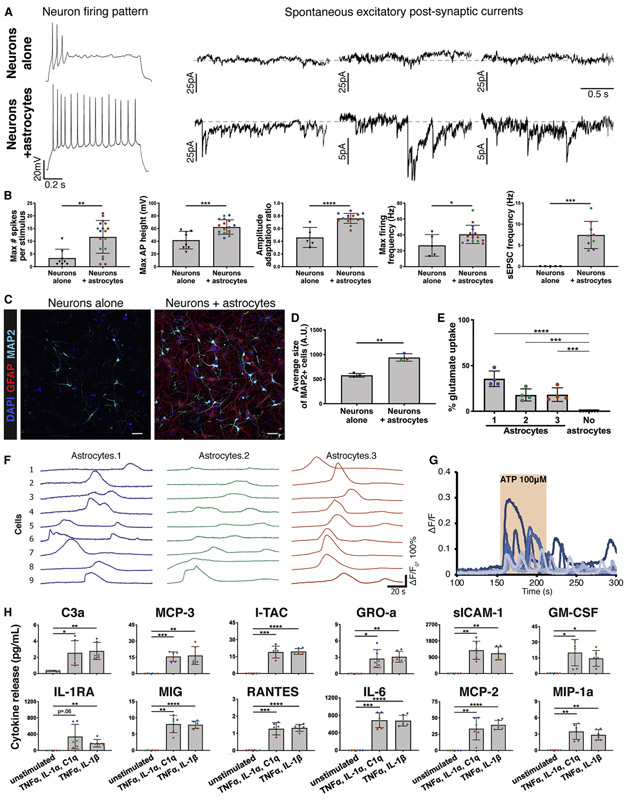
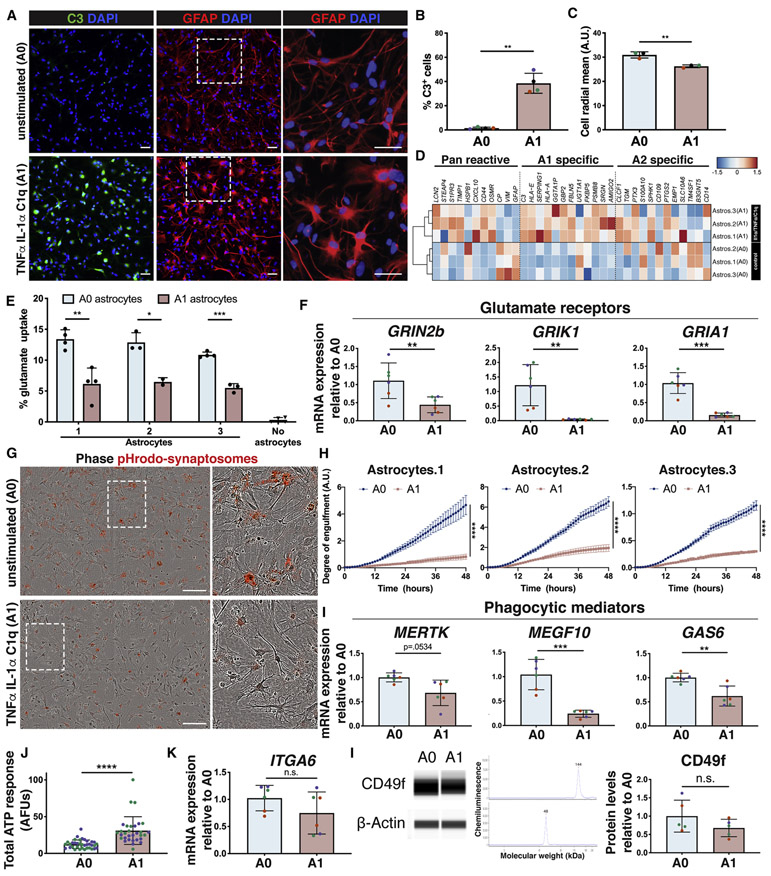
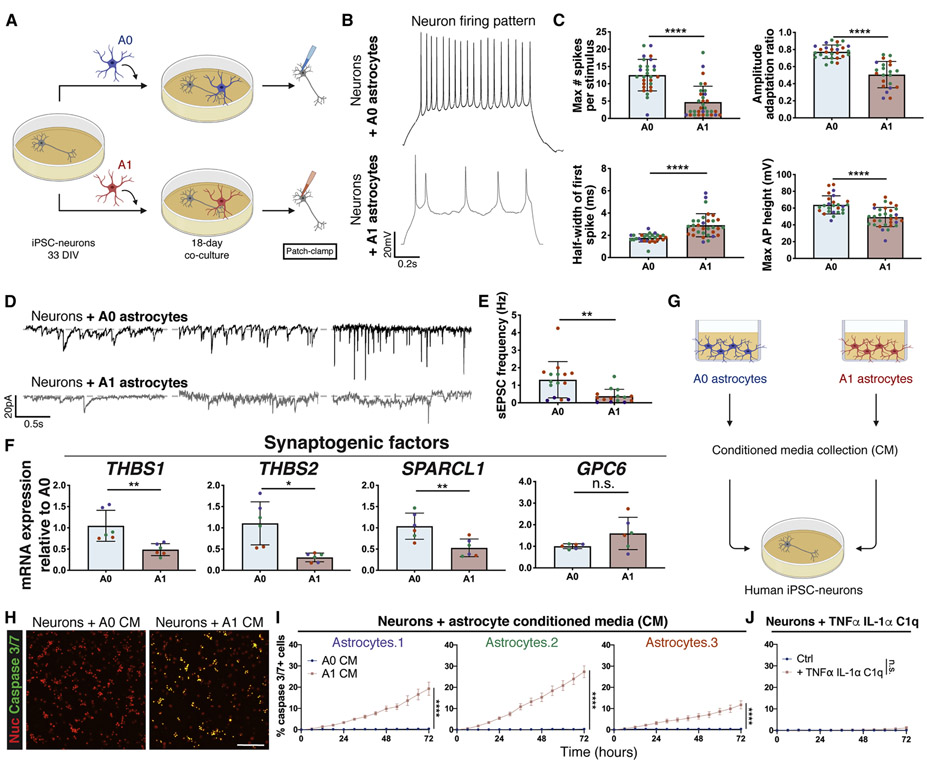
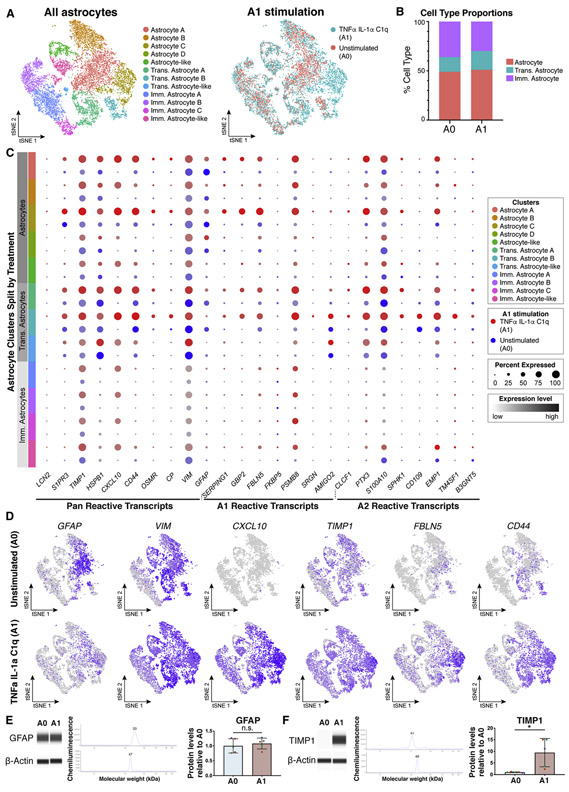
New methods for investigating human astrocytes are urgently needed, given their critical role in the central nervous system. Here we show that CD49f is a novel marker for human astrocytes, expressed in fetal and adult brains from healthy and diseased individuals. CD49f can be used to purify fetal astrocytes and human induced pluripotent stem cell (hiPSC)-derived astrocytes. We provide single-cell and bulk transcriptome analyses of CD49f+ hiPSC-astrocytes and demonstrate that they perform key astrocytic functions in vitro, including trophic support of neurons, glutamate uptake, and phagocytosis. Notably, CD49f+ hiPSC-astrocytes respond to inflammatory stimuli, acquiring an A1-like reactive state, in which they display impaired phagocytosis and glutamate uptake and fail to support neuronal maturation. Most importantly, we show that conditioned medium from human reactive A1-like astrocytes is toxic to human and rodent neurons. CD49f+ hiPSC-astrocytes are thus a valuable resource for investigating human astrocyte function and dysfunction in health and disease.

Keywords: A1 reactive astrocytes; CD49f; FACS purification; astrocytes; induced pluripotent stem cells; neurodegeneration; neurotoxicity.


Conflict of interest statement

Declaration of Interests S.A.L. is an academic founder of AstronauTx Ltd. NYSCF. U.S. patent pending.

Figures

Figure 1:
Figure 1:. CD49f surface antigen purifies hiPSC-derived astrocytes
See also Figures S1 and S2. a) Schematic of hiPSC-astrocyte differentiation protocol depicting the major steps leading to the CD49f sort. b) Top four hits for astrocyte markers identified from the Lyoplate screen. c) Representative flow-cytometry contour plots (with outliers shown) of the CD49f sort of hiPSC-cells generated from 3 hiPSC lines from three individuals using the astrocyte differentiation protocol in a). d) Bar chart with individual data points plotted as circles, where colors represent 3 hiPSC lines, displays the consistent proportion of CD49f+ cells obtained from independent differentiations for each line. Error bars show mean ± standard deviation (n=65). At least 5 independent differentiations per line were performed. e) Representative contour plots (with outliers shown) of the EpCAM sort of hiPSC-cells generated from 3 lines. f) Representative immunofluorescence images of CD49f+ and CD49f cells 24 hours post-sort showing GFAP+ astrocytes (red), MAP2+ neurons (green), O4+ immature oligodendrocytes (cyan), and total DAPI cells (blue). Scale bar, 100μm. g) Vast majority of sorted CD49f+ cells are also GFAP+, while almost no CD49f cells are GFAP+ cells. Colored dots correspond to 3 different lines. Error bars show mean ± standard deviation (n=3 independent lines). h) Representative images of individual magnified CD49f+ astrocytes cultured at low density and stained with GFAP, showing their morphological heterogeneity. Each cell was cropped and placed in the image. i) Representative immunofluorescence images of hiPSC-derived CD49f+ astrocytes and primary rat astrocytes stained with GFAP (red) and DAPI (blue) show human cells are larger in size. Scale bar, 100μm. j) Bar graph showing the median of the cell area in μm2 of GFAP+ hiPSC-derived CD49f+ astrocytes (n= 1885 cells from 3 lines with 1-2 replicates each) is significantly greater than that of primary rat astrocytes (n=1293 cells from 6 replicates). Error bars represent the interquartile range. p-value was calculated using a two-tailed, unpaired t-test.
Figure 2:
Figure 2:. Immunofluorescence and transcription profiling of CD49f+ hiPSC-derived astrocytes confirm expression of canonical markers
See also Figure S3. a) Immunofluorescence images of CD49f+ astrocytes showing expression of astrocyte markers in red or white, and total DAPI cells (cyan). Scale bar, 200μm. b) Immunofluorescence images of CD49f+ astrocytes showing CD49f+ (cyan), GFAP+ (red), AQP4+ (green) and total DAPI cells (blue). White arrows indicate cells that are CD49f+/AQP4+/GFAP. Scale bar, 50μm. c) Percentages of CD49f+ cells across different CD49f+ hiPSC-astrocyte lines that are also GFAP+, AQP4+, and triple positive for GFAP, AQP4, and CD49f. Colored dots correspond to 3 different lines. Error bars show mean ± standard deviation (n=5, 1-2 technical replicates per line). d) RNA-Seq expression levels of immature astrocyte markers in human CD49f+ astrocytes, expressed in transcripts per million (TPM). Colored dots correspond to 3 different lines. Error bars show mean ± standard deviation (n=9, 3 replicates per line). e) mRNA expression levels of mature astrocyte markers in human CD49f+ astrocytes, expressed in transcripts per million (TPM). Colors and error bars are as in d). f) Hierarchical clustering of RNA-Seq data shows that CD49f+ hiPSC-astrocytes (black) closely resemble primary and iPSC-derived astrocytes from independent studies and are distinct from other brain cell types (GEO: GSE73721 in blue; GEO: GSE97904 in pink). Analysis is based on transcriptome-wide expression. CD49f+ samples consist of 3 different lines in 3 replicates each.
Figure 3:
Figure 3:. Single-cell transcriptome data confirms that CD49f+ sorting strategy from heterogeneous hiPSC-derived cultures enriches for mature astrocytes
All data from one control line (line 3, n=1). See also Figures S4, S5, S6, and Supplemental Table 1. a) tSNE plots of single-cell RNA-Seq data from unsorted (left, n = 7,744), CD49f+ (middle, n = 9,047), and CD49f sorted (right, n = 5,057) cells. In total, 12 clusters were identified. b) Quantification of cell type proportions from unsorted, CD49f+, and CD49f sorted cells based on tSNE analysis. CD49f+ sorted cells are mostly astrocytes. c) tSNE feature plots of CD49f (ITGA6), mature astrocyte (GFAP, AQP4), and immature astrocyte (NUSAP1) transcripts from unsorted, CD49f+ sorted, and CD49f sorted cells, showing that CD49f+ cells express primarily mature astrocyte markers. d) Heatmap of cell type–specific transcript expression across identified clusters. e) tSNE plot of all astrocytes from unsorted, CD49f+, and CD49f sorted cells (n = 12,061 astrocytes). After subsetting and reintegrating only astrocytes from the initial clustering scheme, we identified 2 immature and 4 mature astrocyte clusters, and 1 astrocyte-like cluster. f) Heatmap of top differentially expressed genes identified across all astrocyte-related clusters. g) Top 10 differentially expressed genes for each astrocyte-related cluster. Abbreviations: Imm.=immature; Oligo=oligodendrocyte; OPC=oligodendrocyte progenitor cell.
Figure 4:
Figure 4:. CD49f-sort from human fetal brain enriches for astrocytes, and CD49f is localized in astrocytes in slides from human adult brains
See also Figure S7 and Supplemental Table 1. a) Representative immunofluorescence images showing vimentin (red), CD49f (green), and DAPI (blue) in CD49f+ and CD49f sorted cells from human fetal brain tissue. Scale bar, 100μm. b) tSNE plots of single-cell RNA-Seq data from unsorted (left, n = 11,817), CD49f+ (middle, n = 6,069), and CD49f sorted (right, n = 4,409) cells from fetal brain tissue. In total, 18 clusters were identified. All data are from an 18-week-old human fetus (n=1). c) Quantification of cell type proportions from unsorted, CD49f+, and CD49f sorted cells from fetal brain tissue. CD49f+ cells are highly enriched in astrocytes and immature astrocytes. d) tSNE feature plots highlighting in purple cells that express CD49f (ITGA6), mature astrocyte (GFAP), and immature astrocyte (NUSAP1, C3) transcripts from unsorted, CD49f+, and CD49f sorted cells from fetal brain tissue. e) Representative immunofluorescence images showing GFAP+ (blue), AQP4+ (red), and CD49f+ (green) cells with DAPI nuclei (grey) in cryosections from the subventricular zone of an adult brain from healthy individual. Yellow arrows indicate cells that are CD49f+, AQP4+, and GFAP+. Scale bar, 10μm. f) Representative immunofluorescence images showing CD49f+ (red) and GFAP+ (green) cells with DAPI nuclei (blue) in cryosections from the prefrontal cortex of an Alzheimer’s disease patient. Yellow arrows indicate cells that are CD49f+ and GFAP+. White arrowheads indicate CD49f+ endothelial cells. Scale bar, 10μm. Abbreviations: Endo.=endothelial cell; Imm.=immature; OPC=oligodendrocyte progenitor cell.
Figure 5:
Figure 5:. CD49f+ hiPSC-derived astrocytes provide neuronal support and exhibit other astrocytic functions in vitro
See also Figure S8. a) Representative recordings of firing patterns and spontaneous excitatory post-synaptic currents (sEPSCs) measured in hiPSC-neurons at day 50 when cultured alone, or with CD49f+ hiPSC-astrocytes during days 33-50. Neurons co-cultured with astrocytes exhibited more mature firing patterns and a greater number of sEPSCs. b) CD49f+ hiPSC-astrocytes enhance electrophysiological properties of hiPSC-neurons in co-culture. Bar graphs show the maximum number of evoked spikes per 1 second stimulus (n=8/18), the maximum firing frequency in hertz (Hz) (n=5/15), the amplitude adaptation ratio between first and last action potential (n=5/15), the maximum action potential height (mV) (n=8/17), and the frequency of spontaneous excitatory post-synaptic currents (Hz) (n=5/9) in hiPSC-neurons at day 50 when cultured alone vs. with astrocytes during days 33-50. Colored dots correspond to 3 different lines. Each dot represents an independent cell. n=neurons alone/neurons co-cultured with astrocytes. Error bars show mean ± standard deviation. p-values were calculated using a two-tailed, unpaired t-test. c) Representative immunofluorescence images showing MAP2+ neurons (cyan), GFAP+ astrocytes (red), and DAPI nuclei in hiPSC-derived neurons at 40 days in vitro cultured alone or with CD49f+ hiPSC-astrocytes for one week. Scale bar, 50μm. d) Average size of MAP2+ cells. Colored dots correspond to 3 different CD49f+ hiPSC-astrocyte lines. Error bars show mean ± standard deviation (n=3 technical replicates). p-values were calculated using a two-tailed, unpaired t-test. e) CD49f+ astrocytes take up glutamate. Bar graphs show percent of glutamate taken up by CD49f+ hiPSC-astrocytes after incubation with 100 μM glutamate for 3 hours, compared to wells without cells (media only). Colored dots correspond to 3 different astrocyte lines. Error bars show mean ± standard deviation (n=4 technical replicates). p-values were calculated using a one-way ANOVA with Dunnett’s correction for multiple comparisons. f) hiPSC-astrocytes show spontaneous Ca2+ transients. Nine representative traces of spontaneous [Ca2+]i transients from 3 independent CD49f+ hiPSC-astrocyte lines loaded with the Ca2+ indicator Rhod-3/AM are shown. Each line is represented by a different color (lines 1,2,3). g) CD49f+ hiPSC-astrocytes respond to ATP. Representative traces of [Ca2+]i transients from nine astrocytes from one iPSC line loaded with the Ca2+ indicator Rhod-3/AM following 100 μM ATP application. h) CD49f+ hiPSC-astrocytes secrete proinflammatory cytokines when stimulated for 24 hours with TNFα, IL-1α, and C1q, or TNFα and IL-1β. Bar charts with individual data points plotted as dots show concentration of cytokines secreted in the supernatant of CD49f+ astrocytes with and without stimulation. Concentrations are expressed in pg/ml and normalized to 1,000 cells. Colored dots correspond to 3 lines (n=6, 2 technical replicates per line). Error bars show mean ± standard deviation. p-values were calculated using a one-way ANOVA with Dunnett’s correction for multiple comparisons.
Figure 6:
Figure 6:. CD49f+ hiPSC-derived astrocytes astrocytes can be stimulated in vitro to take on an A1-like reactive state that loses key astrocytic functions
See also Figure S9. a) Representative immunofluorescence images showing the reactive marker C3 (green) in CD49f+ astrocytes upon stimulation with TNFα, IL-1α, and C1q. Cells are also stained for GFAP (red) and DAPI (blue). White dashed boxes indicate the areas of the magnified images on the right to highlight changes in morphology. Scale bar, 50μm. b) Percentage of C3+ cells in unstimulated vs. stimulated CD49f+ astrocytes as in a). Colored dots correspond to 3 different lines. Error bars show mean ± standard deviation (n=4 independent lines). p-values were calculated using a two-tailed, paired t-test. c) Cell radial mean, in arbitrary unit (A.U.) across different lines in unstimulated vs. stimulated CD49f+ astrocytes, depicting the shift in morphology between the two conditions. Colored dots correspond to 3 different lines. Error bars show mean ± standard deviation (n=3 independent lines). p-values were calculated using a two-tailed, paired t-test. d) CD49f+ hiPSC-derived astrocytes upregulate the A1 reactive transcripts previously identified in mouse astrocytes. Heat map shows expression levels of reactive transcripts (pan-reactive, A1 astrocytes or A2 astrocytes) in A1-like vs. unstimulated (A0) CD49f+ hiPSC-astrocytes. e) Glutamate uptake is reduced in CD49f+ A1-like astrocytes. Percent of glutamate taken up by A0 vs. A1 astrocytes and compared to wells without cells (media only). Error bars show mean ± standard deviation (n=2-4 technical replicates). p-values were calculated using multiple t-tests with Holm-Sidak’s correction for multiple comparisons. f) Relative mRNA expression of genes encoding glutamate receptors (GRIN2b, GRIK1, GRIA1), quantified via qPCR analysis in two independent experiments, is decreased in CD49f+ stimulated astrocytes (A1) vs. unstimulated (A0). Colored dots correspond to 3 lines. Error bars show mean ± standard deviation (n=6, 2 replicates per line). p-values were calculated using a two-tailed, paired t-test. g) Representative images of A0 vs. A1 astrocytes engulfing pHrodo-synaptosomes (red), showing reduced phagocytic capacity in A1 astrocytes. White dashed boxes indicate the areas of the magnified images on the right. Scale bar, 200μm. h) Time course analysis and quantification of A0 vs. reactive A1 astrocytes engulfing pHrodo-synaptosomes. The average degree of engulfment (normalized to confluence) with standard error of the mean (n=9-12 replicates per line), indicates a reduced phagocytic capacity in A1 astrocytes. p-values were calculated using a two-way ANOVA. i) Relative mRNA expression of genes encoding phagocytic receptors (MERTK, MEGF10) and bridging molecule GAS6, quantified via qPCR analysis, is decreased in CD49f+ A1 vs. A0. Colored dots correspond to 3 lines. Error bars show mean ± standard deviation (n=6, 2 replicates per line). p-values were calculated using a two-tailed, paired t-test. j) Human A1-like astrocytes have a stronger ATP response than unstimulated astrocytes. Area under the curve of ΔF/F traces for one minute following 100μM ATP application of hiPSC-derived CD49f+ A0 (n=36 cells) and A1 (n=31 cells) astrocytes loaded with the Ca2+ indicator Rhod-3/AM. Unit is in arbitrary fluorescence units (AFUs). Colored dots correspond to 2 lines. Error bars show mean ± standard deviation. p-values were calculated using a two-tailed, unpaired t-test. k) Relative mRNA expression of ITGA6, quantified via qPCR analysis does not significantly differ between A0 vs. A1 astrocytes in two independent experiments. Colored dots correspond to 3 different lines. Error bars show mean ± standard deviation (n=6, 2 replicates per line). p-values were calculated using a two-tailed, paired t-test. l) CD49f protein levels do not significantly differ between A0 vs. A1 astrocytes. Representative western bands and electropherograms for CD49f and b-actin, and quantification of protein levels for CD49f in A0 and A1 astrocytes, normalized to b-actin. Error bars show mean ± standard deviation (n=5, 1-2 replicates per line). Colored dots correspond to 3 different lines. p-values were calculated using a two-tailed, paired t-test.
Figure 7:
Figure 7:. A1-like reactive CD49f+ hiPSC-derived astrocytes impair neuronal maturation and connectivity and are neurotoxic
See also Figure S10. a) Schematic of neuron co-culture experiment with A0 and A1 hiPSC-astrocytes. b) Representative recordings of firing patterns measured in hiPSC-neurons at day 51 when cultured with A0 or A1 astrocytes during days 33-51. Neurons co-cultured with A1 astrocytes exhibited less mature firing patterns. c) A1 astrocytes provide markedly lower enhancements of neuronal electrophysiological properties in co-culture than A0 astrocytes. Bar graphs with individual data points plotted show the maximum number of evoked spikes per 1s stimulus (n=28/32), the half-width of the first spike (ms) (n=28/32), the amplitude adaptation ratio between first and last action potential (n=27/22), and the maximum action potential height (mV) (n=26/32) in hiPSC-neurons at day 51 when cultured with A0 or A1 astrocytes during days 33-51. Colored dots correspond to 3 different lines. Each dot represents an independent cell from which we recorded. n=neurons co-cultured with A0 astrocytes/neurons co-cultured with A1 astrocytes. Error bars show mean ± standard deviation. p-values were calculated using a two-tailed, unpaired t-test. d) Representative recordings of spontaneous excitatory post-synaptic currents (sEPSCs) measured in hiPSC-neurons at day 51 when cultured with A0 or A1 astrocytes during days 33-51. Neurons co-cultured with A1 astrocytes exhibited a smaller number of sEPSCs. Representative traces of sEPSCs are each from a different cell. e) Frequency of spontaneous excitatory post-synaptic currents (Hz) (n=15 co-cultured with A0 astrocytes;15 co-cultured with A1 astrocytes) in hiPSC-neurons at day 51 when cultured with A0 or A1-like astrocytes during days 33-51. Colored dots correspond to 3 different lines. Each dot represents an independent cell from which we recorded. Error bars show mean ± standard deviation. p-values were calculated using a two-tailed, unpaired t-test. f) Relative mRNA expression of genes encoding synaptogenic factors, quantified via qPCR analysis, is decreased in A1 vs. A0 astrocytes. Colored dots correspond to 3 different lines. Error bars show mean ± standard deviation (n=6, 2 replicates per line). p-values were calculated using a two-tailed, paired t-test. g) Schematic of A0 vs. A1 astrocyte conditioned media experiment on hiPSC-neurons. h) Representative images of neurons treated with A0 or A1 astrocyte conditioned media (CM) for 3 days, subjected to a caspase 3/7 apoptosis assay (green) and cell nuclei (red); neurons exposed to A1 CM show increased apoptosis. Scale bar, 100μm. i) Time course apoptosis analysis and quantification of the percentage of caspase 3/7+ neurons during treatment with A0 or A1 astrocyte conditioned media (CM). Error bars represent the standard error of the mean (n=12-24 replicates per line), indicating a neurotoxic effect of A1 CM on neurons. p-values were calculated using a two-way ANOVA. j) Time course apoptosis analysis and quantification of the percentage of caspase 3/7+ apoptotic neurons during stimulation with TNFα, IL-1α, and C1q, demonstrating no direct effects of the cytokine cocktail on neuronal apoptosis. Error bars represent the standard error of the mean (n=12 replicates). p-values were calculated using a two-way ANOVA.
Figure 8:
Figure 8:. Maturation state affects CD49f+ hiPSC-derived astrocytes response to stimulation with TNFα, IL1α, and C1q
See also Supplemental Table 1. a) tSNE plots of single-cell RNA-Seq data from unstimulated (A0, n = 5,881) and TNFα, IL-1α, and C1q stimulated (A1, n = 6,701) astrocytes, shown by cluster (left) and by treatment type (right). Data from two iPSC lines (lines 1 and 3, n = 2). b) Quantification of cell type proportions from unstimulated (A0) and A1 astrocytes. c) Dot plot of pan, A1-specific, and A2-specific astrocyte transcripts in A0 (blue) and A1 astrocytes (red), highlighting a stronger gene expression response in mature astrocytes. Dot size represents the percentage of cells that express a transcript, and color intensity represents the expression level of a transcript. d) tSNE feature plots of reactive astrocyte transcripts. e) GFAP protein levels are stable in A0 and A1 CD49f+ hiPSC-astrocytes. Western blots for GFAP and b-actin, and quantification of protein levels, normalized to b-actin. Error bars show mean ± standard deviation (n=5, 1-2 replicates per line). Colored dots correspond to 3 different lines. p-values were calculated using a two-tailed, paired t-test. f) TIMP1 level increases in CD49f+ hiPSC-astrocytes stimulated to A1. Western blots for TIMP1 and b-actin, and protein quantification, normalized to b-actin. Error bars show mean ± standard deviation (n=5, 1-2 replicates per line). Colored dots correspond to 3 different lines. p-values were calculated using a two-tailed, paired t-test. Abbreviations: Imm.=immature; Trans.=transitioning.

References

    1. Bais Abha S, and Kostka Dennis. 2019. “Scds: Computational Annotation of Doublets in Single Cell RNA Sequencing Data.” Preprint. Bioinformatics. 10.1101/564021. - DOI - PMC - PubMed
    1. Banker GA 1980. “Trophic Interactions between Astroglial Cells and Hippocampal Neurons in Culture.” Science (New York, N.Y.) 209 (4458): 809–10. 10.1126/science.7403847. - DOI - PubMed
    1. Bansal R, Warrington AE, Gard AL, Ranscht B, and Pfeiffer SE. 1989. “Multiple and Novel Specificities of Monoclonal Antibodies O1, O4, and R-MAb Used in the Analysis of Oligodendrocyte Development.” Journal of Neuroscience Research 24 (4): 548–57. 10.1002/jnr.490240413. - DOI - PubMed
    1. Bayraktar Omer Ali, Fuentealba Luis C., Alvarez-Buylla Arturo, and Rowitch David H.. 2014. “Astrocyte Development and Heterogeneity.” Cold Spring Harbor Perspectives in Biology 7 (1): a020362. 10.1101/cshperspect.a020362. - DOI - PMC - PubMed
    1. Booth Heather D. E., Hirst Warren D., and Wade-Martins Richard. 2017. “The Role of Astrocyte Dysfunction in Parkinson’s Disease Pathogenesis.” Trends in Neurosciences 40 (6): 358–70. 10.1016/j.tins.2017.04.001. - DOI - PMC - PubMed

Publication types

LinkOut - more resources