. 2021 Jan;147(1):368-382.
doi: 10.1016/j.jaci.2020.05.022. Epub 2020 May 30.

CD4+ and CD8+ cytotoxic T lymphocytes may induce mesenchymal cell apoptosis in IgG4-related disease

Affiliations

CD4+ and CD8+ cytotoxic T lymphocytes may induce mesenchymal cell apoptosis in IgG4-related disease

Cory A Perugino et al. J Allergy Clin Immunol. 2021 Jan.

Abstract

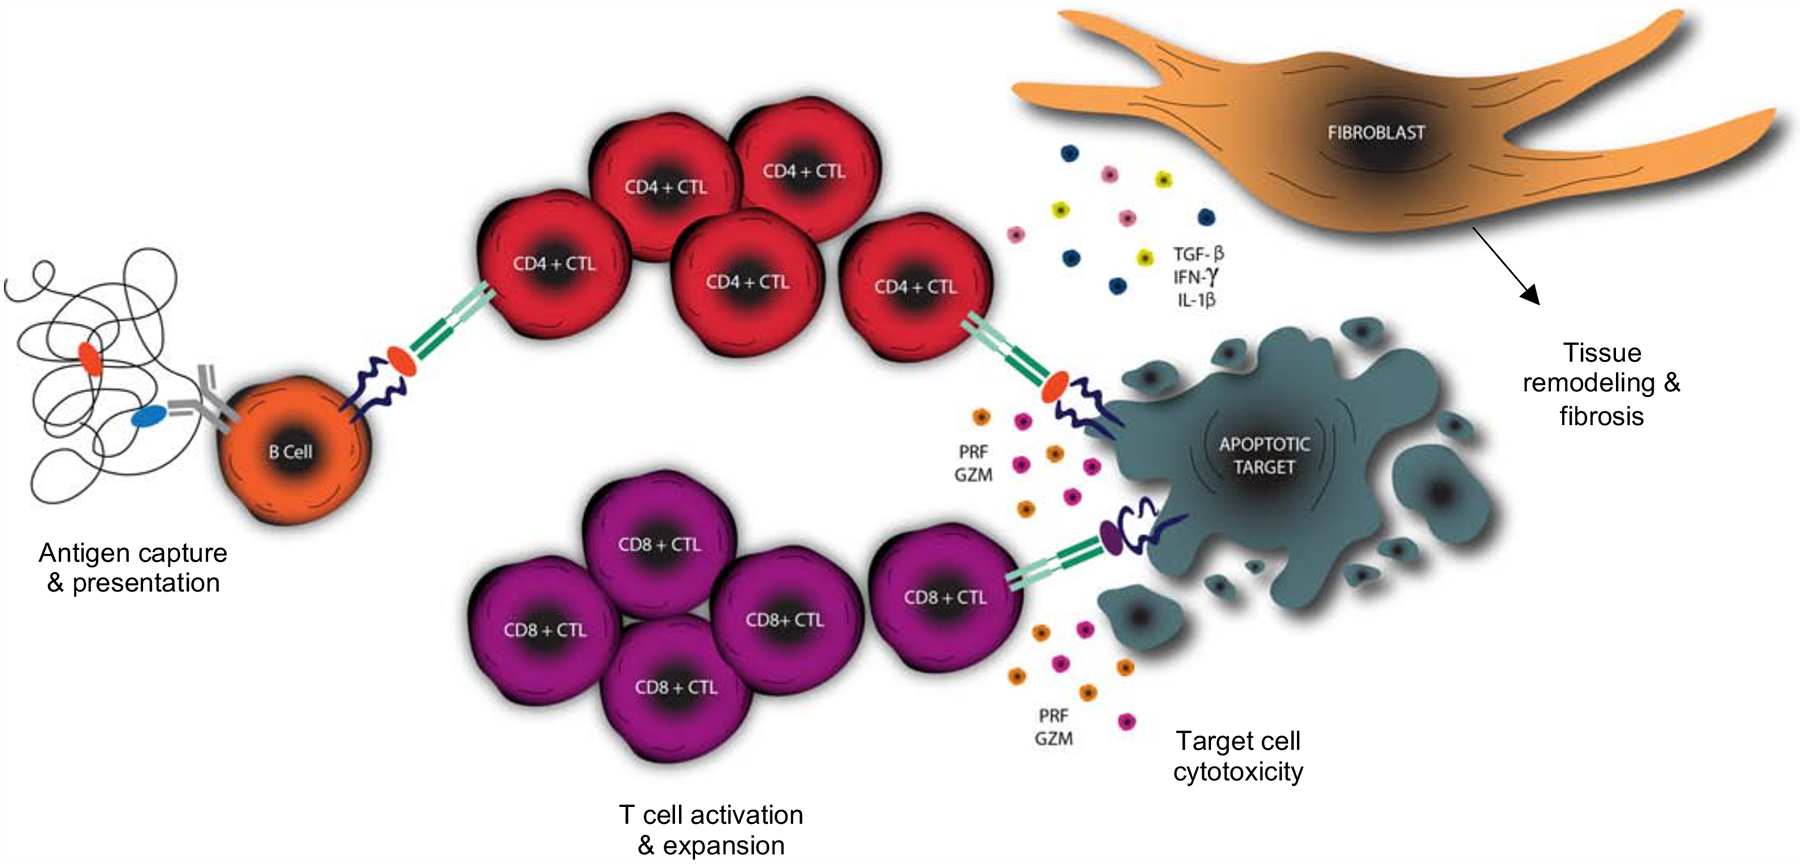
Background: IgG4-related disease (IgG4-RD) is an immune-mediated fibrotic disorder that has been linked to CD4+ cytotoxic T lymphocytes (CD4+CTLs). The effector phenotype of CD4+CTLs and the relevance of both CD8+ cytotoxic T lymphocytes (CD8+CTLs) and apoptotic cell death remain undefined in IgG4-RD.

Objective: We sought to define CD4+CTL heterogeneity, characterize the CD8+CTL response in the blood and in lesions, and determine whether enhanced apoptosis may contribute to the pathogenesis of IgG4-RD.

Methods: Blood analyses were undertaken using flow cytometry, cell sorting, transcriptomic analyses at the population and single-cell levels, and next-generation sequencing for the TCR repertoire. Tissues were interrogated using multicolor immunofluorescence. Results were correlated with clinical data.

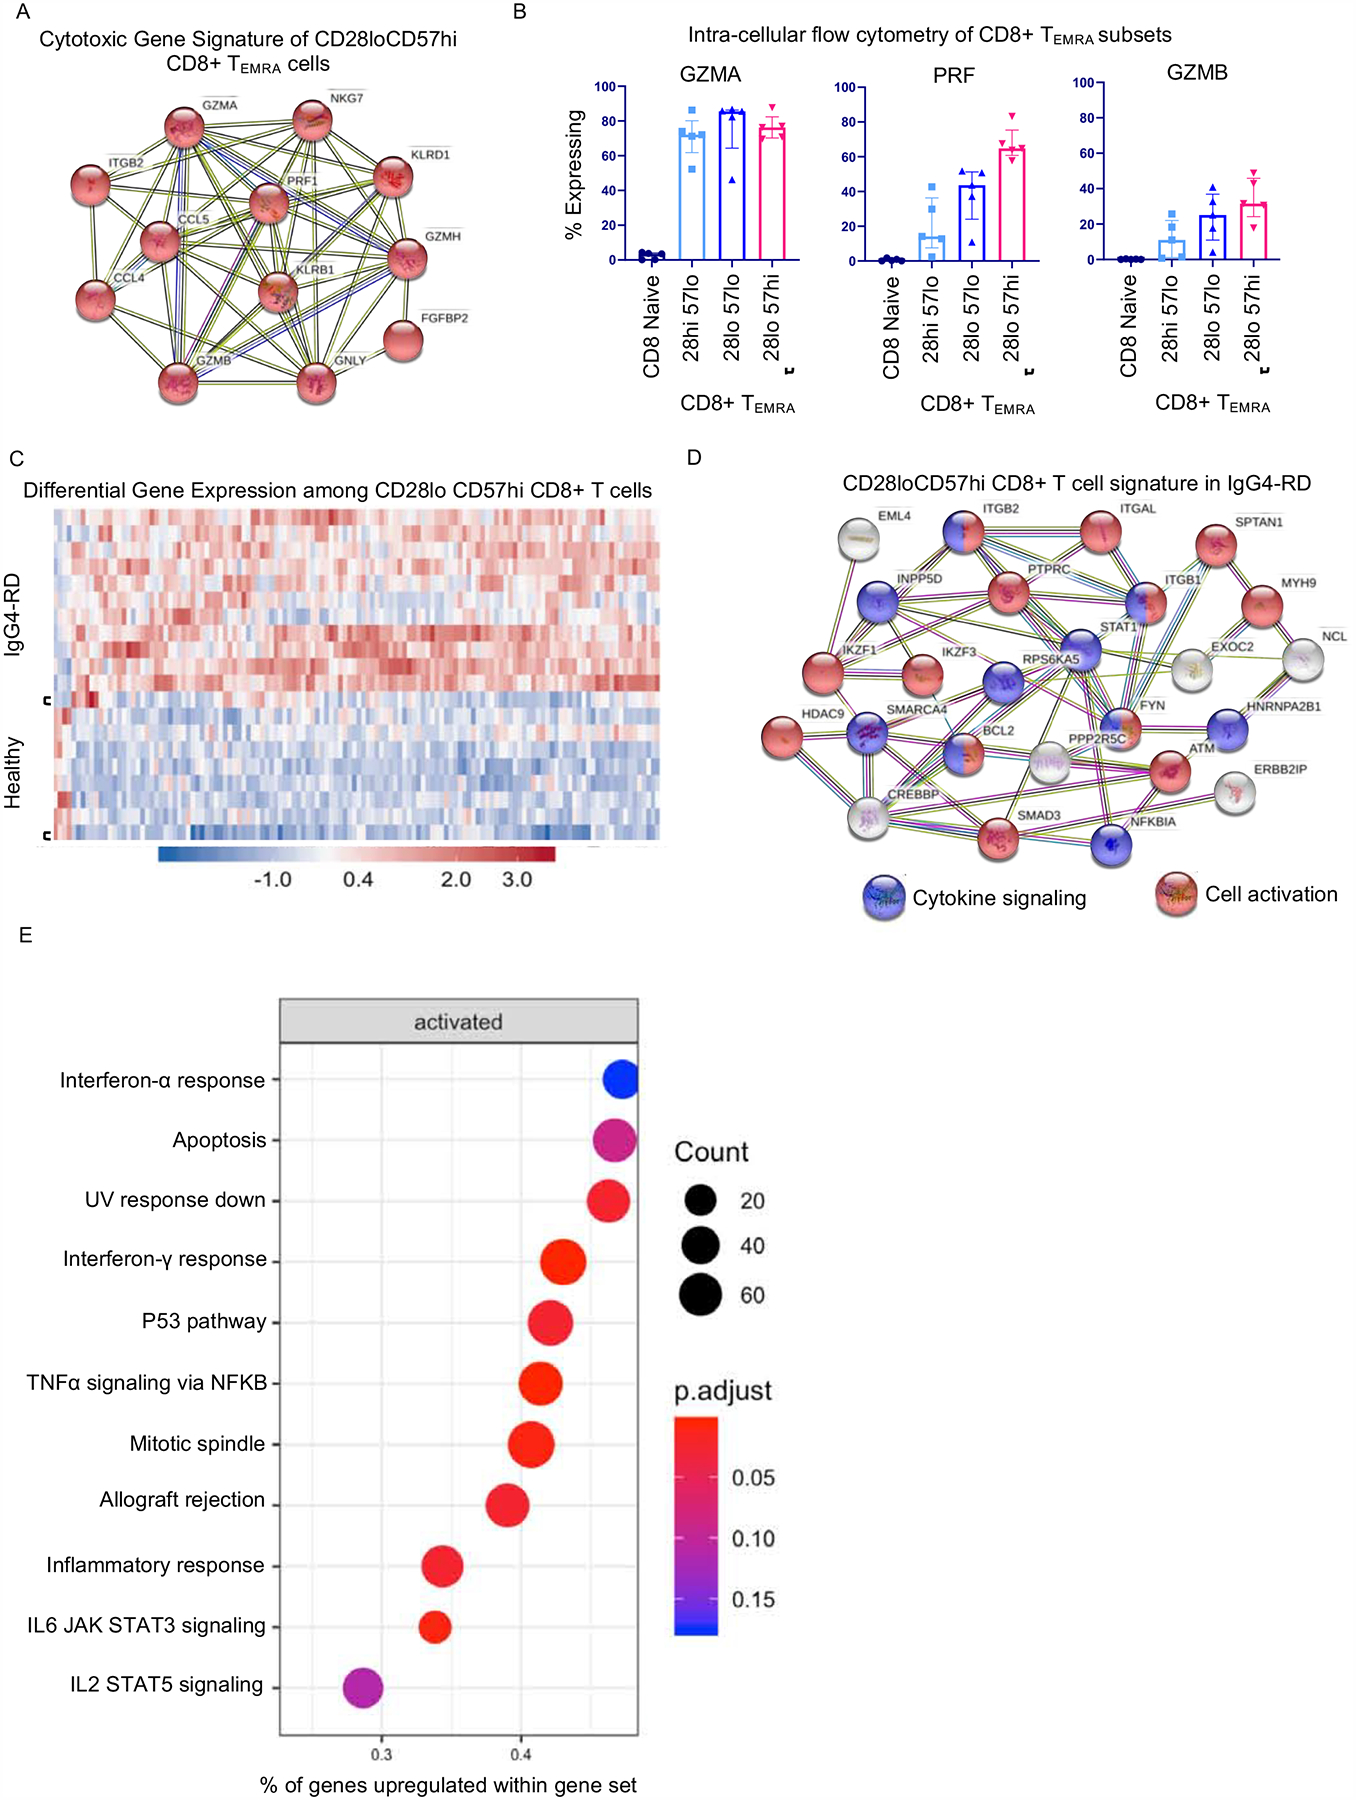
Results: We establish that among circulating CD4+CTLs in IgG4-RD, CD27loCD28loCD57hi cells are the dominant effector subset, exhibit marked clonal expansion, and differentially express genes relevant to cytotoxicity, activation, and enhanced metabolism. We also observed prominent infiltration of granzyme A-expressing CD8+CTLs in disease tissues and clonal expansion in the blood of effector/memory CD8+ T cells with an activated and cytotoxic phenotype. Tissue studies revealed an abundance of cells undergoing apoptotic cell death disproportionately involving nonimmune, nonendothelial cells of mesenchymal origin. Apoptotic cells showed significant upregulation of HLA-DR.

Conclusions: CD4+CTLs and CD8+CTLs may induce apoptotic cell death in tissues of patients with IgG4-RD with preferential targeting of nonendothelial, nonimmune cells of mesenchymal origin.

Keywords: CD28(lo); CD28(null); CD4(+)CTL; CD8(+)CTL; IgG(4)-RD; apoptosis.


Conflict of interest statement

Disclosure statement: The authors have declared that no conflicts of interest exist.

Figures

Figure 1.
Figure 1.. CD27lo CD28lo CD57hi defines an effector subset of CD4+CTLs.
A) tSNE analysis reveals heterogeneity within the CD4+ CCR7lo CD45RAlo SLAMF7+ population from the blood of a representative IgG4-RD patient. B) Representative flow contour plot displaying distinct subsets of SLAMF7+ CD4+ TEM cells in the blood of a representative IgG4-RD patient. C) Intracellular flow cytometry for granzyme A (GZMA) and perforin (PRF) showing the greatest frequency of cytotoxic protein expression among CD28loCD57hi CD4+SLAMF7+ T cells compared to other subsets. CCR7− CD45RA+ CD28loCD57hi CD8+ SLAMF7+ T cells were used to represent CD8+CTLs. Displayed are medians (bars) and inter-quartile range (error bars). D) Monocle analysis of single cell sequencing data of SLAMF7+ CD4+ TEM cell subsets suggesting a differentiation trajectory.
Figure 2.
Figure 2.. CD28lo CD57hi CD4+CTLs are clonally-expanded in IgG4-RD and correlate with a more severe clinical phenotype.
A) Stacked bar chart displays the frequency of the top 10 clones within each CD4+CTL subset. CD28lo subsets show marked clonal expansion with the top clones dominating the repertoire. B) Venn diagram showing % overlap of top 10 clones from each CD4+SLAMF7+ T cell subset with the greatest overlap observed between the CD28lo subsets. C) Dot plot of flow cytometry data displaying significant accumulation of CD28loCD57hi CD4+ SLAMF7+ T cells in the blood of IgG4-RD patients (n=48) compared to non-fibrotic sarcoidosis (n=19) and age-matched healthy donors (n=20). Bars represent medians and inter-quartile ranges. p-values calculated by ANOVA with Kruskal-Wallis test to control for multiple comparisons. D) Forrest plot displaying the odds of observing an expanded CD28loCD57hi SLAMF7+ CD4+ TEM cell population in the blood based on clinical parameters of disease severity. p-values calculated by logistic regression and are unadjusted for multiple comparisons.
Figure 3.
Figure 3.. CD28lo CD57hi CD4+CTLs display gene signatures of cytotoxicity, activation and tissue migration.
A) Heat map displaying 7,392 differentially expressed transcripts between CD28loCD57hi SLAMF7+ CD4+ TEM cells and CD4+ naïve T cells. B) STRING analysis representing predicted protein-protein interactions among upregulated genes by CD28lo CD57hi SLAMF7+ CD4+ TEM cells. Number of lines connecting each node represent degree of evidence for interaction. C) CNET plot showing genes enriched for by CD28lo CD57hi SLAMF7+ CD4+ TEM cells among gene sets associated with various T cell subsets. (D) Representative multi-color immunofluorescence image of CD4+ (red) GZMA+ (green) CD28low (purple) T cells in an IgG4-RD lesion. (E) Relative proportions of CD28high and low CD4+CTLs in submandibular lesions of individual IgG4-RD patients (n = 6).
Figure 4.
Figure 4.. Effector CD8+CTLs accumulate in the tissues and blood of patients with IgG4-RD.
(A) Immunofluorescence image showing CD4 (red), CD8 (green) and GZMA (purple) staining in an IgG4-RD lesion. Red arrows indicate CD4+ GZMA+ T cell. Green arrows indicate CD8+ GZMA+ T cell. (B) Absolute number of CD4+ T cell and CD8+ T cell in tissues affected by IgG4-RD (n = 21). (C) Absolute number of CD4+CTLs and CD8+CTLs in tissues affected by IgG4-RD (n = 13). (D) Representative multi-color immunofluorescence image of CD8 (red), CD28 (purple) and GZMA (green) in an IgG4-RD lesion. White arrows indicate CD8+ GZMA+ CD28low T cells. (E) Relative proportions of CD28hi and CD28lo CD8+ GZMA+ T cells in tissues affected by IgG4-RD (n = 6). (F) Dot plot of flow cytometry data displaying significant accumulation of CD28loCD57hi CD8+ effector-memory T cells in the blood of IgG4-RD patients (n=48) compared to age-matched healthy donors (n=20). Bars represent medians and inter-quartile ranges. p-values calculated by ANOVA with Kruskal-Wallis test to control for multiple comparisons. (G) Dot plot of flow cytometry data showing that the majority of CD28lo CD57hi CD8+ effector-memory T cells in the blood of patients with IgG4-RD accumulate in the TEMRA, which is more pronounced in those with more severe disease. Bars represent medians and inter-quartile ranges. p-values calculated by Mann-Whitney U test. (H) Stacked bar chart showing that the majority of CD28lo CD8+ T cells infiltrating IgG4-RD tissues have lost CD45RA expression, in contrast to their circulating counterparts presented in 6G. (I) Scatter plot displaying the positive correlation between CD28loCD57hi CD8+ T cells and CD28loCD57hi CD4+CTLs in the blood of IgG4-RD patients. p-value calculated by linear regression.
Figure 5.
Figure 5.. CD28lo CD57hi CD8+ T cells display gene signatures of cytotoxicity, activation and metabolism.
A) STRING analysis representing predicted protein-protein interactions among upregulated genes by CD28loCD57hi CD8+ T cells shows a cytotoxic gene signature. Number of lines connecting each node represent degree of evidence for interaction. B) Intracellular flow cytometry for granzyme A (GZMA), perforin (PRF) and granzyme B (GZMB) showing the greatest frequency of cytotoxic protein expression among CD28loCD57hi CD8+ TEMRA cells compared to other CD8+ TEMRA subsets. Displayed are medians (bars) and inter-quartile range (error bars). C) Heatmap displaying 132 genes differentially expressed among CD28loCD57hi CD8+ T cells from IgG4-RD subjects compared to those from healthy donors. D) STRING analysis representing predicted protein-protein interactions among upregulated genes by CD28loCD57hi CD8+ T cells from IgG4-RD subjects compared to healthy donors showing signatures of cytokine signaling and activation. E) Dot plot displaying gene set enrichment among CD28loCD57hi CD8+ T cells from IgG4-RD subjects compared to those from healthy donors.
Figure 6.
Figure 6.. CD4+CTLs and apoptotic cells expressing HLA-DR are abundant in tissues from IgG4-RD patients.
(A) Representative multi-color immunofluorescence images showing cleaved caspase-3 (cCasp-3) staining (green) in IgG4-RD, Sjögren’s syndrome (SjS) and chronic sialadenitis (CS). (B and C) Absolute numbers (B) and proportions (C) of cCasp-3 positive apoptotic cells in IgG4-RD (n = 15), SjS (n = 15) and CS (n = 10). (D) Representative multi-color immunofluorescence image of HLA-DR+ (red) cCasp-3+ (green) cells in an IgG4-RD lesion. (E) Percentages of HLA-DR+ cells in cCasp-3+/− cells in IgG4-RD (n = 5). Mann-Whitney U test used to calculate p-value. Multiple comparisons controlled for by Kruskal-Wallis test. Error bars represent mean±SEM. *p < 0.05; ***p < 0.001; ****p < 0.0001.
Figure 7.
Figure 7.. CD3+ T cells and vimentin+ cells account for a large proportion of apoptotic cells in tissues from IgG4-RD patients.
(A) Representative multi-color immunofluorescence image of CD3 (red), CD19 (orange), CD68 (purple) and cCasp-3+ (green) staining in an IgG4-RD lesion. White arrows indicate a CD3+ cCasp-3+ cell. (B) Proportions of apoptotic cells in IgG4-RD (n = 5) accounted for by T cells (red), B cells (green), Macrophages (blue) and other cells (gray). (C) Representative multi-color immunofluorescence images showing vimentin (red), α-SMA (yellow) and cCasp-3 (green) staining in an IgG4-RD lesion. White arrows indicate a vimentin+ cCasp-3+ cell. (D) Proportions of apoptotic cells in IgG4-RD (n = 5) accounted for by mesenchymal cells (red)(vimentin+, α-SMA+/−), myoepithelial cells (green)(vimentin−, α-SMA+) and other cells (gray)(vimentin−, α-SMA−). (E) Relative proportions of each apoptotic cell type in each IgG4-RD patient (n = 5) are depicted.
Figure 8.
Figure 8.. Schematic overview of proposed disease mechanism of IgG4-RD.
Activated B cells efficiently capture antigen and present peptide to CD4+ T cells driving differentiation into a CD4+CTL phenotype, activation and clonal proliferation. Target cells upregulate HLA class II (in the appropriate inflammatory milieu) and act as antigen presenting cells to expanded CD4+CTLs resulting in apoptotic cell death. Loss of antigen sequestration by apoptosing cells results in the cross-presentation by dendritic cells in the draining lymph node driving the activation and expansion of CD8+CTLs. CD8+CTLs travel to the site of inflammation and contribute to the cell death of apoptotic targets. Fibroblasts are activated by the secretion of pro-fibrotic molecules by CD4+CTLs resulting in the production of extra-cellular matrix proteins to “fill the space” created by target cell apoptosis.

Similar articles

Cited by

References

    1. Kamisawa T, Zen Y, Pillai S, Stone JH. IgG4-related disease. Lancet. 2015;385:1460–71. - PubMed
    1. Stone JH, Zen Y, Deshpande V. IgG4-related disease. N Engl J Med. 2012;366:539–51. - PubMed
    1. Wallace ZS, Naden RP, Chari S, Choi HK, Della-Torre E, Dicaire J-F, et al. The 2019 American College of Rheumatology/European League Against Rheumatism classification criteria for IgG4-related disease. Ann Rheum Dis. 2020;79:77–87. - PubMed
    1. Deshpande V, Zen Y, Chan JK, Yi EE, Sato Y, Yoshino T, et al. Consensus statement on the pathology of IgG4-related disease. Mod Pathol. 2012;25:1181–92. - PubMed
    1. Carruthers MN, Topazian MD, Khosroshahi A, Witzig TE, Wallace ZS, Hart PA, et al. Rituximab for IgG4-related disease: a prospective, open-label trial. Ann Rheum Dis. 2015;74:1171–7. - PubMed

Publication types

MeSH terms