

Statistical Explorations and Univariate Timeseries Analysis on COVID-19 Datasets to Understand the Trend of Disease Spreading and Death
- PMID: 32486055
- PMCID: PMC7308840
- DOI: 10.3390/s20113089
Statistical Explorations and Univariate Timeseries Analysis on COVID-19 Datasets to Understand the Trend of Disease Spreading and Death
Abstract
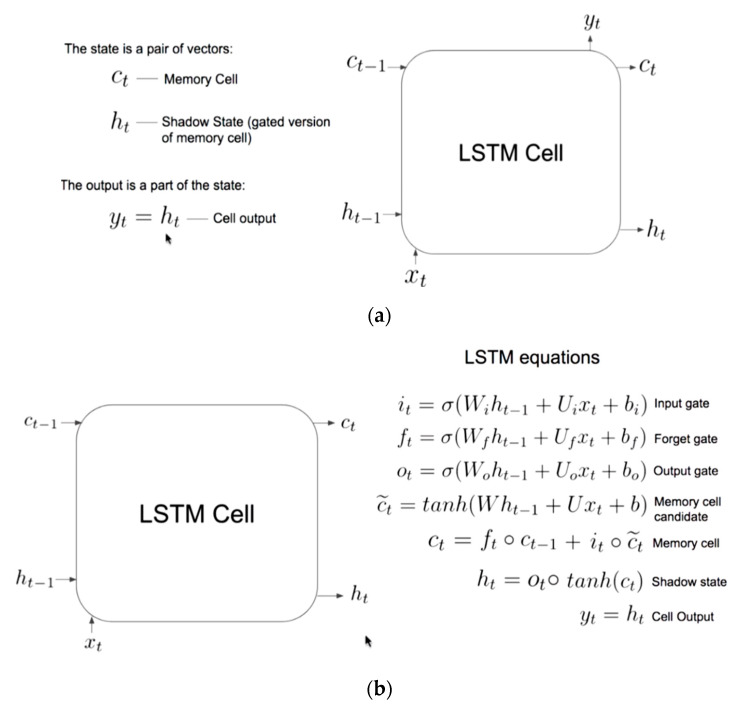
"Severe Acute Respiratory Syndrome Coronavirus 2 (SARS-CoV-2)", the novel coronavirus, is responsible for the ongoing worldwide pandemic. "World Health Organization (WHO)" assigned an "International Classification of Diseases (ICD)" code-"COVID-19"-as the name of the new disease. Coronaviruses are generally transferred by people and many diverse species of animals, including birds and mammals such as cattle, camels, cats, and bats. Infrequently, the coronavirus can be transferred from animals to humans, and then propagate among people, such as with "Middle East Respiratory Syndrome (MERS-CoV)", "Severe Acute Respiratory Syndrome (SARS-CoV)", and now with this new virus, namely "SARS-CoV-2", or human coronavirus. Its rapid spreading has sent billions of people into lockdown as health services struggle to cope up. The COVID-19 outbreak comes along with an exponential growth of new infections, as well as a growing death count. A major goal to limit the further exponential spreading is to slow down the transmission rate, which is denoted by a "spread factor (f)", and we proposed an algorithm in this study for analyzing the same. This paper addresses the potential of data science to assess the risk factors correlated with COVID-19, after analyzing existing datasets available in "ourworldindata.org (Oxford University database)", and newly simulated datasets, following the analysis of different univariate "Long Short Term Memory (LSTM)" models for forecasting new cases and resulting deaths. The result shows that vanilla, stacked, and bidirectional LSTM models outperformed multilayer LSTM models. Besides, we discuss the findings related to the statistical analysis on simulated datasets. For correlation analysis, we included features, such as external temperature, rainfall, sunshine, population, infected cases, death, country, population, area, and population density of the past three months - January, February, and March in 2020. For univariate timeseries forecasting using LSTM, we used datasets from 1 January 2020, to 22 April 2020.
Keywords: COVID-19; ICD; LSTM; RNN; algorithm; artificial intelligence; community disease; correlation; deep learning; hypothesis test; keras; machine learning; measurable sensor data; population; public health; python; regression; spread factor; statistics; transmission rate.
Conflict of interest statement
The authors declare no conflict of interest.
Figures


References
-
- World Health Organization . COVID-19 Page. WHO; Geneva, Switzerland: 2019. [(accessed on 26 May 2020)]. Available online: https://www.who.int/emergencies/diseases/novel-coronavirus-2019.
-
- Our World in Data (University of Oxford) [(accessed on 15 May 2020)]; Available online: https://ourworldindata.org/coronavirus-source-data.
MeSH terms
LinkOut - more resources
Full Text Sources
Miscellaneous
