. 2020 Jun 1;20(1):822.
doi: 10.1186/s12889-020-08890-4.

Modelling and prediction of global non-communicable diseases

Affiliations

Modelling and prediction of global non-communicable diseases

Yang Wang et al. BMC Public Health. .

Abstract

Background: Non-communicable diseases (NCDs) are the main health and development challenge facing humankind all over the world. They are inextricably linked to socio-economic development. Deaths caused by NCDs should be different in different socio-economic development stages. The stratified heterogeneity of NCD deaths is currently not fully explored.

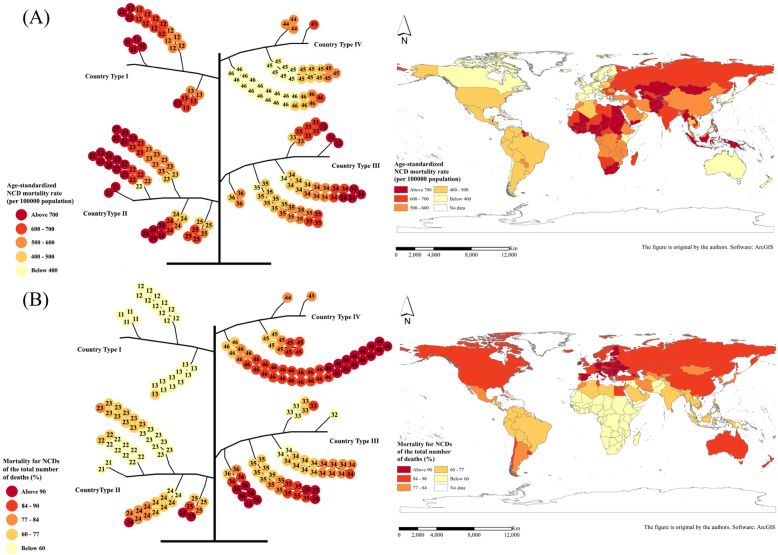
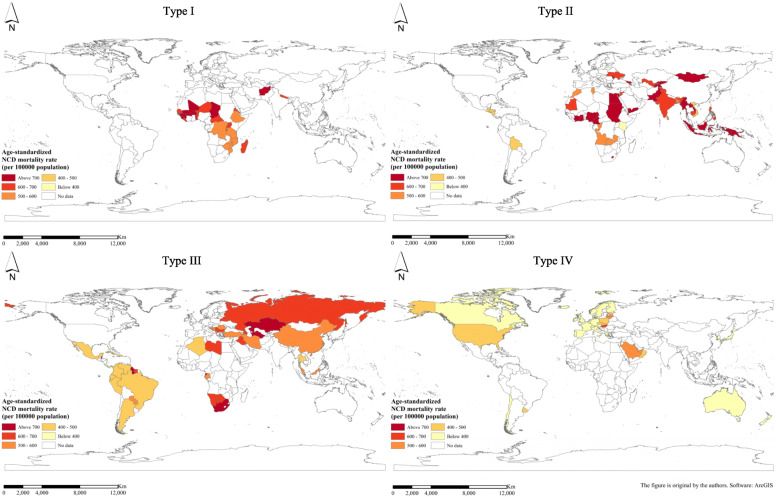
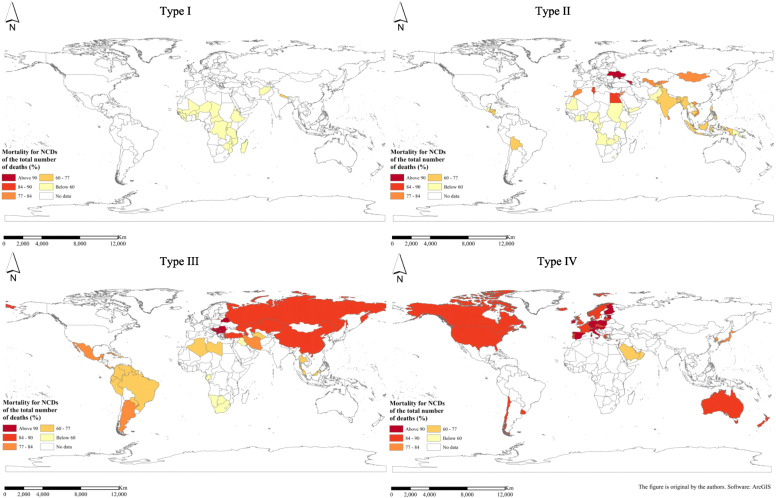
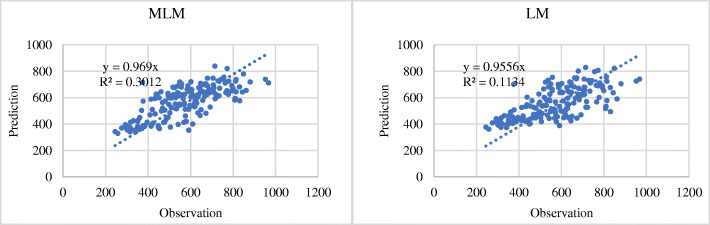
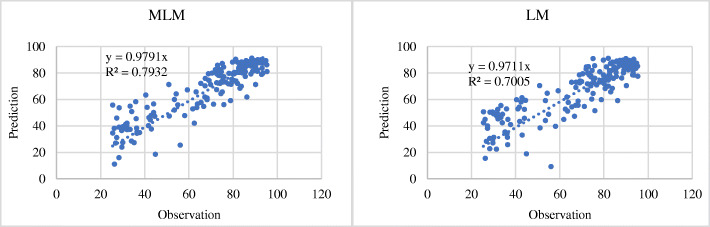
Methods: Countries were classified according to their socio-economic types and development stages, which were illustrated as a tree-like structure called Geotree. NCD deaths were linked to the countries and so were attached to the Geotree, which was modelled by a multilevel model (MLM) approach. Accordingly, the levels of NCD death indexes were predicted for 2030.

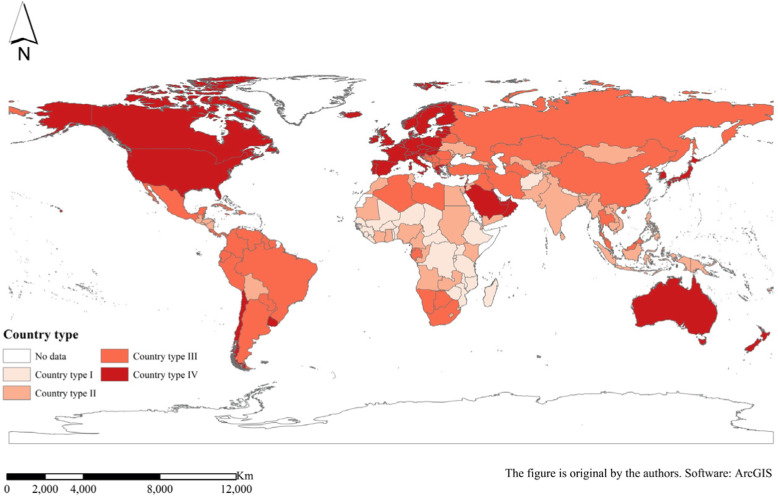
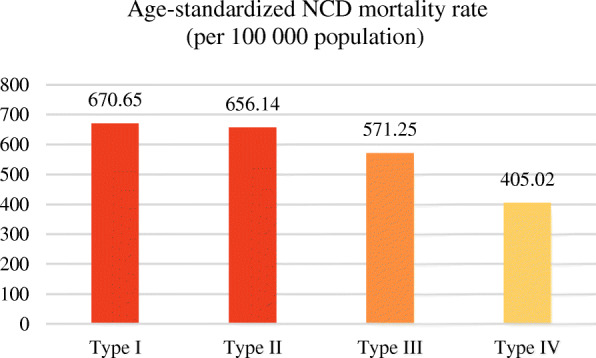
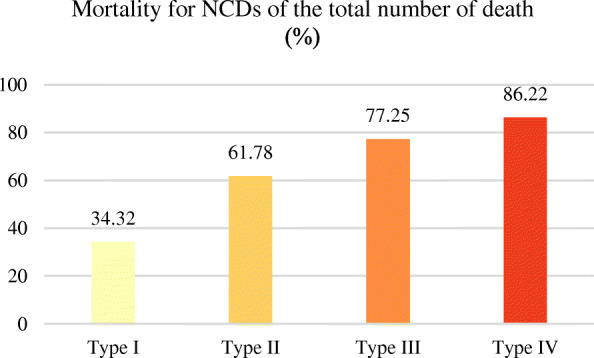
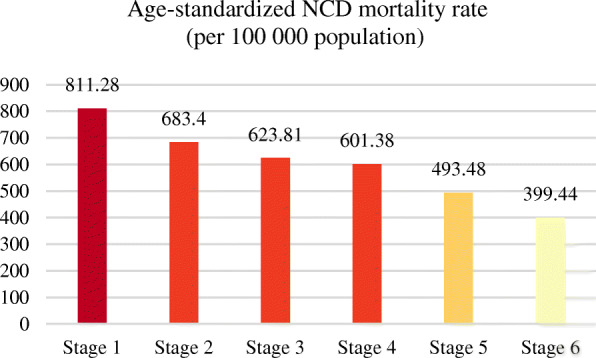
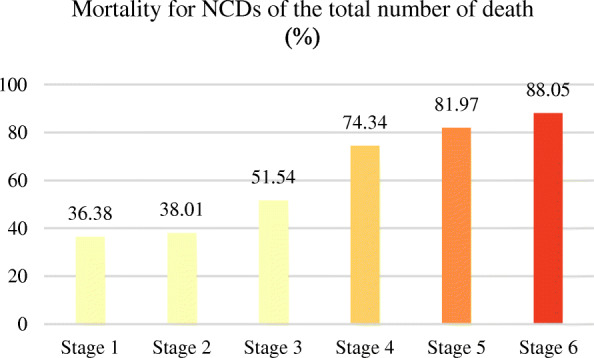
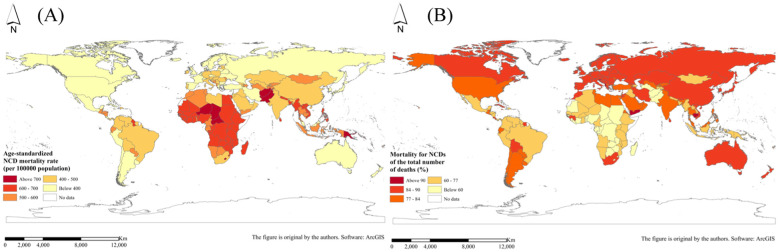
Results: Through the Geotree structure constructed in the study, it can be seen that the NCD death index has obvious stratified heterogeneity; that is, the NCD death index shows different trends in different country types and socio-economic development stages. In the first-level branches (country type), as national income increases, NCD mortality rate decreases and the proportion of NCD deaths to total deaths increases. In the secondary-level trunks (socio-economic development stage), as a country's development stage rises, the NCD mortality rate decreases and the proportion of NCD deaths to total deaths increases. In addition, combined with the hierarchical nature of the evolution tree model, the MLM was used to predict the global NCD death index for 2030. The result was that by 2030, the global average age-standardized NCD mortality rate would be 510.54 (per 100,000 population) and the global average mortality for NCD deaths of the total number of deaths would be 75.26%.

Conclusions: This study found that there is a significant association between socio-economic factors and NCD death indicators in the tree-like structure. In the Geotree, countries on the same branch or trunk can learn from countries with higher development stages to formulate more effective NCD response policies and find the right prevention and treatment path.

Keywords: Geotree; Non-communicable diseases; Prediction; Socio-economic factors.


Conflict of interest statement

The authors declare they have no competing financial interests.

Figures

Fig. 1
Fig. 1
Spatial distribution of the four country types
Fig. 2
Fig. 2
Global NCD evolution tree corresponding to the geospatial distribution: a 2015 age-standardized NCD mortality rate (per 100,000 population) and b 2015 mortality for NCDs of the total number of deaths (%). (NCDs include cancer, diabetes mellitus, cardiovascular diseases, digestive diseases, skin diseases, musculoskeletal diseases, and congenital anomalies)
Fig. 3
Fig. 3
Average age-standardized NCD mortality rate (per 100,000 population) for different country types in 2015. (NCDs include cancer, diabetes mellitus, cardiovascular diseases, digestive diseases, skin diseases, musculoskeletal diseases, and congenital anomalies)
Fig. 4
Fig. 4
Spatial distribution of average age-standardized NCD mortality rate (per 100,000 population) for different country types in 2015. (NCDs include cancer, diabetes mellitus, cardiovascular diseases, digestive diseases, skin diseases, musculoskeletal diseases, and congenital anomalies)
Fig. 5
Fig. 5
The mortality for NCD deaths of the total number of deaths (%) for different country types in 2015. (NCDs include cancer, diabetes mellitus, cardiovascular diseases, digestive diseases, skin diseases, musculoskeletal diseases, and congenital anomalies)
Fig. 6
Fig. 6
Spatial distribution of average mortality for NCDs of the total number of deaths (%) for different country types in 2015. (NCDs include cancer, diabetes mellitus, cardiovascular diseases, digestive diseases, skin diseases, musculoskeletal diseases, and congenital anomalies)
Fig. 7
Fig. 7
Average age-standardized NCD mortality rate (per 100,000 population) for different development stages in 2015. (NCDs include cancer, diabetes mellitus, cardiovascular diseases, digestive diseases, skin diseases, musculoskeletal diseases, and congenital anomalies)
Fig. 8
Fig. 8
Average mortality for NCD deaths of the total number of deaths (%) for different development stages in 2015. (NCDs include cancer, diabetes mellitus, cardiovascular diseases, digestive diseases, skin diseases, musculoskeletal diseases, and congenital anomalies)
Fig. 9
Fig. 9
Accuracy comparison between multilevel model fitting results and linear regression model fitting results for age-standardized NCD mortality rate (per 100,000 population). (NCDs include cancer, diabetes mellitus, cardiovascular diseases, digestive diseases, skin diseases, musculoskeletal diseases, and congenital anomalies. In the figure, the horizontal axis represents the observation value of NCDs deaths, and the vertical axis represents the prediction value)
Fig. 10
Fig. 10
Accuracy comparison between multilevel model fitting results and linear regression model fitting results for mortality for NCDs of the total number of deaths (%). (NCDs include cancer, diabetes mellitus, cardiovascular diseases, digestive diseases, skin diseases, musculoskeletal diseases, and congenital anomalies. In the figure, the horizontal axis represents the observation value of NCDs deaths, and the vertical axis represents the prediction value)
Fig. 11
Fig. 11
Spatial prediction of NCD death indexes in 2030: a global age-standardized NCD mortality rate (per 100,000 population) and b global mortality for NCDs of the total number of deaths (%). (NCDs include cancer, diabetes mellitus, cardiovascular diseases, digestive diseases, skin diseases, musculoskeletal diseases, and congenital anomalies)

References

    1. World Health Organization . Global status report on noncommunicable diseases—2014. Geneva: WHO; 2014.
    1. Terzic A, Waldman S. Chronic diseases: the emerging pandemic. Clin Transl Sci. 2011;4(3):225–226. - PMC - PubMed
    1. World Health Organization . Global health observatory—2011. Geneva: WHO; 2012.
    1. World Health Organization . Global action plan for the prevention and control of noncommunicable diseases: 2013–2020. Geneva: WHO; 2013.
    1. Abegunde DO, Mathers CD, Adam T, Ortegon M, Strong K. The burden and costs of chronic diseases in low-income and middle-income countries. Lancet. 2008;370(9603):1929–1938. - PubMed

MeSH terms