. 2020 Jun 2;21(1):132.
doi: 10.1186/s13059-020-02040-0.

Universal promoter scanning by Pol II during transcription initiation in Saccharomyces cerevisiae

Affiliations

Universal promoter scanning by Pol II during transcription initiation in Saccharomyces cerevisiae

Chenxi Qiu et al. Genome Biol. .

Abstract

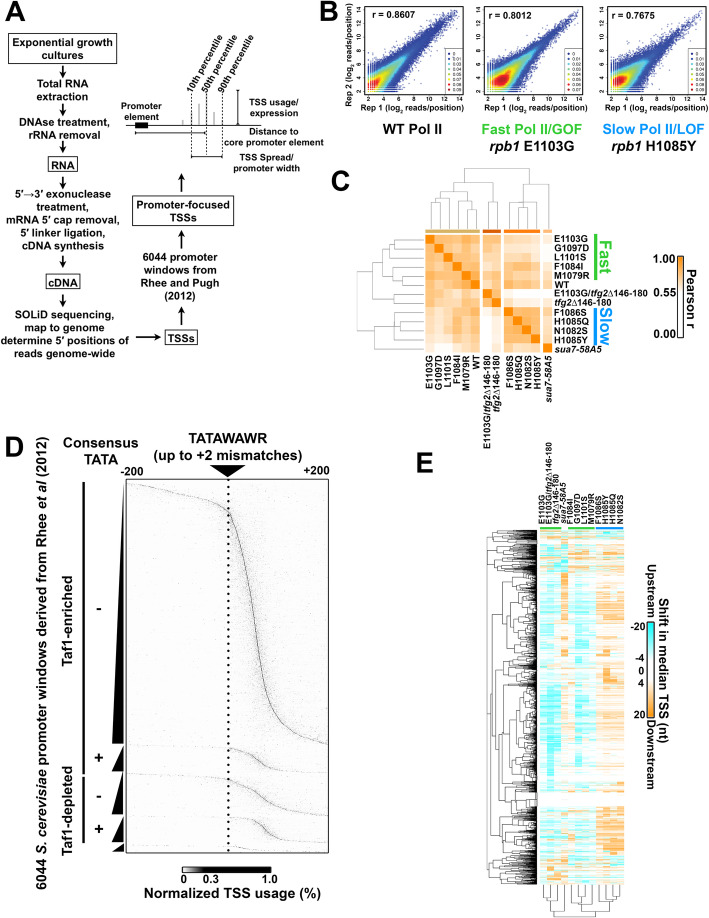
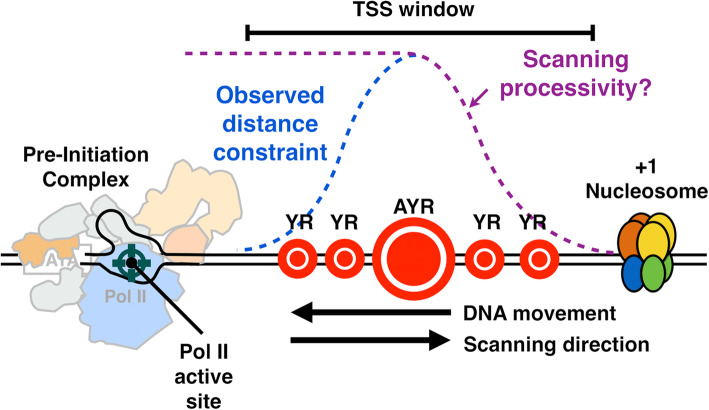
Background: The majority of eukaryotic promoters utilize multiple transcription start sites (TSSs). How multiple TSSs are specified at individual promoters across eukaryotes is not understood for most species. In Saccharomyces cerevisiae, a pre-initiation complex (PIC) comprised of Pol II and conserved general transcription factors (GTFs) assembles and opens DNA upstream of TSSs. Evidence from model promoters indicates that the PIC scans from upstream to downstream to identify TSSs. Prior results suggest that TSS distributions at promoters where scanning occurs shift in a polar fashion upon alteration in Pol II catalytic activity or GTF function.

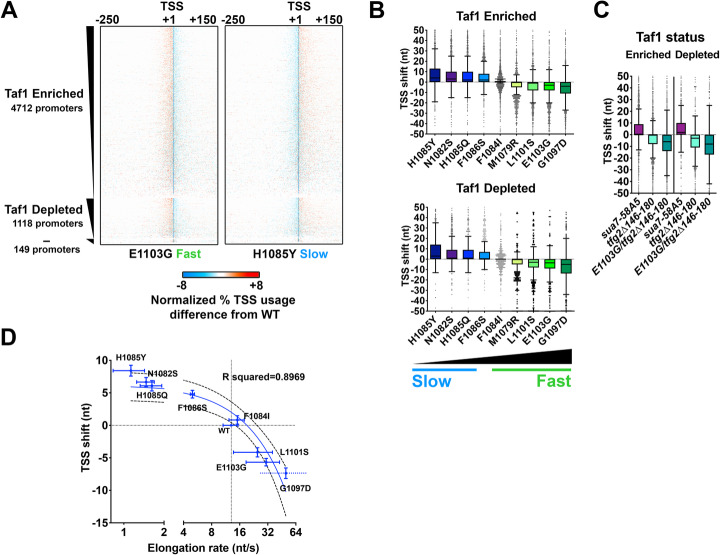
Results: To determine the extent of promoter scanning across promoter classes in S. cerevisiae, we perturb Pol II catalytic activity and GTF function and analyze their effects on TSS usage genome-wide. We find that alterations to Pol II, TFIIB, or TFIIF function widely alter the initiation landscape consistent with promoter scanning operating at all yeast promoters, regardless of promoter class. Promoter architecture, however, can determine the extent of promoter sensitivity to altered Pol II activity in ways that are predicted by a scanning model.

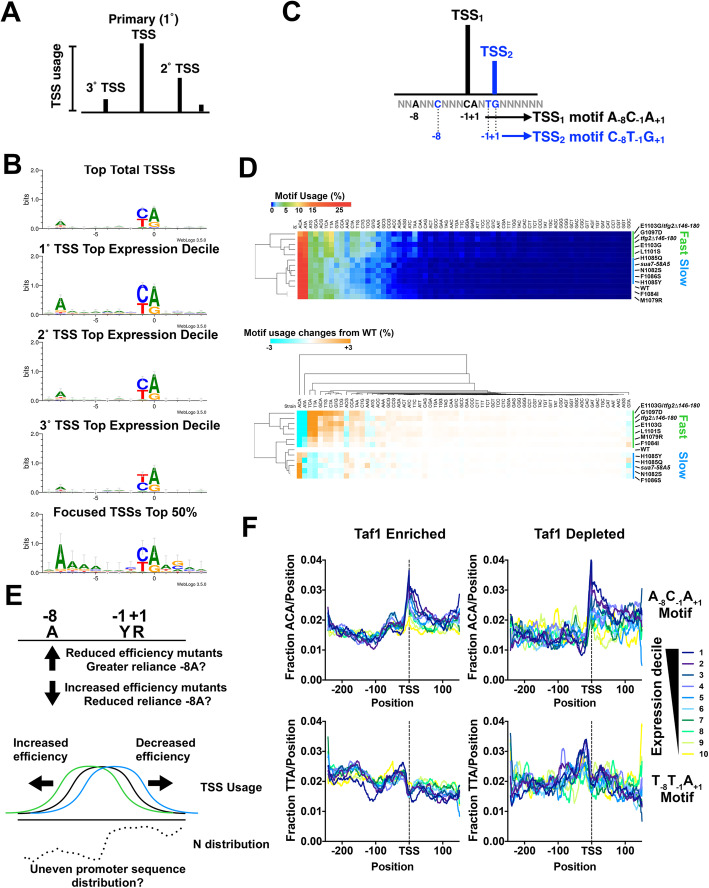
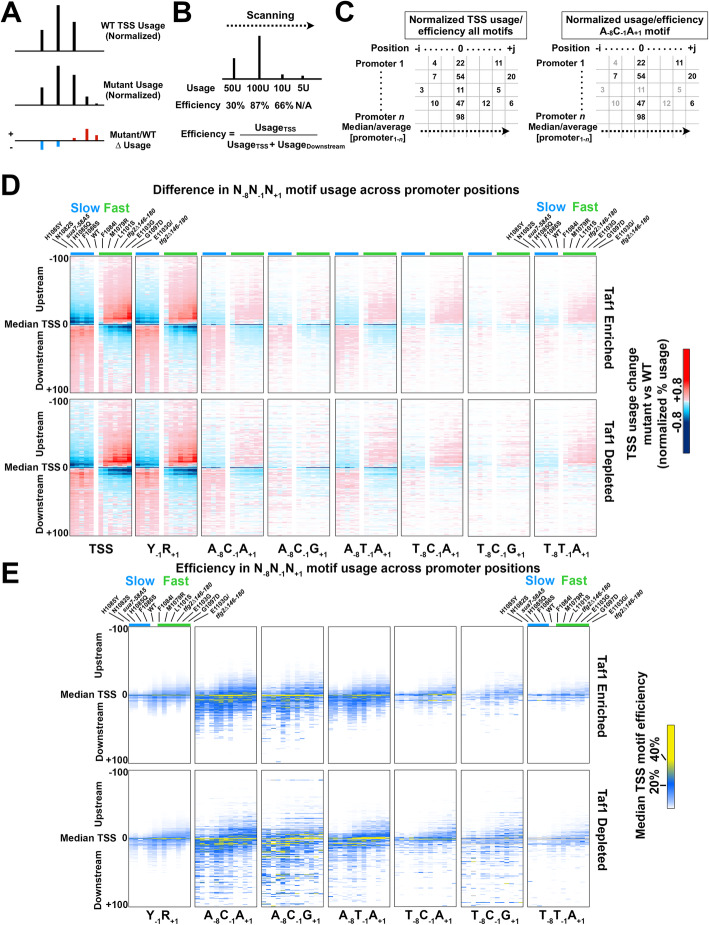
Conclusions: Our observations coupled with previous data validate key predictions of the scanning model for Pol II initiation in yeast, which we term the shooting gallery. In this model, Pol II catalytic activity and the rate and processivity of Pol II scanning together with promoter sequence determine the distribution of TSSs and their usage.


Conflict of interest statement

B.F.P. has a financial interest in Peconic, LLC, which utilizes the ChIP-exo technology implemented in this study and could potentially benefit from the outcomes of this research. All other authors declare that they have no competing interests.

Figures

Fig. 1
Fig. 1
Genome-wide analysis of TSS selection in S. cerevisiae. a Overview of method and description of simple metrics used in analyzing TSS distributions at yeast promoters. b Reproducibility of TSS-seq analysis demonstrated by heat scatter correlation plots determine RNA 5′ ends across all genome positions with ≥ 3 reads in each library for biological replicates of WT, rpb1 E1103G, and rpb1 H1085Y libraries. Colors indicate the plot density from cool to warm (low to high estimated kernel density). Pearson r is shown. c Heat map illustrating hierarchical clustering of Pearson correlation coefficients between aggregate (combined biological replicate) libraries for all strains. Clustering illustrates increased correlation among known reduced function rpb1 alleles (“slow” or LOF) are increased correlation among increased activity rpb1 alleles (“fast” or GOF). WT shows intermediate correlations with both classes. d Core promoters (n = 6044) predicted by Rhee and Pugh from GTF ChIP-exo data were used to initially map TSSs. TSSs were row normalized to illustrate the distribution within each window; TSSs generally map downstream of predicted core promoters for most but not all promoter windows. Note that the resolution of the figure will have less pixels that promoter rows (6044). e Determination of change in median TSS position (upstream shift in median position is negative (cyan), downstream shift in median position is positive (orange), see the “Methods” section) for promoters with ≥ 200 reads (n = 3494). Heat map shows individual yeast promoter regions hierarchically clustered on the y-axis with the measured TSS shift for hierarchically clustered TSS usage affecting mutants on the x-axis
Fig. 2
Fig. 2
Pol II and GTF mutants confer polar shifts in TSS usage across all promoter classes in S. cerevisiae. a Heat maps show relative TSS distribution changes in a fast (rpb1 E1103G) or a slow (rpb1 H1085Y) Pol II mutant relative to WT. Four hundred one nucleotide promoter windows were anchored on measured median TSS position in the WT strain, with TSS distributions for WT or mutant strains normalized to 100% for each promoter (heat map row). Differences in distribution between WT and mutant TSS usage were determined by subtracting the normalized WT distribution from normalized mutant distributions. Promoters are separated into those classified as Taf1-enriched (Taf1 Enriched), Taf1-depleted (Taf1 Depleted), or neither (−), and rank ordered on the y-axis based on total reads in WT (from high to low). Gain in relative mutant TSS usage is positive (orange) while loss in relative mutant usage (cyan) is negative. b Polar shifts in TSS usage are apparent for examined rpb1 mutants (except rpb1 F1084I) across promoter classes. All box plots are Tukey plots unless otherwise noted (see the “Methods” section). Promoters examined are n = 3494 (> 200 reads total expression in WT). Pol II mutants are rank ordered by relative strength of in vitro elongation defect (slow to fast) and colored from blue (slow) to green (fast) in similar fashion to allow visual comparison of same mutants between promoter classes. All median TSS shift values for mutants are statistically distinguished from zero at p < 0.0001 (Wilcoxon signed rank test), except F1084I Taf1 Enriched (p = 0.0021) or F1084I Taf1 Depleted (not significant). c Polar shifts in TSS usage are apparent for examined GTF mutants and an rpb1 tfg2 double mutant shows exacerbated TSS shifts relative to the single mutants (compare c to b). Promoters examined are as in b. All median TSS shift values for mutants are statistically distinguished from zero at p < 0.0001 (Wilcoxon signed rank test). d Average TSS shifts in Pol II rpb1 mutants correlate with their measured in vitro elongation rates. Error bars on TSS shifts and elongation rates are bounds of the 95% confidence intervals of the means. Elongation rates are from [82, 84]. Mutants slower than WT in vitro exhibit downstream shifts in TSS distributions while mutants faster than WT in vitro exhibit upstream shifts in TSS distributions. Linear regression line is shown along with the 95% confidence interval of the fit (dashed lines). R squared = 0.8969. Note the log2 scale on the x-axis. Break in x-axis is to allow Pol II slow mutants to be better visualized. Promoters examined are as in b and c
Fig. 3
Fig. 3
TSS motif usage and alterations in TSS usage affecting mutants. a Schematic of TSS distribution at an individual promoter defining primary TSS as most used followed by secondary and tertiary etc based on usage. b Preferred Y− 1R+ 1 motif usage observed in our TSS data as has been observed previously. S. cerevisiae selective enrichment for A at − 8 is apparent at the most highly used starts in promoters with higher expression (compare primary/top (1°) TSSs with secondary (2°) or tertiary TSSs from promoters within the top decile of expression). Promoters exhibiting very narrow TSS spreads (focused) show additional minor enrichments for bases near the TSS. c Schematic indicating how each TSS can be separated into one of 64 groups based on identity of nucleotides at positions − 8, − 1, and + 1 relative to the TSS (at + 1). d Overall TSS motif usage in WT and TSS usage affecting mutants. TSSs were separated by N− 8N−1N+ 1 identity (64 motifs) as the vast majority of TSS reads derive from N− 8Y−1R+ 1 sequences. This means each of 64 motifs encompasses TSSs for N−7N−6N−5N−4N− 3 N− 2 sequences. (Top) Percent motif usage determined for individual strains and displayed in heat map hierarchically clustered on the y-axis to group strains with similar motif usage distribution. (Bottom) Difference heat map illustrating relative changes in N−8Y−1R+ 1 motif usage in heat map hierarchically clustered on the y-axis to group strains with similar motif usage difference distribution. e Alteration in motif usage and apparent changes to reliance on an A−8 could arise from a number of possibilities. Alterations in TSS efficiencies in mutants could result in upstream or downstream shifts in TSS distribution if mutants have decreased or increased reliance, respectively, on a particular motif. Conversely, alteration in initiation efficiency in general (increase or decrease) could alter TSS motif usage if TSS motifs are unevenly distributed across yeast promoters (example distribution for hypothetical motif N). f TSS motifs are unevenly distributed across yeast promoters and differentially enriched correlating with steady state promoter expression levels. (Top) The apparent highest used A−8Y−1R+ 1 motif (A−8C−1A+ 1) and (bottom) the less preferred T−8T−1A+ 1 motif were compared for Taf1-enriched or Taf1-depleted promoters for promoters separated into overall expression decile (decile 1 contains highest expressed promoters, decile 10 the lowest)
Fig. 4
Fig. 4
TSS usage mutants alter TSS usage efficiencies across TSS motifs consistent with promoter scanning initiation at all promoters. a Schematic indicating how normalized difference heat maps are generated (for visual purposes, differences scaled in this schematic to 1.5×). b In a directional scanning mechanism, TSS efficiency is defined as the usage at a given TSS divided by that usage and all downstream usage. This allows strength of TSS to be compared instead of absolute usage, which is determined by “first come, first served” priority effects as the probability of initiation reaches a limit of one. c Schematic illustrating that TSS usages/efficiencies across all promoters and positions form a matrix, and each of 64 motif TSSs represents only a subset of these values (for example A−8C−1A+ 1). Comparison of median or average values for usage/efficiency for each N−8N−1N+ 1 motif TSS subset across promoters at each promoter position allows for partial control of sequence and position variables in comparing how initiation mutants affect TSS usage. d Altered usage across TSS motifs in TSS usage-affecting mutants. Heat maps show difference in aggregate usage normalized to promoter number for different N−8Y−1R+ 1 TSS motifs. Strains are ordered on the x-axis from left to right from strongest downstream shifter to strongest upstream shifter, with class of Pol II mutant (fast or slow) indicated by green or blue color bars, respectively. Promoter positions from − 100 (upstream) to + 100 (downstream) flanking the median TSS position in WT are shown. Regardless or promoter class, TSS usage affecting mutants cause polar effects on distribution of TSS usage when examining motifs separately. e Motif efficiency was calculated as in b for a subset of N−8Y−1R+ 1 TSS motifs across promoters at each promoter position for all mutants. Heat maps are ordered as in d. Downstream-shifting mutants in d generally reduce TSS usage efficiencies across promoter positions. Upstream-shifting mutants in d generally shift TSS efficiencies upstream
Fig. 5
Fig. 5
Attributes of core promoter classes and PIC positioning in TSS usage-affecting mutants. a Enrichment by expression decile in WT of putative core promoter elements in Taf1-enriched and Taf1-depleted promoters. TATA consensus (TATAWAWR, W=A/T, R=A/G) is enriched in Taf1-depleted promoters while the GA-rich element (GAAAAA) is enriched in Taf1-enriched promoters. Yeast promoters are relatively AT-rich so there is a high probability of “TATA-like” elements differing from the TATA consensus by two mismatches. b Tested GAE or TATA-like elements do not greatly contribute to expression from promoters where tested. Expression by Northern blotting for promoters or classes of promoter mutant fused to a reporter gene. Promoter mutants were normalized to the respective WT version of each promoter. “Delete” mutants represent deletions of particular element types. “Mutant” elements represent elements where base composition has been altered. c GTF positioning by promoter classes determined by ChIP-exo for Sua7 (TFIIB) or Ssl2 (TFIIH). For each promoter, the median position of ChIP-exo reads on the top (TOP) or bottom (BOT) DNA strand was used to estimate GTF positioning. TOP and BOT strands are defined relative to promoter orientation in the genome and have the same upstream and downstream as a promoter. d Left graph shows histograms of GTF signal median positions for ChIP-exo read distributions at Taf1-enriched promoters while right graph shows histograms of GTF signal median positions for ChIP-exo read distributions at Taf1-depleted promoters. e Pol II mutant effects on GTF positioning as detected by ChIP-exo for Sua7 (TFIIB) or Ssl2 (TFIIH). Aggregate ChIP-exo signal for Taf1-enriched or Taf1-depleted promoters on top (TOP) or bottom (BOT) DNA strands in WT, rpb1 H1085Y, or rpb1 E1103G. Curves on graph indicate 2nd-order polynomial (10 neighbor) smoothing of promoter-normalized ChIP-exo reads averaged for the top 50% of promoters determined by ChIP-exo reads in WT cells. Biological replicate data are shown for each strain and replicates are essentially superimposable
Fig. 6
Fig. 6
Effects of slow and fast Pol II mutants on nucleosome positioning. a Average nucleosome midpoints per promoter from MNAse-seq for WT, rpb1 H1085Y, and rpb1 E1103G were mapped for Taf1-enriched promoters anchored on experimentally determined + 1 nucleosome positions at + 1 (− 200 to + 800 positions shown). Both rpb1 H1085Y and rpb1 E1103G shift genic nucleosomes downstream relative to WT. WT average nucleosome positions determined by autocorrelation analysis of WT nucleosome midpoints. Data are from two (WT), seven (rpb1 H1085Y), or eight (rpb1 E1103G) independent biological replicates. Yellow dashed lines allow comparison of WT nucleosome positions with rpb1 mutants. b Nucleosome repeat lengths determined by autocorrelation analysis on the independent replicates noted in a. Both rpb1 H1085Y and rpb1 E1103G nucleosome repeat lengths are significantly different from WT (Wilcoxon matched-pairs signed rank test, two tailed, p < 0.0001). c + 1 nucleosome positioning in rpb1 H1085Y is subtly altered from WT for Taf1-enriched promoters. Top violin plot shows the distribution of individual + 1 nucleosomes for rpb1 H1085Y biological replicates (n = 7) relative to the position determined from the WT average (n = 2) for Taf1-enriched promoters (n = 4161). + 1 nucleosome position median is significantly different from zero (Wilcoxon signed rank test, p < 0.0001). Middle violin plot as in top but for Taf1-enriched promoters in the top expression decile (n = 321). + 1 nucleosome position median is significantly different from zero (Wilcoxon signed rank test, p = 0.0005 (approximate)). Bottom violin plot as in middle but for Taf1-enriched promoters in the lowest expression decile (n = 376). + 1 nucleosome position median is not significantly different from zero (p = 0.2274 (approximate) test as above). d + 1 nucleosome positioning in rpb1 E1103G is subtly altered from WT for Taf1-enriched promoters. Violin plot shows the distribution of individual + 1 nucleosomes for rpb1 E1103G biological replicates (n = 8) relative to the position determined from the WT average (n = 2) for Taf1-enriched promoters (n = 4161). + 1 nucleosome position median is significantly different from zero (Wilcoxon signed rank test, p < 0.0001)
Fig. 7
Fig. 7
“Shooting Gallery” model for initiation by Pol II scanning in Saccharomyces cerevisiae. PIC assembly upstream of TSS region initiates a scanning process whereby TSSs are moved toward the PIC by DNA translocation putatively through TFIIH DNA translocase activity. Initiation probability will be determined in part by DNA sequence (the size of the indicated “targets”), Pol II catalytic activity, and the processivity of scanning, as well as constraints of TSSs being too close to the PIC. Our data are consistent with this mechanism acting at all yeast promoters and enable interpretation of how alterations to Pol II catalytic activity, TFIIF function, or TFIIB function alter initiation probability at all TSSs

References

    1. Vo Ngoc L, Wang YL, Kassavetis GA, Kadonaga JT. The punctilious RNA polymerase II core promoter. Genes Dev. 2017;31:1289–1301. - PMC - PubMed
    1. Kadonaga JT. Perspectives on the RNA polymerase II core promoter. Wiley Interdiscip Rev Dev Biol. 2012;1:40–51. - PMC - PubMed
    1. Juven-Gershon T, Kadonaga JT. Regulation of gene expression via the core promoter and the basal transcriptional machinery. Dev Biol. 2010;339:225–229. - PMC - PubMed
    1. Juven-Gershon T, Hsu JY, Kadonaga JT. Perspectives on the RNA polymerase II core promoter. Biochem Soc Trans. 2006;34:1047–1050. - PubMed
    1. Smale ST, Kadonaga JT. The RNA polymerase II core promoter. Annu Rev Biochem. 2003;72:449–479. - PubMed

Publication types

MeSH terms

Substances

LinkOut - more resources