. 2020 Jun 2;8(1):79.
doi: 10.1186/s40168-020-00858-1.

Using soil bacterial communities to predict physico-chemical variables and soil quality

Affiliations

Using soil bacterial communities to predict physico-chemical variables and soil quality

Syrie M Hermans et al. Microbiome. .

Abstract

Background: Soil ecosystems consist of complex interactions between biological communities and physico-chemical variables, all of which contribute to the overall quality of soils. Despite this, changes in bacterial communities are ignored by most soil monitoring programs, which are crucial to ensure the sustainability of land management practices. We applied 16S rRNA gene sequencing to determine the bacterial community composition of over 3000 soil samples from 606 sites in New Zealand. Sites were classified as indigenous forests, exotic forest plantations, horticulture, or pastoral grasslands; soil physico-chemical variables related to soil quality were also collected. The composition of soil bacterial communities was then used to predict the land use and soil physico-chemical variables of each site.

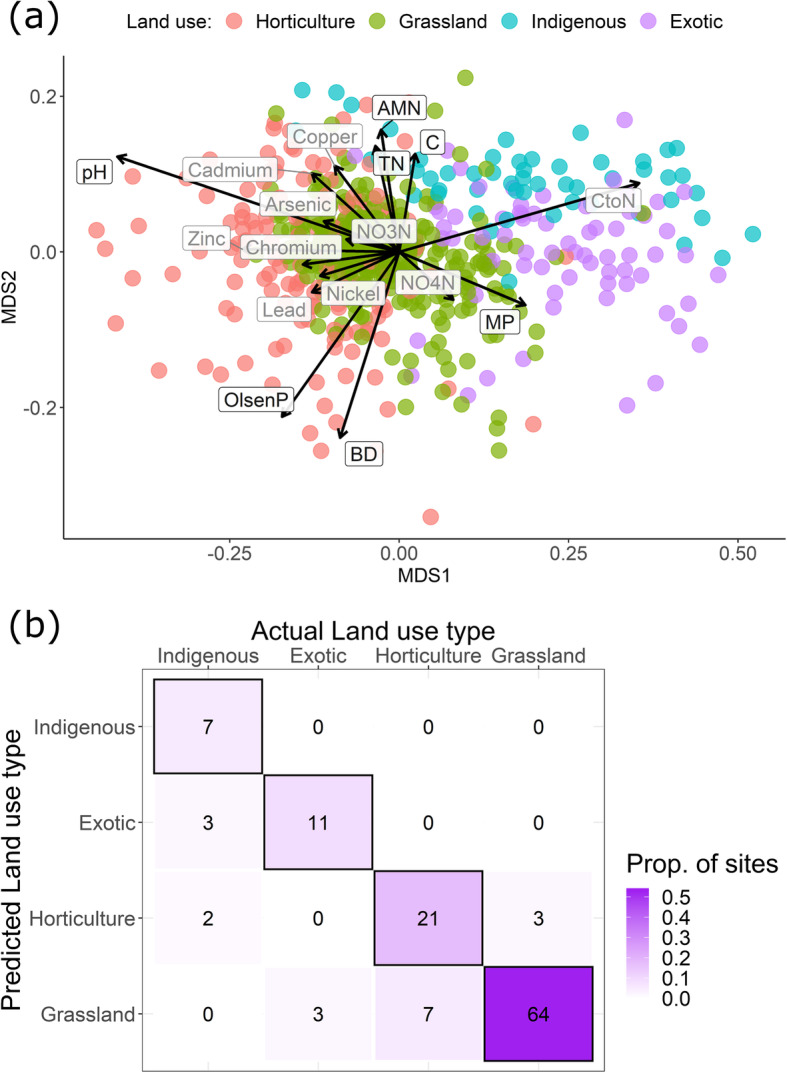
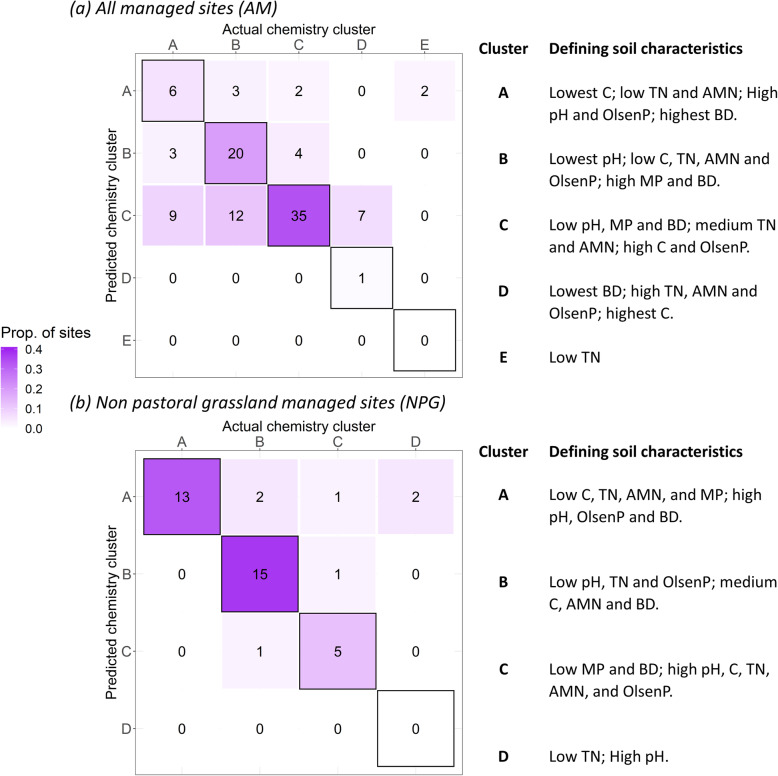
Results: Soil bacterial community composition was strongly linked to land use, to the extent where it could correctly determine the type of land use with 85% accuracy. Despite the inherent variation introduced by sampling across ~ 1300 km distance gradient, the bacterial communities could also be used to differentiate sites grouped by key physico-chemical properties with up to 83% accuracy. Further, individual soil variables such as soil pH, nutrient concentrations and bulk density could be predicted; the correlations between predicted and true values ranged from weak (R2 value = 0.35) to strong (R2 value = 0.79). These predictions were accurate enough to allow bacterial communities to assign the correct soil quality scores with 50-95% accuracy.

Conclusions: The inclusion of biological information when monitoring soil quality is crucial if we wish to gain a better, more accurate understanding of how land management impacts the soil ecosystem. We have shown that soil bacterial communities can provide biologically relevant insights on the impacts of land use on soil ecosystems. Furthermore, their ability to indicate changes in individual soil parameters shows that analysing bacterial DNA data can be used to screen soil quality. Video Abstract.

Keywords: Bacterial communities; Bacterial indicators; Biomonitoring; Environmental monitoring; Random forest analysis; Soil health; Soil microbiology.


Conflict of interest statement

The authors declare that they have no competing interests

Figures

Fig. 1
Fig. 1
Summary of the steps taken to produce the random forest models. A range of models were created, based on three different subsets of the data: all native and managed sites, all managed (AM) sites only, or non-pastoral grassland (NPG) managed sites only. Random forest analyses were performed using the ‘randomForest’ package with default parameters (Liaw and Wiener 2002)
Fig. 2
Fig. 2
a Relative compositional differences (Bray-Curtis dissimilarity) between bacterial community composition at sites with different land uses. Vectors represent soil environmental variables which significantly correlated with the ordination (P < 0.05 based on 999 permutations); variables in black represent those with well-defined soil quality guidelines which were therefore used in subsequent modelling. Stress value for the ordination was 0.14. b The number of correct (n = 103) and incorrect (n = 18) predictions of land use type, based on a random forest classification of bacterial community data. Black borders indicate correct classifications
Fig. 3
Fig. 3
The number of correct and incorrect predictions of the chemistry cluster to which a site belongs, based on a random forest classification of bacterial community data. Models were based on either a all sites belonging to all managed (AM) land use type (horticulture, exotic or pastoral grassland) or b sites belonging to non-pastoral grassland (NPG) managed land uses. Black borders indicate correct classifications (an = 62 out of 104; bn = 33 out of 40). Each cluster can be defined by the soil characteristics of the sites within those clusters, as indicated to the right of each matrix
Fig. 4
Fig. 4
Predicted ag soil variable values or h, i PCA axes scores based on random forest regression analyses versus actual values. Models were based on either (in grey) all sites belonging to a managed land use type (AM; horticulture, exotic or pastoral grassland) or (in green) sites belonging to non-pastoral grassland managed land uses (NPG). Dashed black lines indicate where points should fall for a perfect prediction. Adjusted R2 and slope values for each linear regression are indicated on the plots
Fig. 5
Fig. 5
Phylum-level classification of the OTUs which comprised the top 15 most important taxa for each random forest model. a The models for which each OTU was important. b The total number of models for which each OTU was important, while there were nine models (one for each soil variable predicted), no single OTU was important in more than six models
Fig. 6
Fig. 6
The accuracy of the soil variable quality scores calculated from the models in Fig. 4a–g. Soil quality categories for each variable were calculated while considering land use type and/or soil type. Predicted soil variables resulted in either the correct quality score (according to the quality score assigned to the actual value), a worse or better quality category, or a quality category of equal magnitude but the wrong direction (e.g. extremely high when the real score was extremely low). Detailed thresholds for each variable can be found in Tables S3-9 (Additional file 1)

References

    1. Doran JW, Zeiss MR (2000) Soil health and sustainability: managing the biotic component of soil quality. Appl Soil Ecol 15:3–11. 10.1016/S0929-1393(00)00067-6.
    1. Oliver MA, Gregory PJ. Soil, food security and human health: a review. Eur J Soil Sci. 2015;66:257–276. doi: 10.1111/ejss.12216. - DOI
    1. Wolters V (2001) Biodiversity of soil animals and its function. Eur J Soil Biol 37:221–227. 10.1016/S1164-5563(01)01088-3.
    1. Ranjard L, Poly F, Nazaret S (2000) Monitoring complex bacterial communities using culture-independent molecular techniques: application to soil environment. Res Microbiol 151:167–177. 10.1016/S0923-2508(00)00136-4. - PubMed
    1. Compant S, Duffy B, Nowak J, et al. Use of plant growth-promoting bacteria for biocontrol of plant diseases: principles, mechanisms of action, and future prospects. Appl Environ Microbiol. 2005;71:4951–4959. doi: 10.1128/AEM.71.9.4951-4959.2005. - DOI - PMC - PubMed

Publication types

LinkOut - more resources