

Expanded Imaging Classification of Autosomal Dominant Polycystic Kidney Disease
- PMID: 32487558
- PMCID: PMC7350997
- DOI: 10.1681/ASN.2019101121
Expanded Imaging Classification of Autosomal Dominant Polycystic Kidney Disease
Abstract
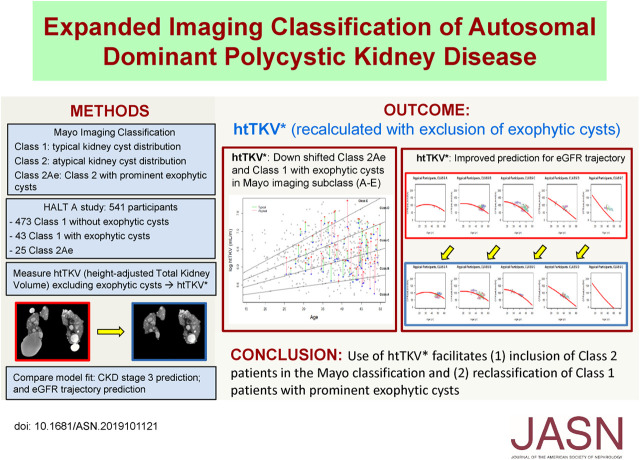
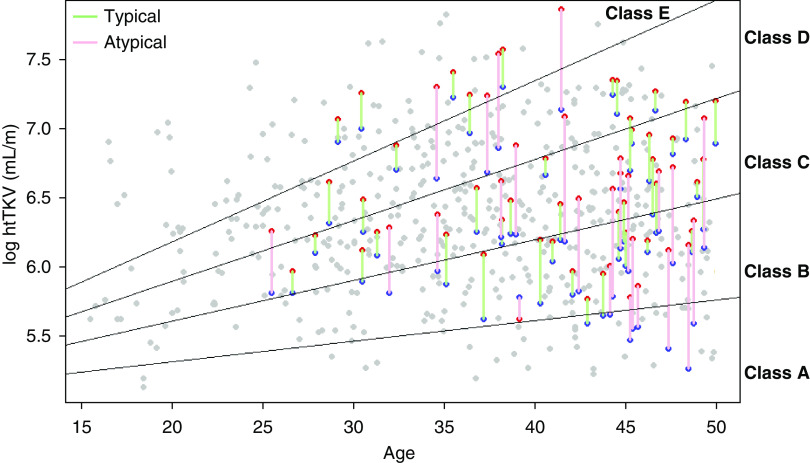
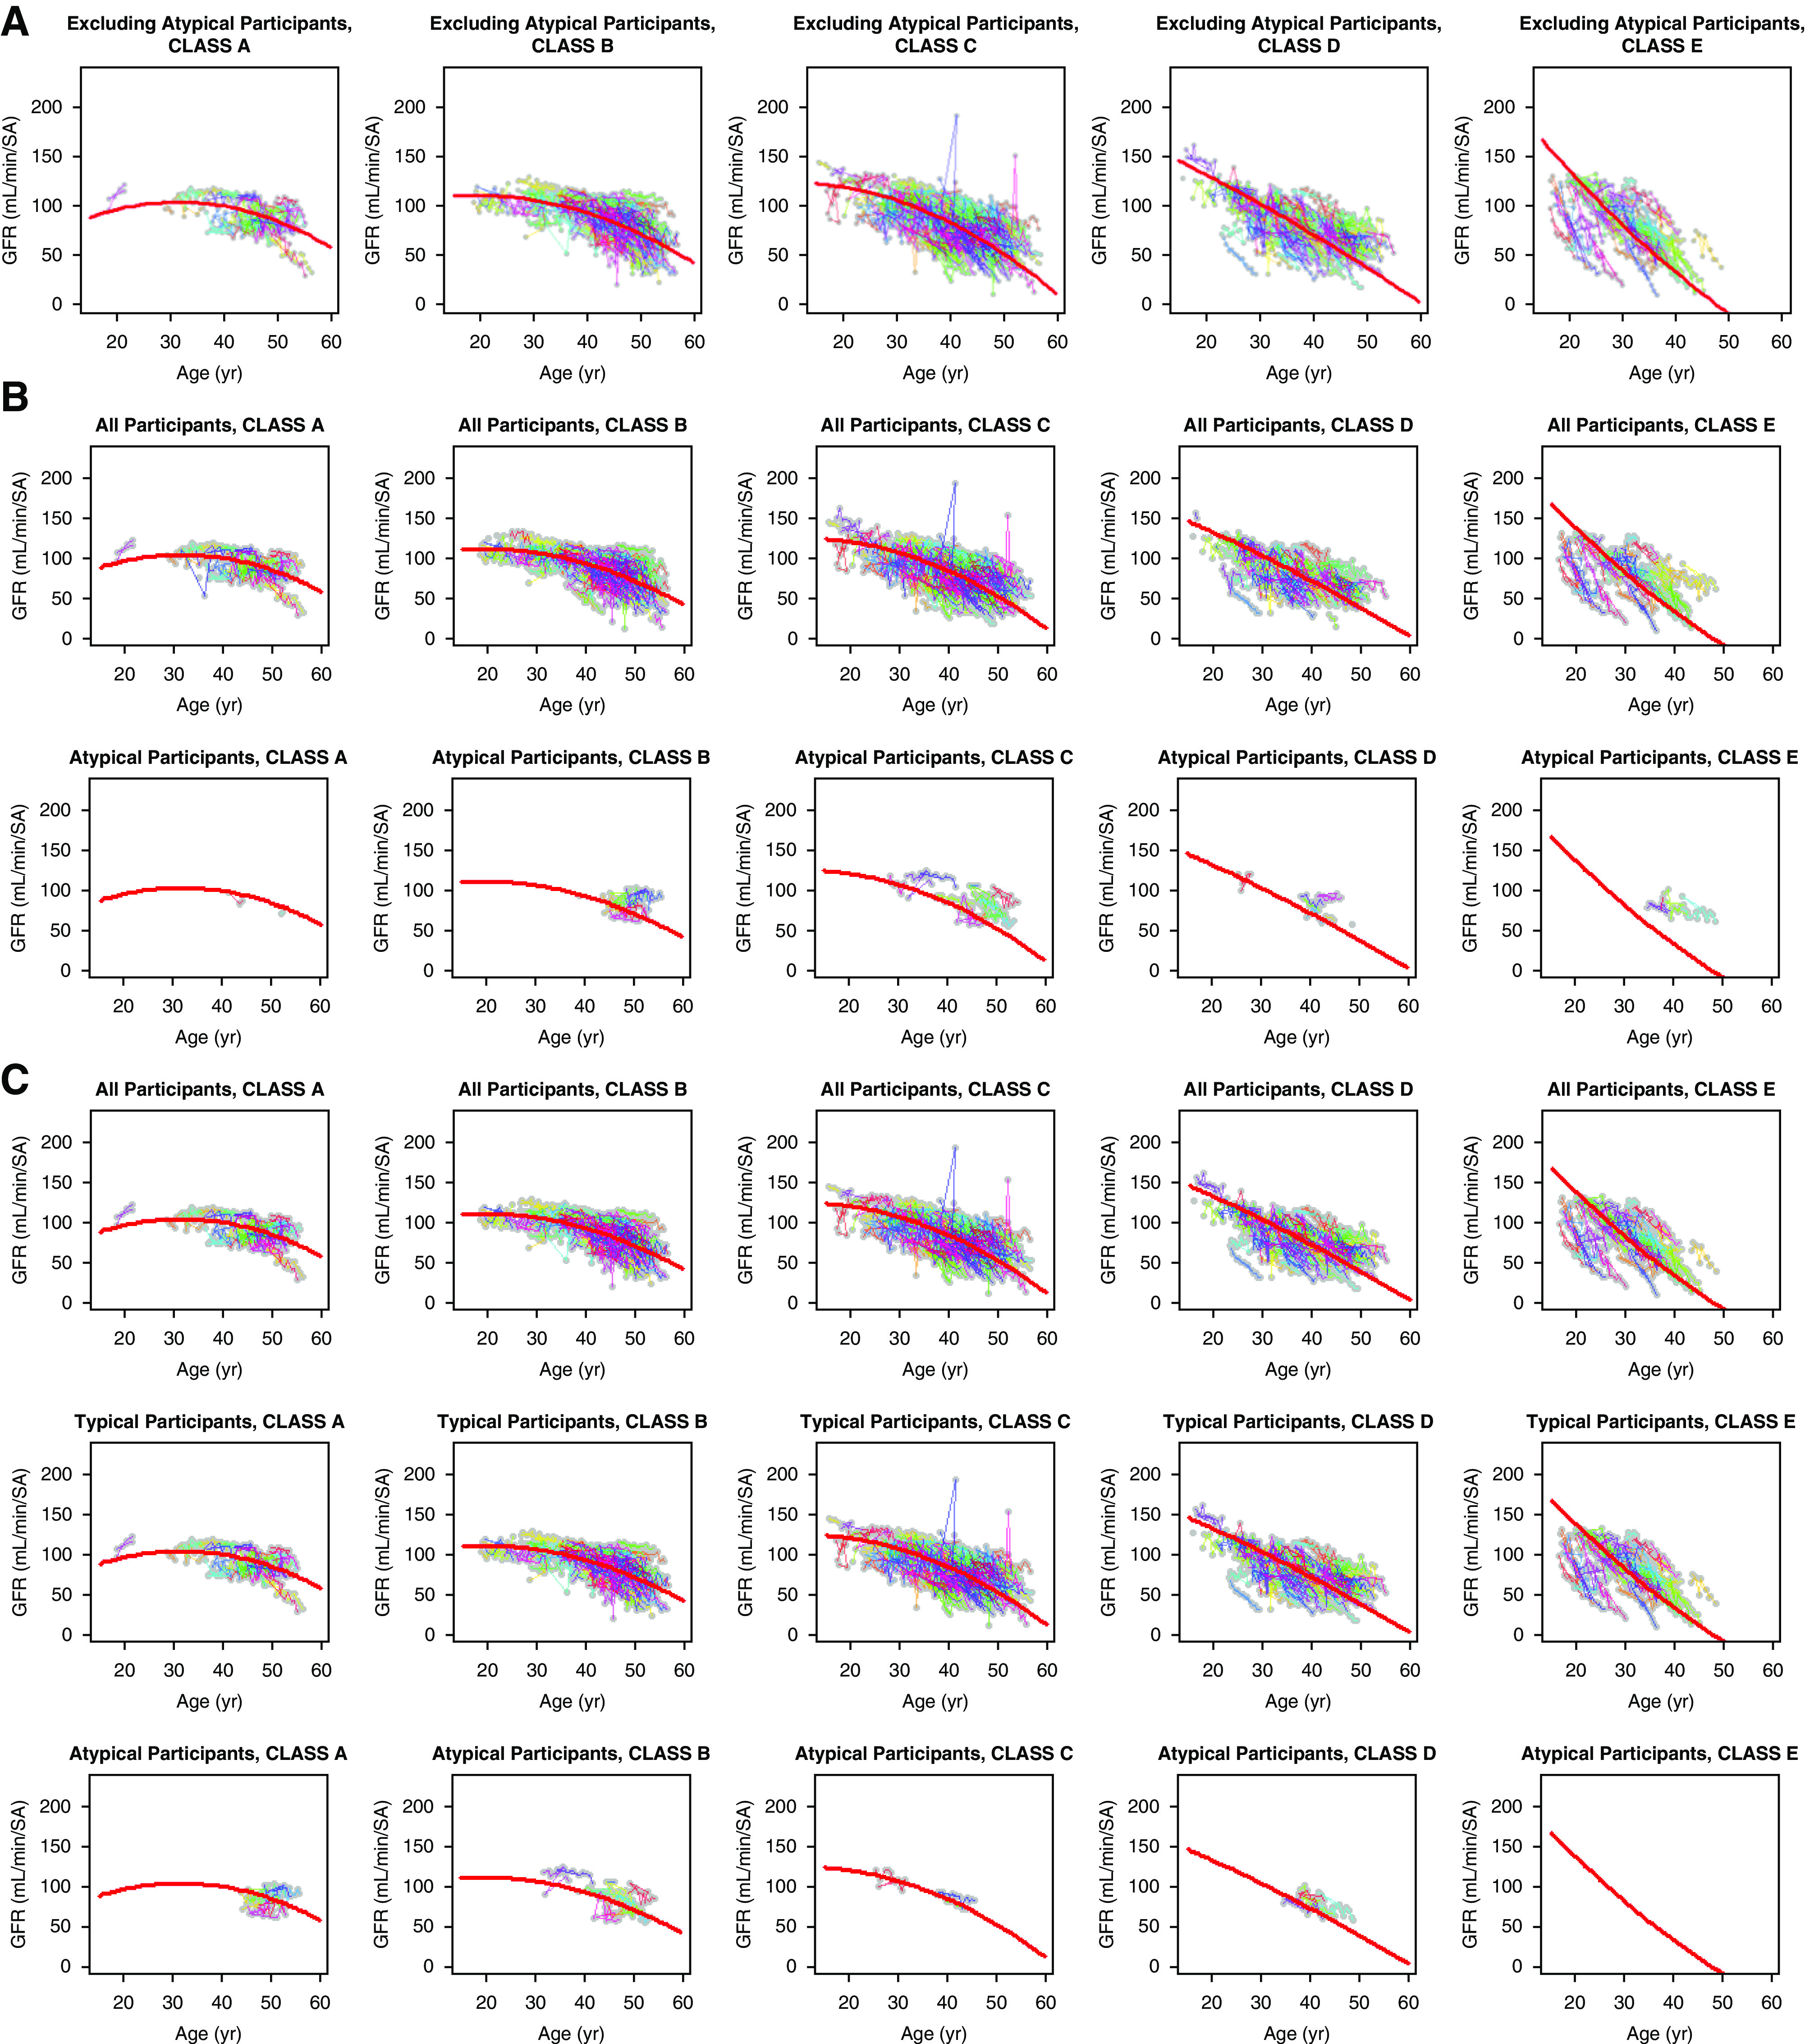
Background: The Mayo Clinic imaging classification of autosomal dominant polycystic kidney disease (ADPKD) uses height-adjusted total kidney volume (htTKV) and age to identify patients at highest risk for disease progression. However, this classification applies only to patients with typical diffuse cystic disease (class 1). Because htTKV poorly predicts eGFR decline for the 5%-10% of patients with atypical morphology (class 2), imaging-based risk modeling remains unresolved.
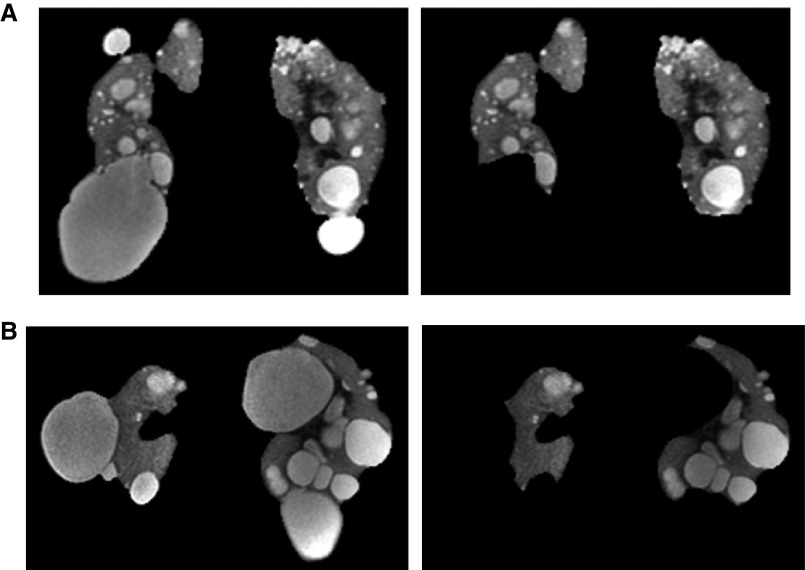
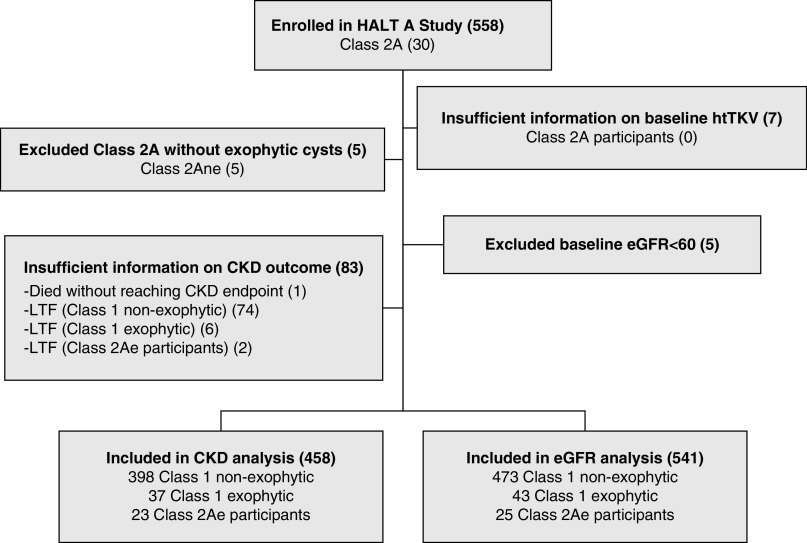
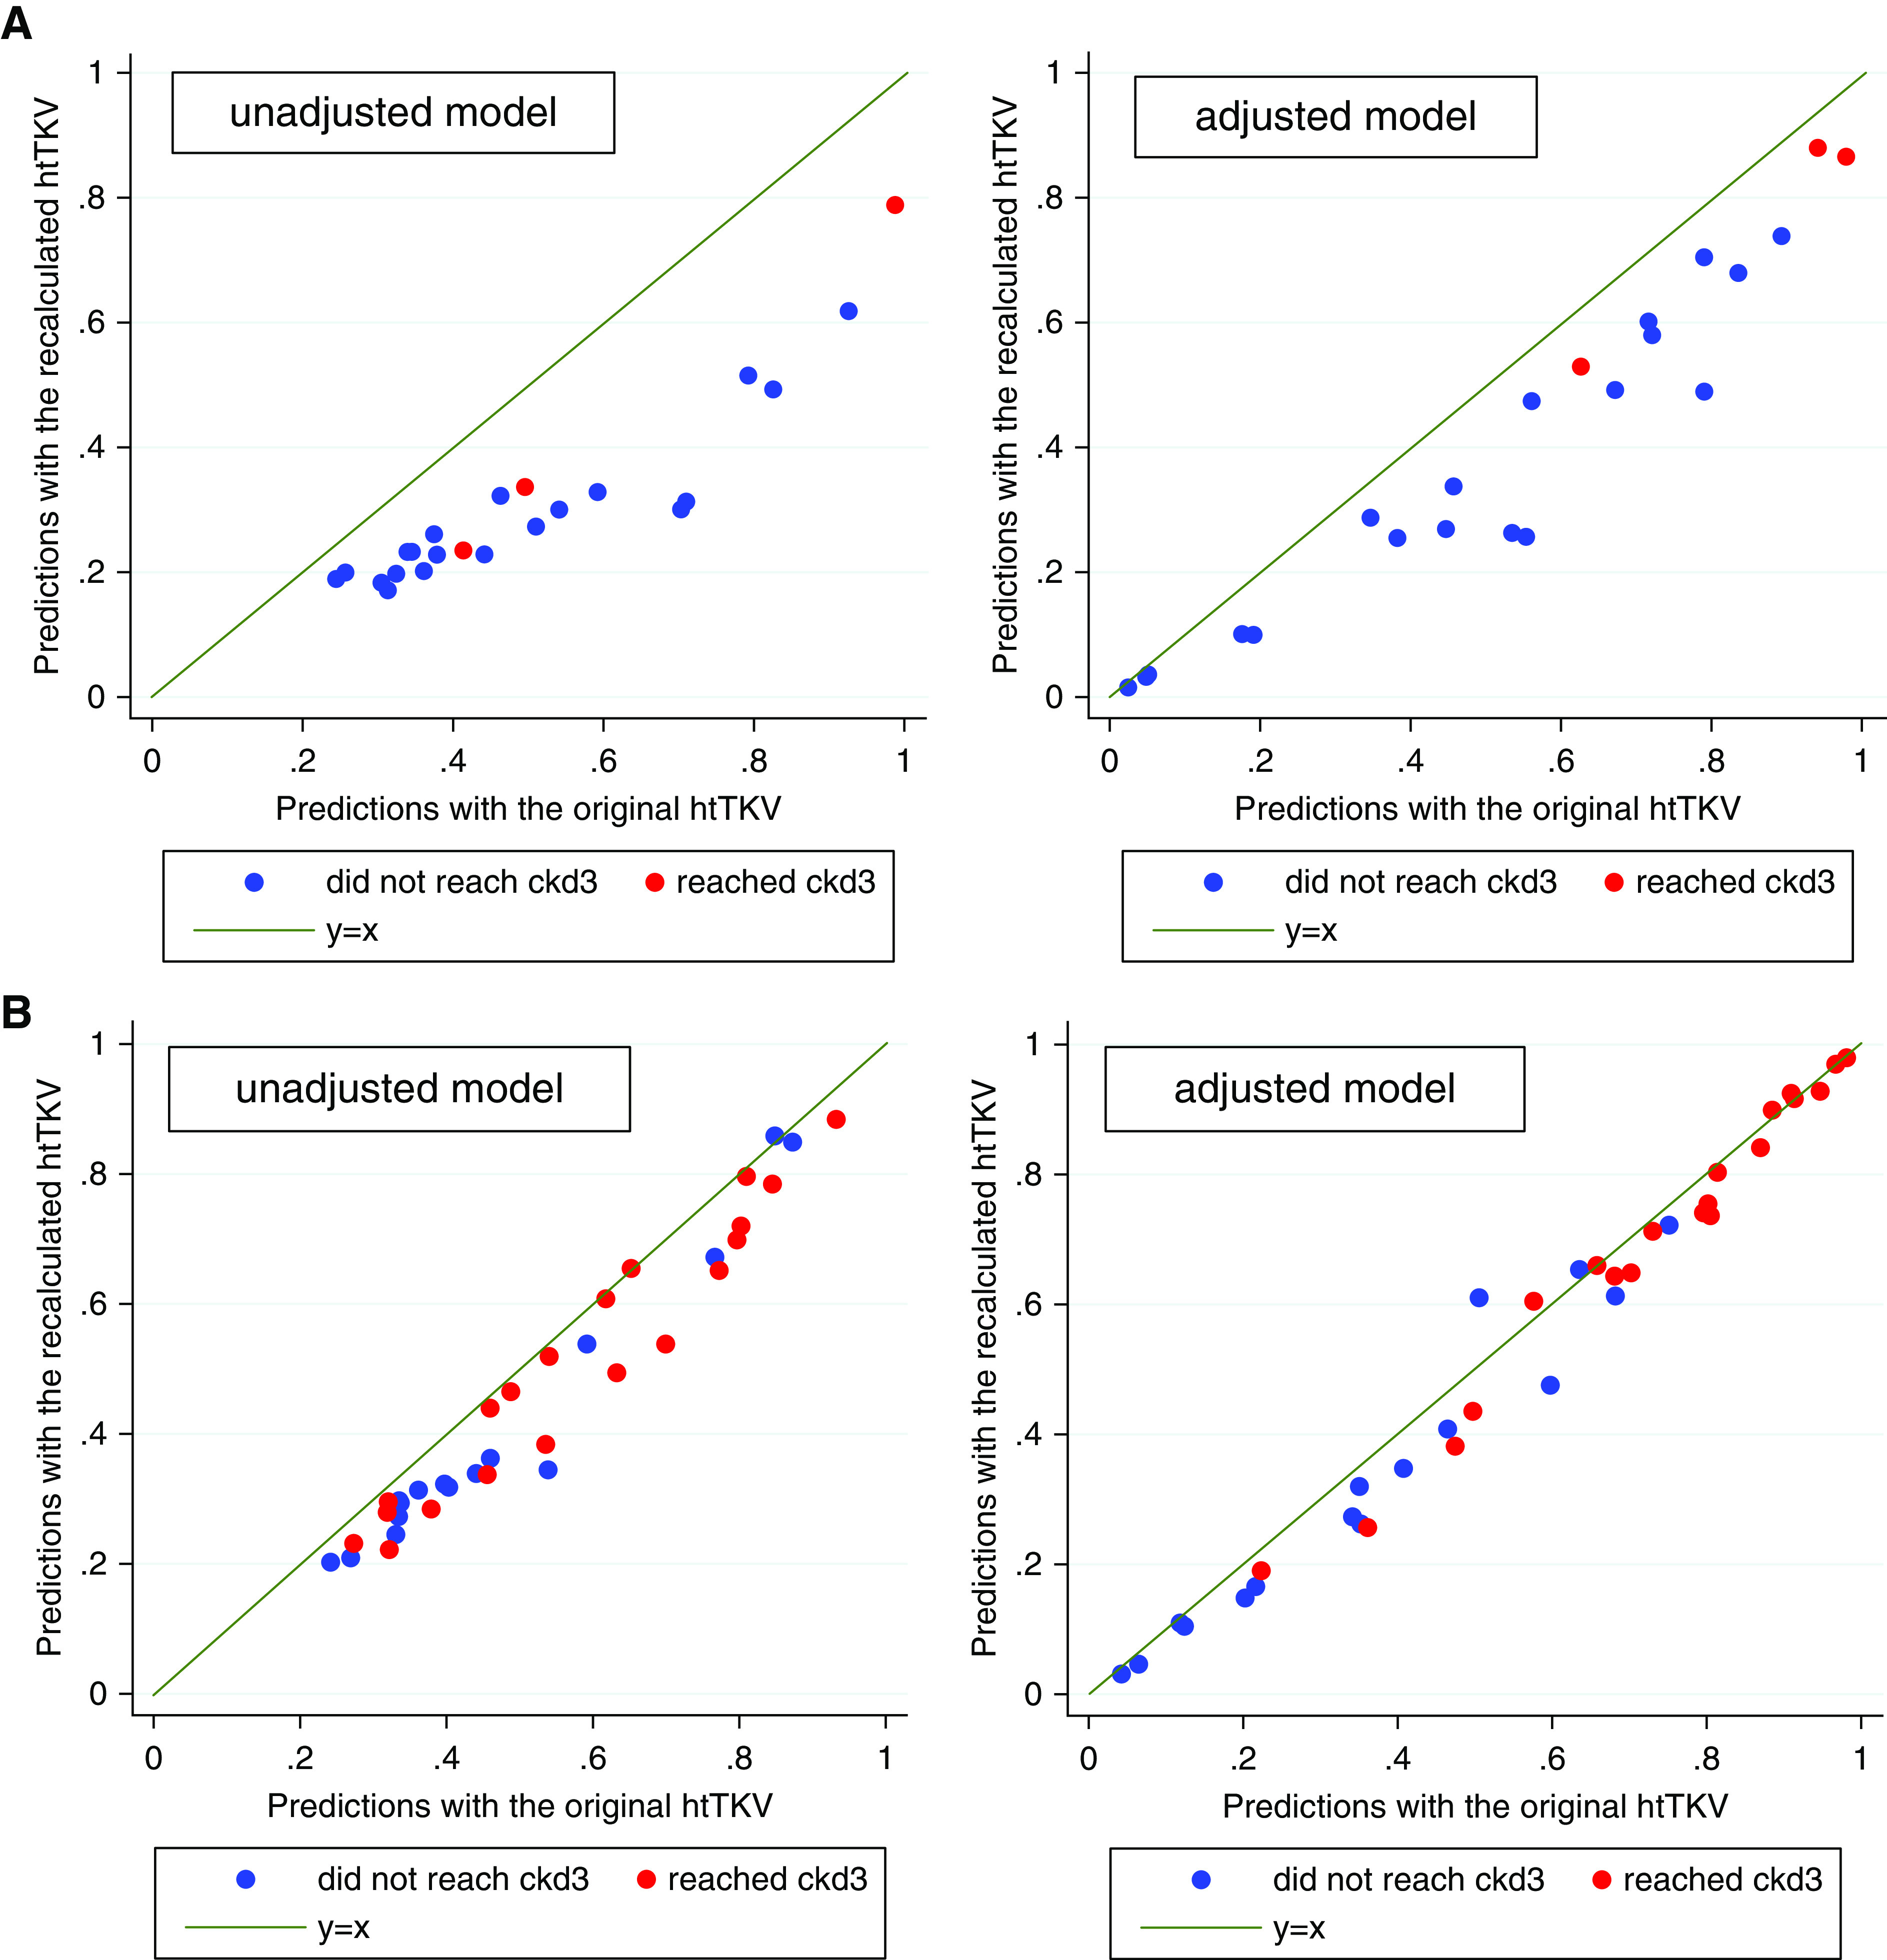
Methods: Of 558 adults with ADPKD in the HALT-A study, we identified 25 patients of class 2A with prominent exophytic cysts (class 2Ae) and 43 patients of class 1 with prominent exophytic cysts; we recalculated their htTKVs to exclude exophytic cysts. Using original and recalculated htTKVs in association with imaging classification in logistic and mixed linear models, we compared predictions for developing CKD stage 3 and for eGFR trajectory.
Results: Using recalculated htTKVs increased specificity for developing CKD stage 3 in all participants from 82.6% to 84.2% after adjustment for baseline age, eGFR, BMI, sex, and race. The predicted proportion of class 2Ae patients developing CKD stage 3 using a cutoff of 0.5 for predicting case status was better calibrated to the observed value of 13.0% with recalculated htTKVs (45.5%) versus original htTKVs (63.6%). Using recalculated htTKVs reduced the mean paired difference between predicted and observed eGFR from 17.6 (using original htTKVs) to 4.0 ml/min per 1.73 m2 for class 2Ae, and from -1.7 (using original htTKVs) to 0.1 ml/min per 1.73 m2 for class 1.
Conclusions: Use of a recalculated htTKV measure that excludes prominent exophytic cysts facilitates inclusion of class 2 patients and reclassification of class 1 patients in the Mayo classification model.
Keywords: ADPKD; clinical trial; kidney volume; risk factors.
Copyright © 2020 by the American Society of Nephrology.
Figures
References
-
- Ong AC, Devuyst O, Knebelmann B, Walz G; ERA-EDTA Working Group for Inherited Kidney Diseases : Autosomal dominant polycystic kidney disease: The changing face of clinical management [published correction appears in Lancet 385: 2576, 2015]. Lancet 385: 1993–2002, 2015. - PubMed
-
- Xue C, Zhou C, Mei C: Total kidney volume: The most valuable predictor of autosomal dominant polycystic kidney disease progression. Kidney Int 93: 540–542, 2018. - PubMed
-
- Alam A, Dahl NK, Lipschutz JH, Rossetti S, Smith P, Sapir D, et al. .: Total kidney volume in autosomal dominant polycystic kidney disease: A biomarker of disease progression and therapeutic efficacy. Am J Kidney Dis 66: 564–576, 2015. - PubMed
-
- Yu ASL, Shen C, Landsittel DP, Harris PC, Torres VE, Mrug M, et al. . Consortium for Radiologic Imaging Studies of Polycystic Kidney Disease (CRISP) : Baseline total kidney volume and the rate of kidney growth are associated with chronic kidney disease progression in Autosomal Dominant Polycystic Kidney Disease. Kidney Int 93: 691–699, 2018. - PMC - PubMed
Publication types
MeSH terms
Grants and funding
LinkOut - more resources
Full Text Sources
Medical
Research Materials
Miscellaneous
