. 2020 Jul 8;40(28):5443-5454.
doi: 10.1523/JNEUROSCI.2993-19.2020. Epub 2020 Jun 2.

Functional Localization of an Attenuating Filter within Cortex for a Selective Detection Task in Mice

Affiliations

Functional Localization of an Attenuating Filter within Cortex for a Selective Detection Task in Mice

Krithiga Aruljothi et al. J Neurosci. .

Abstract

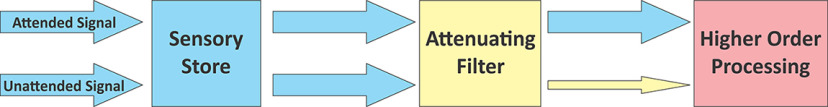
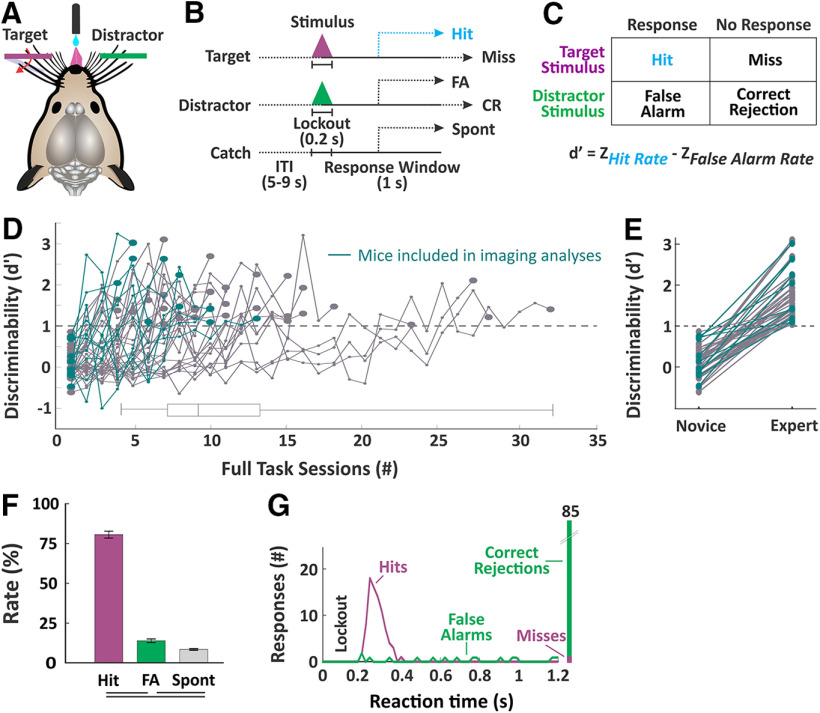
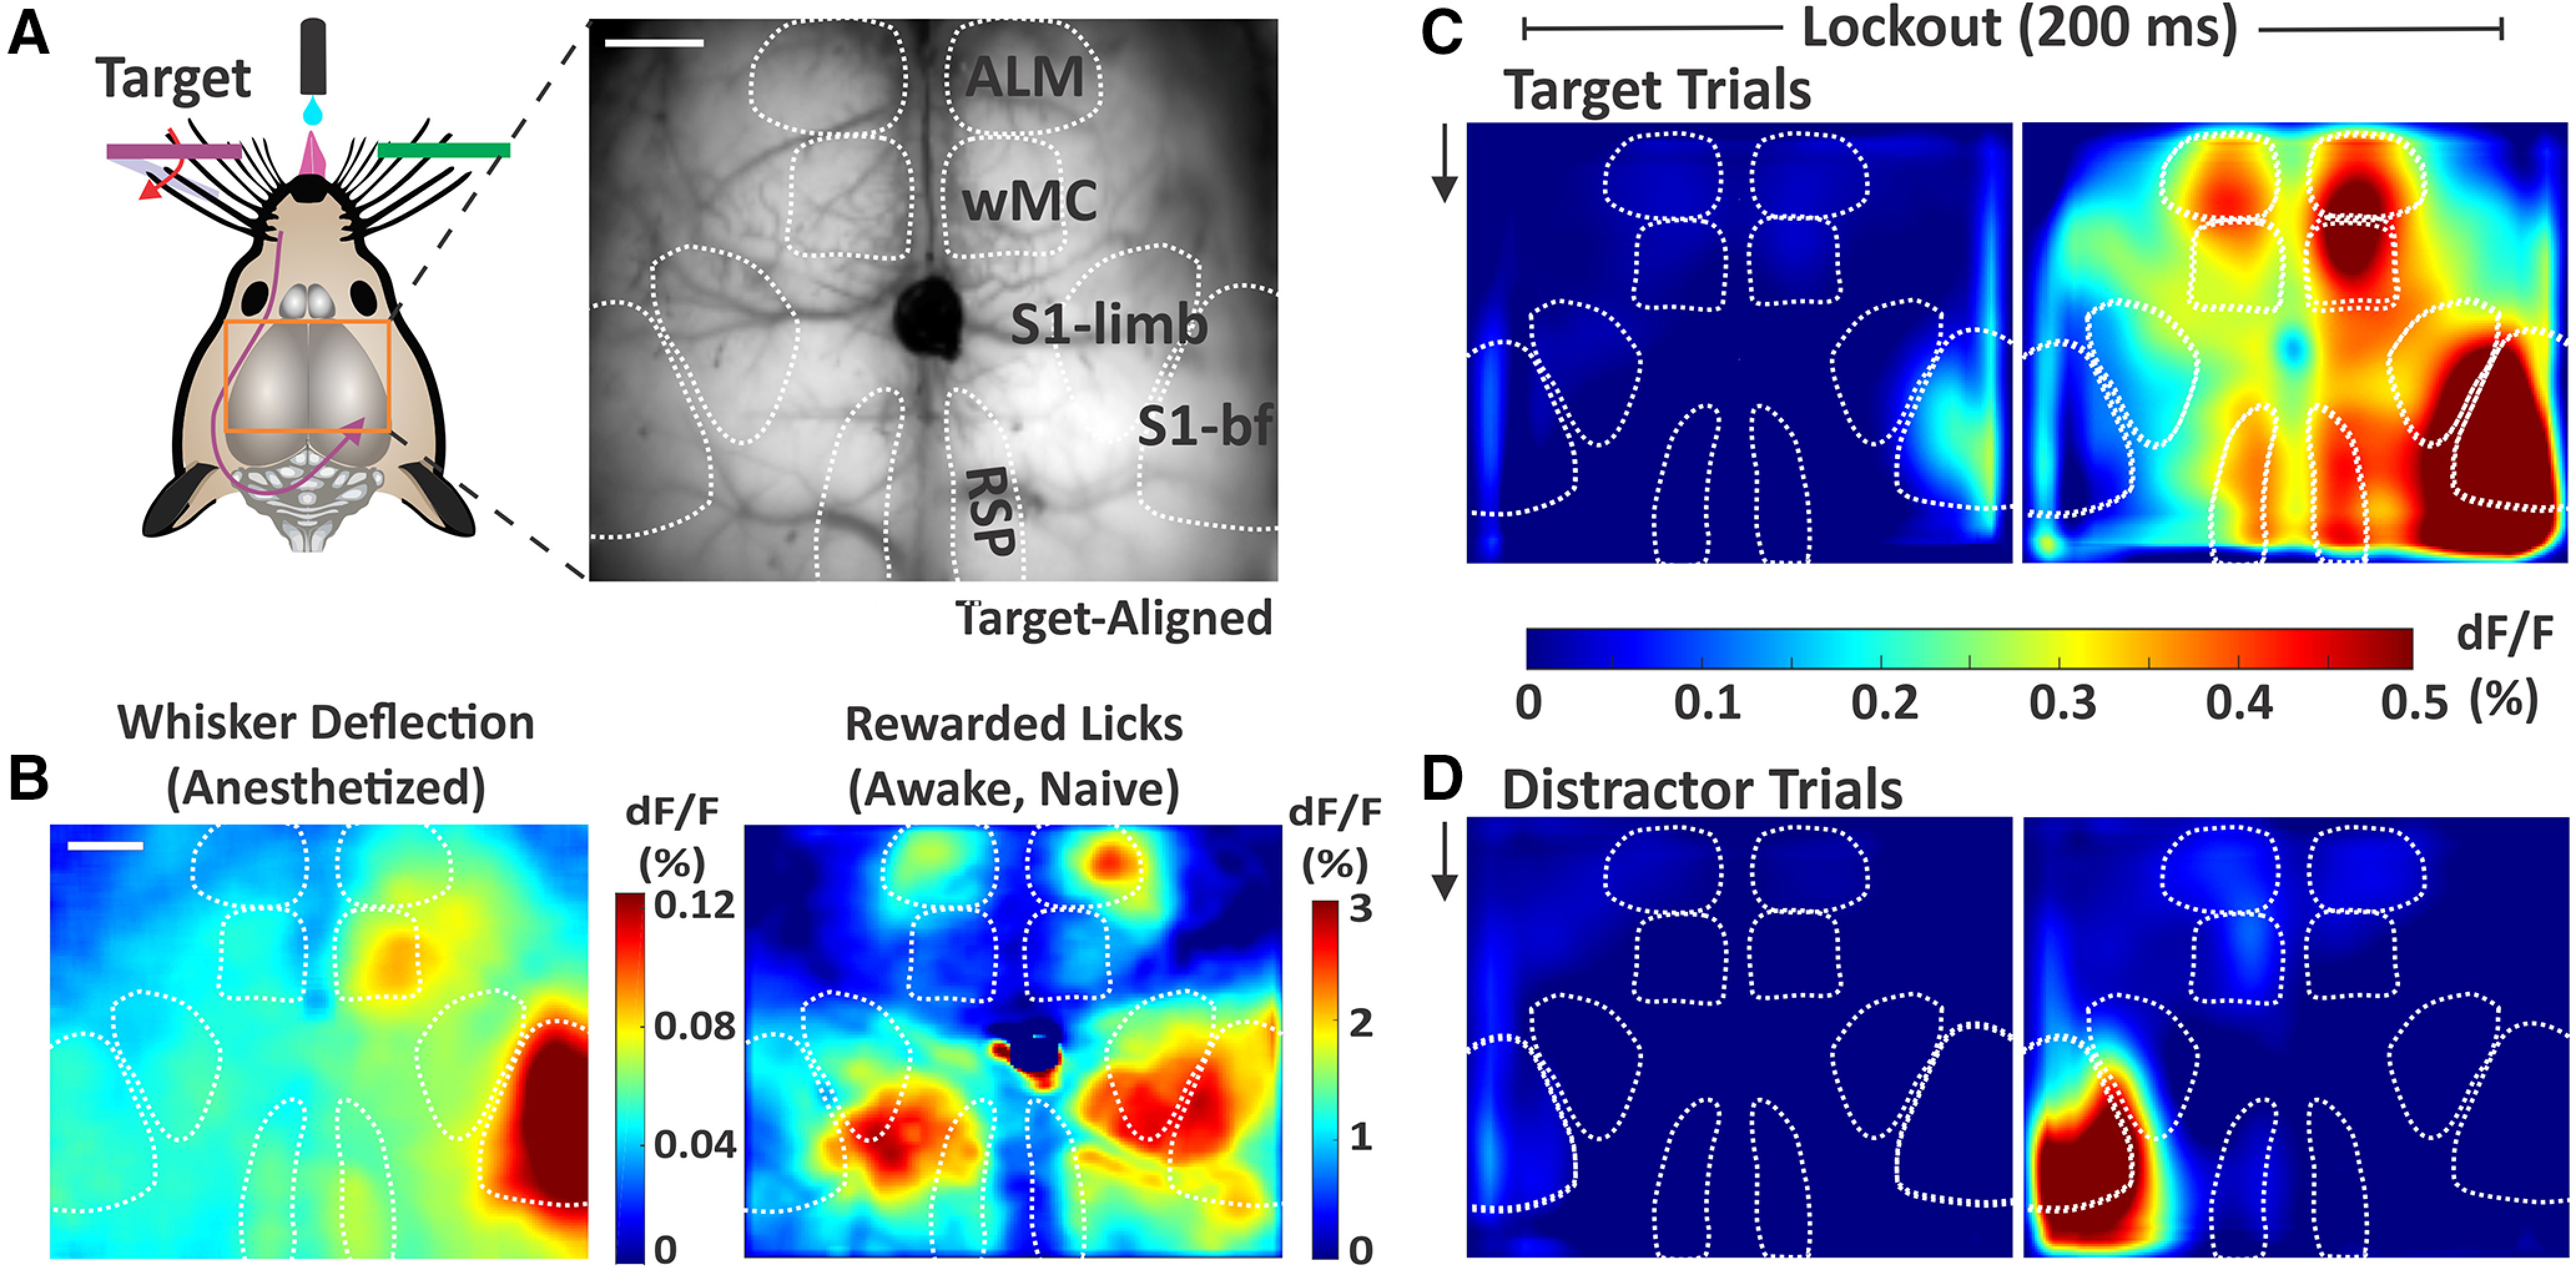
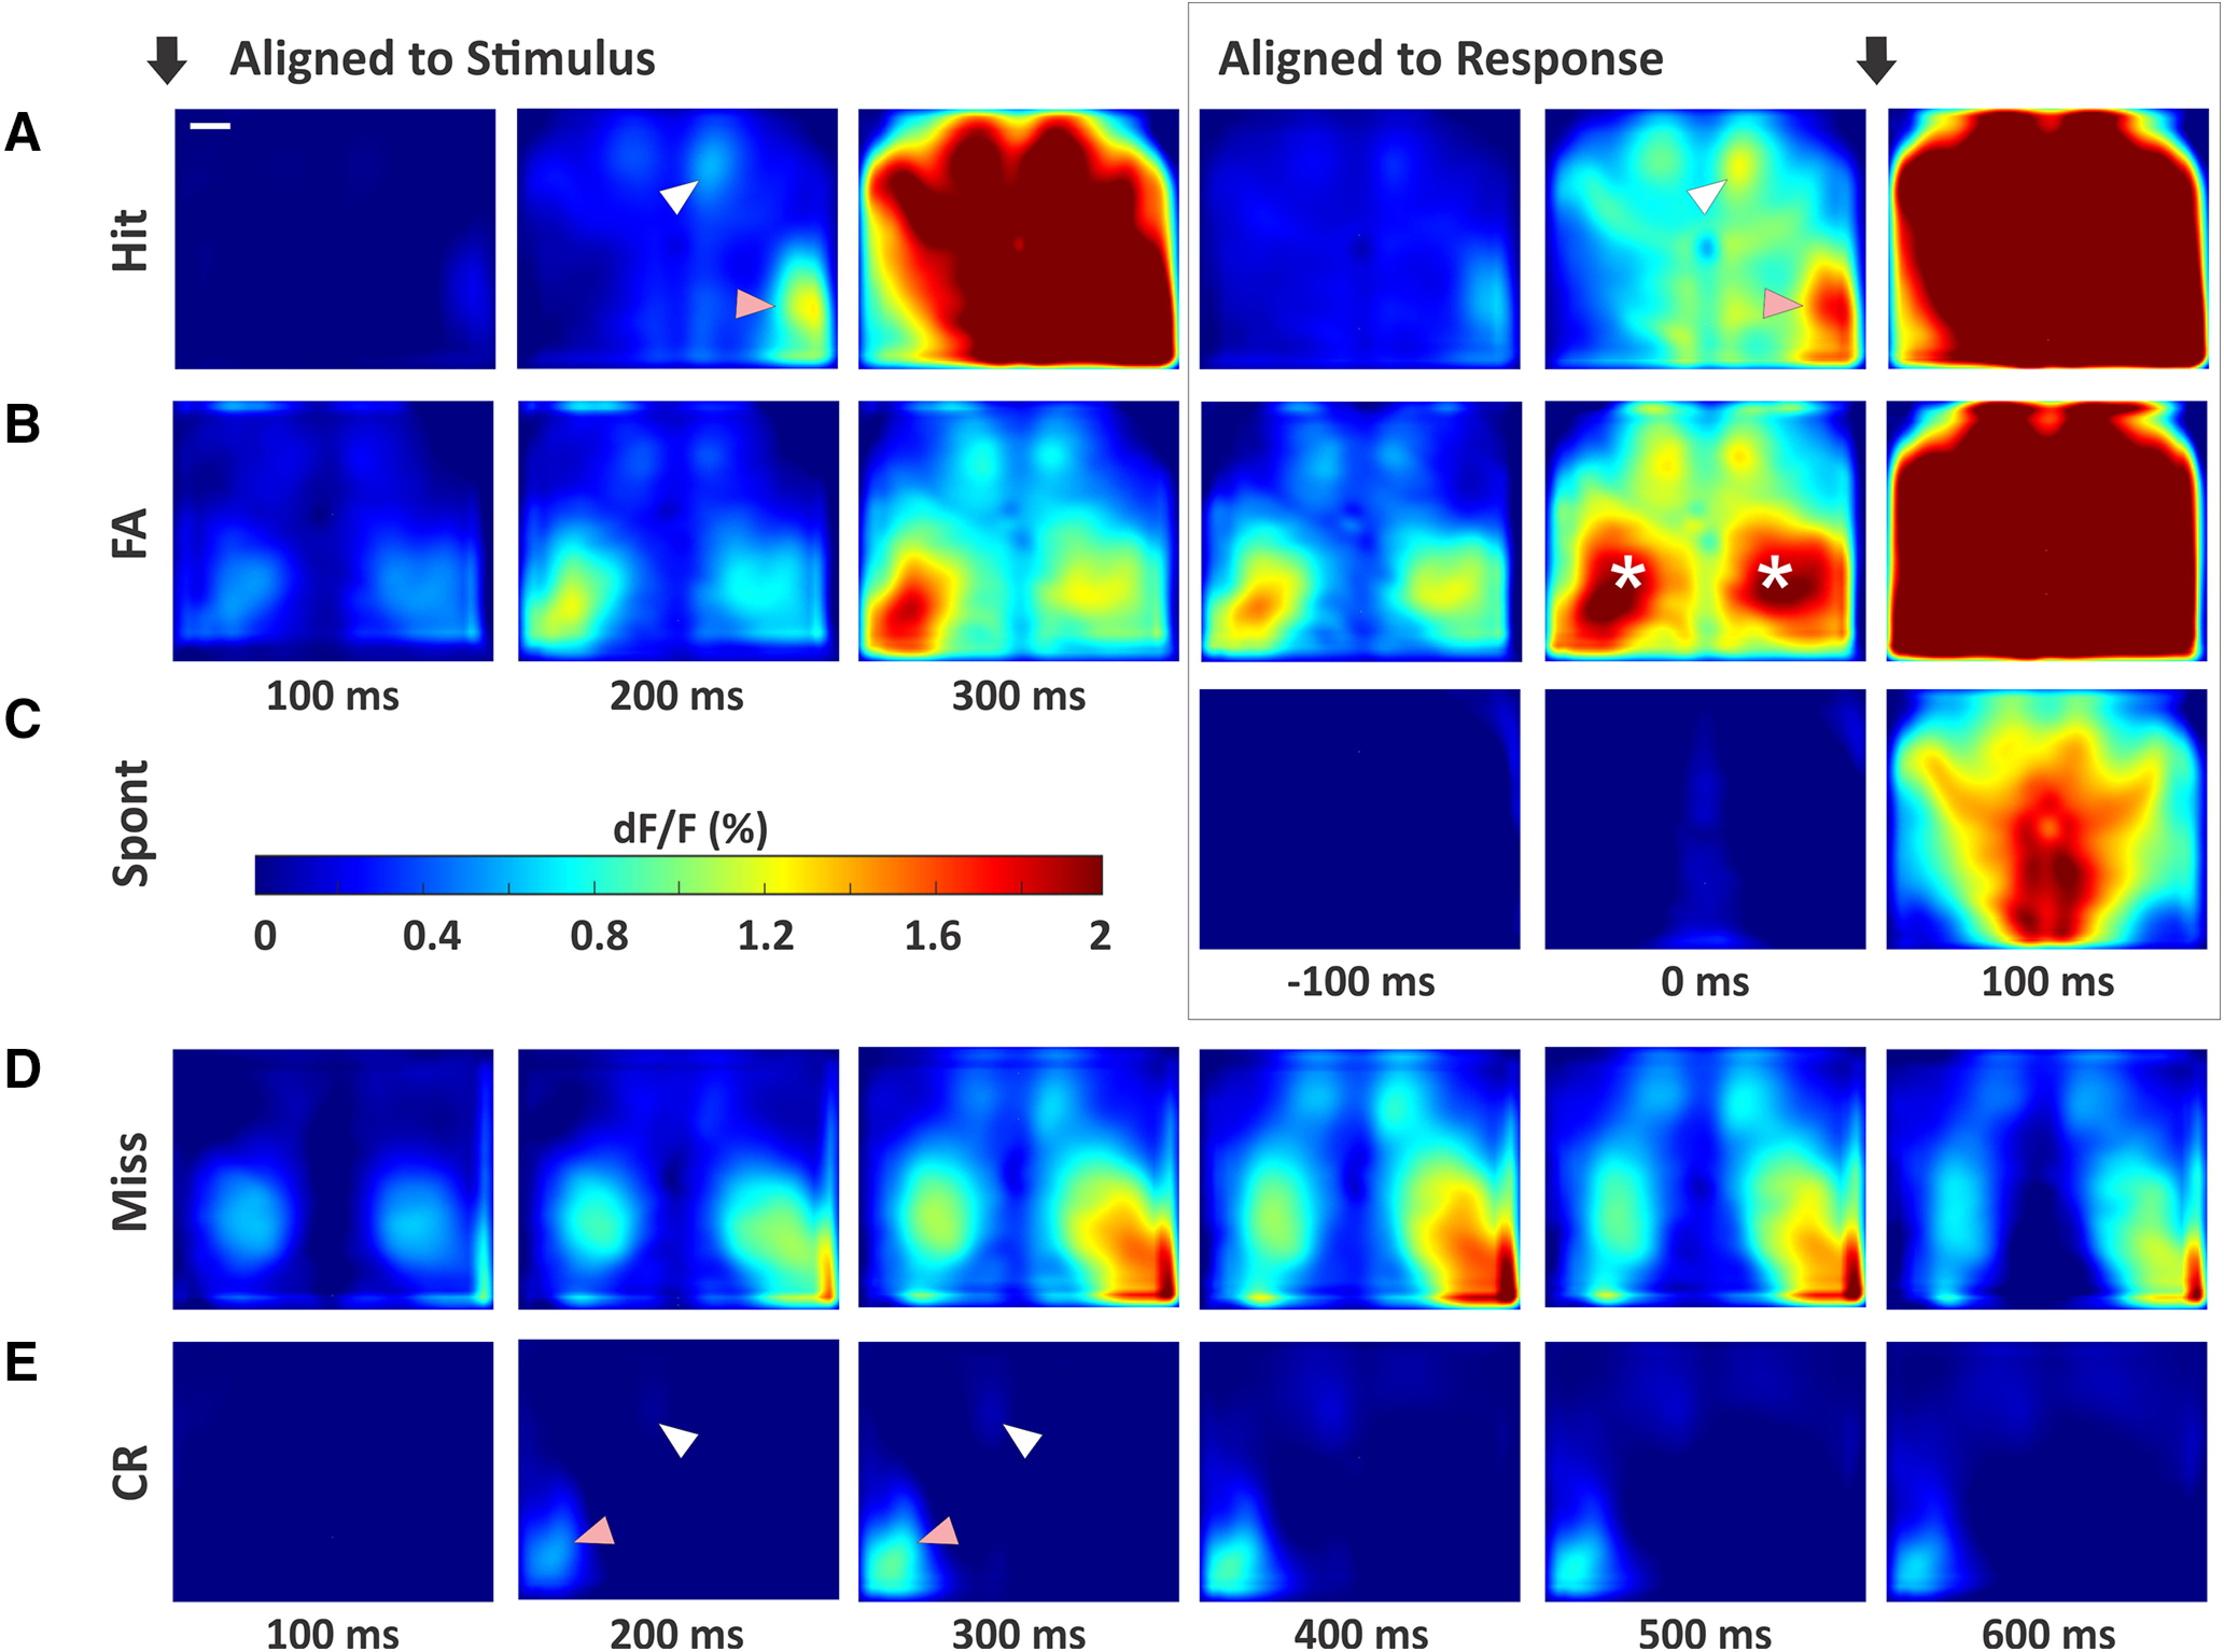
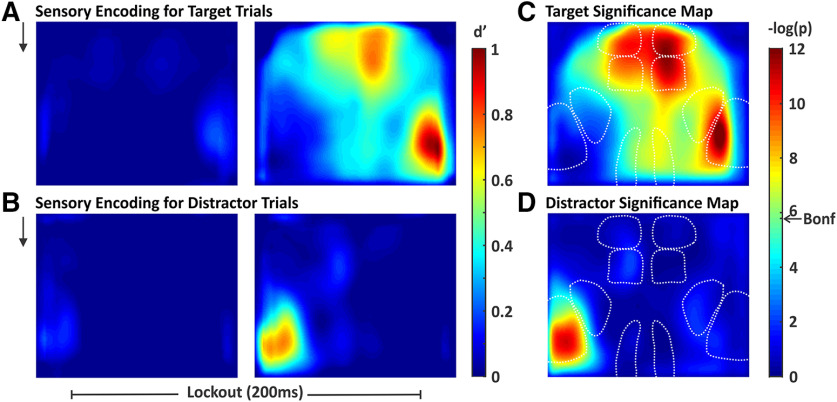
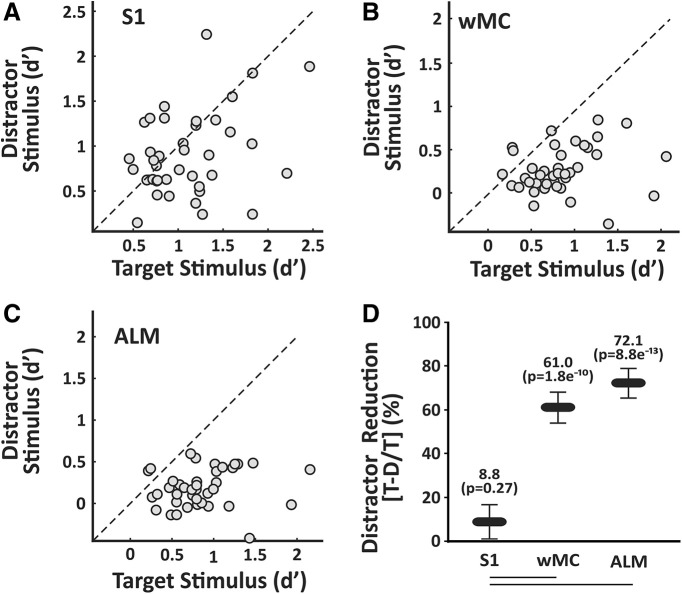
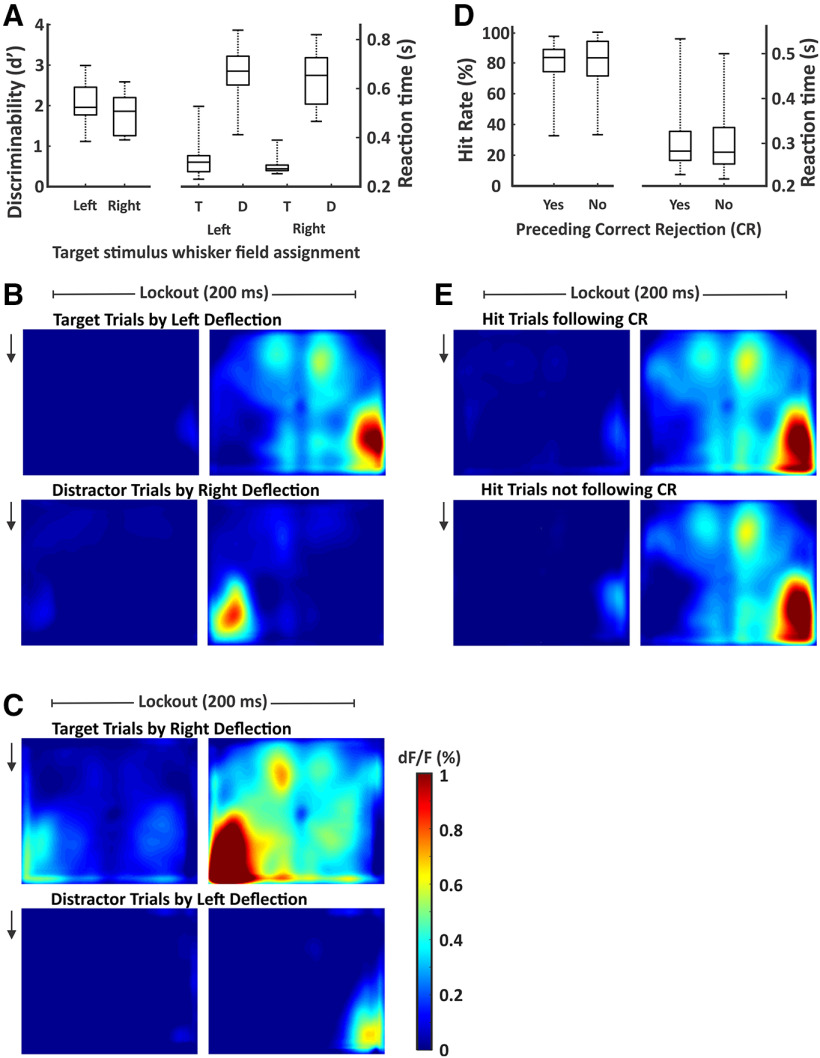
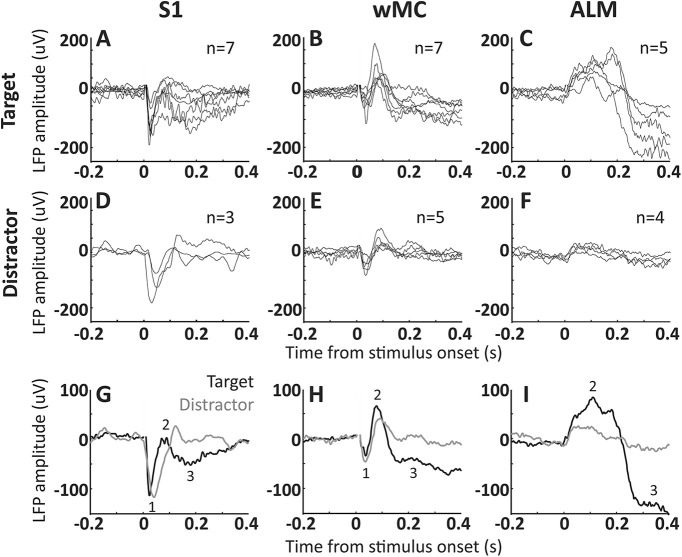
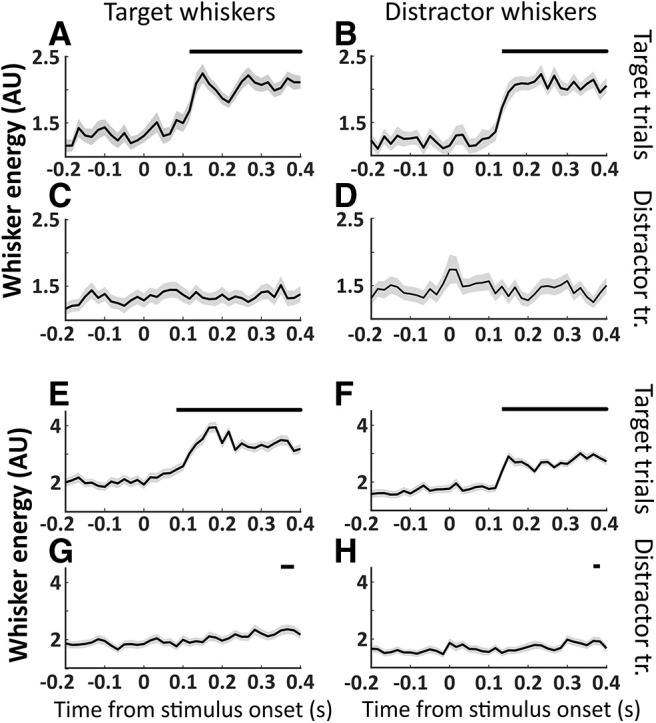
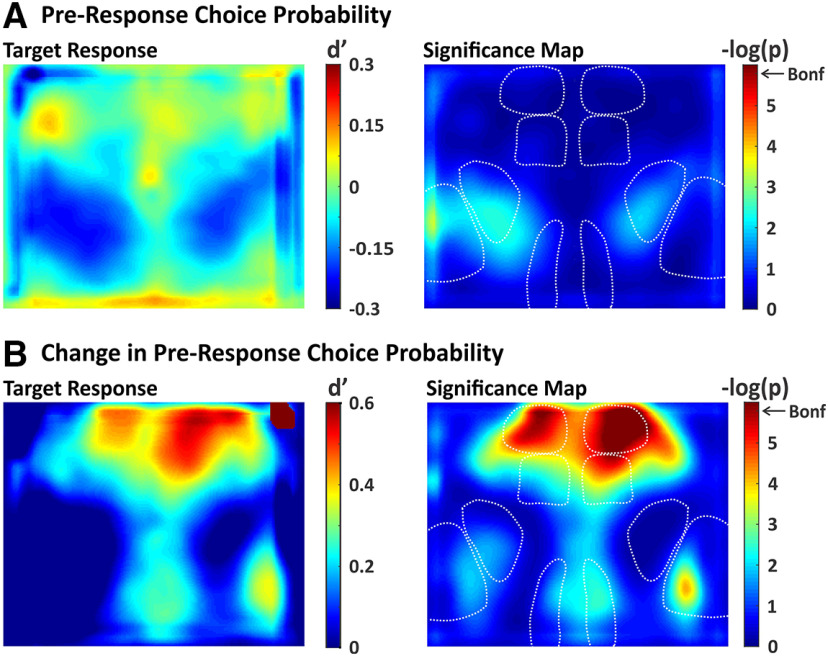
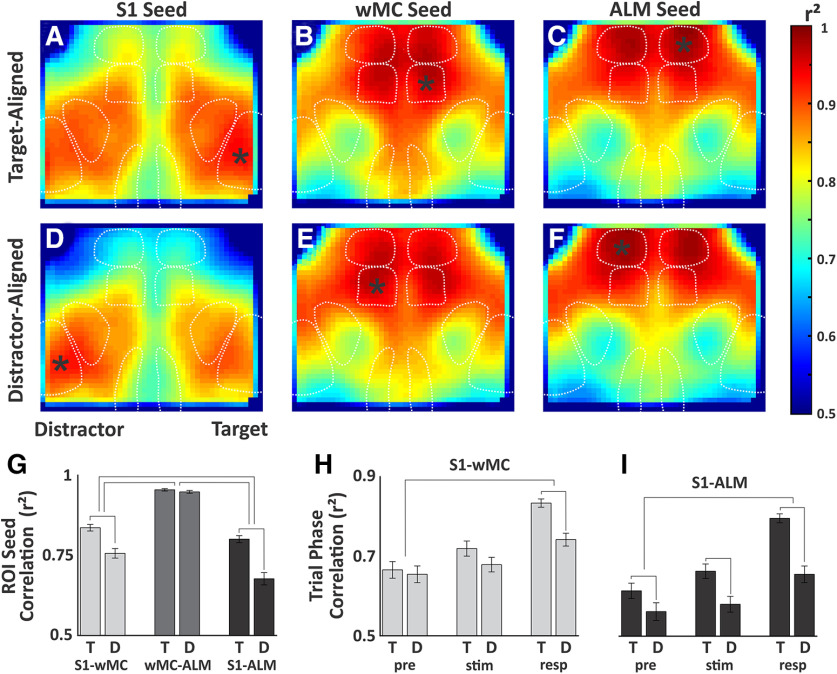
An essential feature of goal-directed behavior is the ability to selectively respond to the diverse stimuli in one's environment. However, the neural mechanisms that enable us to respond to target stimuli while ignoring distractor stimuli are poorly understood. To study this sensory selection process, we trained male and female mice in a selective detection task in which mice learn to respond to rapid stimuli in the target whisker field and ignore identical stimuli in the opposite, distractor whisker field. In expert mice, we used widefield Ca2+ imaging to analyze target-related and distractor-related neural responses throughout dorsal cortex. For target stimuli, we observed strong signal activation in primary somatosensory cortex (S1) and frontal cortices, including both the whisker region of primary motor cortex (wMC) and anterior lateral motor cortex (ALM). For distractor stimuli, we observed strong signal activation in S1, with minimal propagation to frontal cortex. Our data support only modest subcortical filtering, with robust, step-like attenuation in distractor processing between mono-synaptically coupled regions of S1 and wMC. This study establishes a highly robust model system for studying the neural mechanisms of sensory selection and places important constraints on its implementation.SIGNIFICANCE STATEMENT Responding to task-relevant stimuli while ignoring task-irrelevant stimuli is critical for goal-directed behavior. However, the neural mechanisms involved in this selection process are poorly understood. We trained mice in a detection task with both target and distractor stimuli. During expert performance, we measured neural activity throughout cortex using widefield imaging. We observed responses to target stimuli in multiple sensory and motor cortical regions. In contrast, responses to distractor stimuli were abruptly suppressed beyond sensory cortex. Our findings localize the sites of attenuation when successfully ignoring a distractor stimulus and provide essential foundations for further revealing the neural mechanism of sensory selection and distractor suppression.

Keywords: attenuating filter; neocortex; sensorimotor; sensory selection; somatosensory; widefield imaging.


Figures

Figure 1.
Figure 1.
Treisman attenuation model. This model of selective attention proposes that both attended and unattended signals enter an early sensory store. At some point in the processing stream, however, an attenuating filter suppresses unattended signals while allowing attended signals to propagate forward for higher order processing.
Figure 2.
Figure 2.
Behavior paradigm and measures of selective detection. A, Illustration of the behavioral setup. Mice are head-fixed in the behavioral rig with piezo-controlled paddles within their whisker fields bilaterally. Each paddle is assigned as target (purple) or distractor (green) at the start of training. Mice report stimulus detection and receive rewards from a central lickport. B, Task structure. Each trial consists of an intertrial interval, a stimulus and 200-ms lockout, and a 1-s response window. Trial type as determined by the stimulus could be target, distractor or catch (no stimulus). C, Calculation of discriminability d', as the separation between hit rate and false alarm rate. D, Performance trajectories for all mice (n = 43 mice) and box and whiskers summary plot. Those used for imaging studies (n = 5 mice) are indicated in teal. Mice were considered expert once they achieved a d' > 1 for three consecutive days. E, Comparison of d' for novice mice (first day of training on impulse control) and expert mice (n = 43 mice, paired sample t test, p = 3.7e−20, t(42) = 16.71). F, Performance measures for the imaging sessions (n = 39 sessions). Lines below plot denote statistical significance. G, Example session data showing reaction time distributions for target and distractor trials.
Figure 3.
Figure 3.
Sensory and motor cortical representations using widefield Ca2+ imaging. A, Illustration of the imaging setup (left) and example frame from the through-skull GCaMP6s imaging (right). Surface vessels appear as dark striations overlaying the brain parenchyma. Bregma is indicated by the central ink blot. bf, barrel field. B, Cortical activity (dF/F) following whisker deflections in an anesthetized mouse (left), to localize of the sensory and motor whisker representations. Cortical activity following reward-triggered licking in a naive mouse (right), to localize licking-related activity. C, Cortical activity on target trials during the two sequential imaging frames of the lockout period in expert mice performing the detection task (grand average, n = 39 sessions). Black arrow indicates whisker stimulus onset, which is coincident with the start of the first imaging frame. D, Same as C, but for distractor trials. Note the differential propagation of cortical activity depending on trial type. Scale bars in A, B, 1 mm.
Figure 4.
Figure 4.
Cortical activity patterns across all trial types. A, Hit trials. Black arrows indicate alignment to stimulus onset (left three panels) or response onset (right three panels). The third frame aligned to stimulus (300 ms) is the first frame after the lockout and within the response window. Note the strong activity in contralateral S1 (pink arrows) with propagation to wMC (white arrows) and ALM, before response generation. B, False alarm trials, with the same plot structure as in A. Asterisks mark elevated activity in the S1-limb regions, bilaterally. C, Spontaneous trials (no stimulus alignment). D, Miss trials. As there is no response on these trial types, we plot an extended series of poststimulus activity. E, Correct rejection trials, with the same plot structure as in D. Note the strong activity in S1 (pink arrow), yet lack of propagation to wMC (white arrow) and ALM. Scale bar in A, 1 mm.
Figure 5.
Figure 5.
Spatial maps of stimulus encoding. We quantified stimulus encoding as the separation between stimulus absent and stimulus present d', computed pixel-by-pixel. A, Map of target stimulus encoding during the two sequential frames of the lockout period (black arrow represents stimulus onset). B, Map of distractor stimulus encoding during the same time windows as in A. C, D, Significance maps of the right panels of A, B, respectively. Significance threshold determined by the Bonferroni correction for multiple comparisons is indicated by the arrow on the color bar (Bonf). Pixels with smaller p values (warmer colors) have d' values significantly above 0. For target stimuli, we observed widespread stimulus encoding including in multiple frontal and parietal regions. For distractor stimuli, significant stimulus encoding is restricted to S1.
Figure 6.
Figure 6.
Quantification of target versus distractor stimulus propagation within cortex. For each session, we compared target stimulus encoding in target-aligned cortices to distractor stimulus encoding in distractor-aligned cortex. A–C, Scatter plots of target versus distractor encoding in S1 (A), wMC (B), and ALM (C). Each data point is one session (n = 39 sessions). Note that the data are broadly distributed in S1 and highly biased toward stronger target encoding in wMC and ALM. D, Summary data, comparing reductions in distractor encoding within each region (values above each data point) and between regions (lines below graph denote statistical significance). Reductions in distractor encoding are significantly larger in wMC and ALM compared with S1.
Figure 7.
Figure 7.
Similar behavior and neural activity across target assignments and trial structures. A, Discriminability d' and reaction times reported (box and whisker plots) separately for mice with left or right target whisker field assignment. None of the behavioral measures were significantly different between these two populations. B, Cortical activity during the lockout period for target trials (top) and distractor trials (bottom) for sessions in which the target was assigned to the left whisker field (represented by the right cortical hemisphere; n = 3 mice, n = 25 sessions). C, Same as B, but for sessions in which the target was assigned to the right whisker field (represented by the left cortical hemisphere; n = 2 mice, n = 14 sessions). Signal propagation to frontal cortex correlated with target assignment. D, Hit rates and reaction times reported (box and whisker plots) separately for target trials with and without a preceding correct rejection. None of the behavioral measures were significantly different between these two trial structures. E, Cortical activity during the lockout period for hit trials following a correct rejection (top) and hit trials not following a correct rejection (bottom; n = 39 sessions for both).
Figure 8.
Figure 8.
LFP signal transformation across S1, wMC, and ALM. LFP signals were recorded from layer 5 of S1, wMC, and ALM. A–F, Each trace reflects average LFP signals from one session, across all target trials in target-aligned cortices (A–C) and across all distractor trials in distractor-aligned cortices (D–F). The count in each panel refers to the number of recorded sessions included. G–I, Target-aligned (black) and distractor-aligned (gray) LFP signals, averaged across sessions. We observed three distinct event-related potentials, two negative-going (1 and 3) and one positive-going (2). Event 1, which is large in S1, small in wMC, and absent in ALM, likely reflects the initial feedforward sensory sweep. This event is similar in target and distractor recordings. Event 3, which is large in ALM and moderate in wMC and S1, is highly dissimilar between target and distractor recordings.
Figure 9.
Figure 9.
Bilateral whisker movements on target trials. Whisker movement energy was calculated from target or distractor whisker fields and plotted separately for target and distractor trials. Significant changes in poststimulus compared with prestimulus whisker movements are indicated as black bars above each plot. Two example sessions are shown, session 1 (A–D) and session 2 (E–H). A, E, Target whisker energy on target trials. B, F, Distractor whisker energy on target trials. C, G, Target whisker energy on distractor trials. D, H, Distractor whisker energy on distractor trials. Significant increases in whisker movements occurred for both target and distractor whiskers ∼0.1 s after target stimulus onset (A, B, E, F). Target and distractor whisker movements to distractor stimuli were either non-significant throughout the trial (C, D) or delayed (G, H).
Figure 10.
Figure 10.
Spatial maps of choice probability. We quantified choice probability as the separation between response absent and response present d', computed pixel-by-pixel. A, Choice probability map (left) and significance map (right) during the last frame of the lockout period. None of the pixels reached significance after correcting for multiple comparisons (Bonferroni). B, Same as in A, except with choice probability computed on the difference in activity between the two lockout frames. With this approach, significant choice probability was observed in target-aligned wMC and bilateral ALM.
Figure 11.
Figure 11.
Spatial correlation analysis. A–F, Correlation maps for full trial data. Seed regions of interest (marked by asterisk) included S1, wMC, and ALM, in target-aligned (A–C) and distractor-aligned (D–F) cortices. G, Summary data of average pairwise correlation values between S1-wMC, wMC-ALM, and S1-ALM. Statistical comparisons were made between target-aligned (T) and distractor-aligned (D) correlations, with significance denoted by lines connecting adjacent columns. Statistical comparisons were also made based on the differences in target-aligned and distractor-aligned correlations between regions, with significance denoted by lines connecting pairs of columns. H, I, Similar structure as in G, except for comparisons of target-aligned and distractor-aligned correlations (H, S1-wMC; I, S1-ALM) for different trial phases (pre, prestimulus; stim, peristimulus; resp, response).

References

    1. Alloway KD, Lou L, Nwabueze-Ogbo F, Chakrabarti S (2006) Topography of cortical projections to the dorsolateral neostriatum in rats: multiple overlapping sensorimotor pathways. J Comp Neurol 499:33–48. 10.1002/cne.21039 - DOI - PubMed
    1. Aron AR, Poldrack RA (2006) Cortical and subcortical contributions to stop signal response inhibition: role of the subthalamic nucleus. J Neurosci 26:2424–2433. 10.1523/JNEUROSCI.4682-05.2006 - DOI - PMC - PubMed
    1. Britten KH, Shadlen MN, Newsome WT, Movshon JA (1992) The analysis of visual motion: a comparison of neuronal and psychophysical performance. J Neurosci 12:4745–4765. - PMC - PubMed
    1. Britten KH, Newsome WT, Shadlen MN, Celebrini S, Movshon JA (1996) A relationship between behavioral choice and the visual responses of neurons in macaque MT. Vis Neurosci 13:87–100. 10.1017/s095252380000715x - DOI - PubMed
    1. Carvell GE, Miller SA, Simons DJ (1996) The relationship of vibrissal motor cortex unit activity to whisking in the awake rat. Somatosens Mot Res 13:115–127. 10.3109/08990229609051399 - DOI - PubMed

Publication types