Comparative Study
. 2020 Jun 16;117(24):13386-13392.
doi: 10.1073/pnas.1919906117. Epub 2020 Jun 2.

P-hacking in clinical trials and how incentives shape the distribution of results across phases

Affiliations
Comparative Study

P-hacking in clinical trials and how incentives shape the distribution of results across phases

Jérôme Adda et al. Proc Natl Acad Sci U S A. .

Abstract

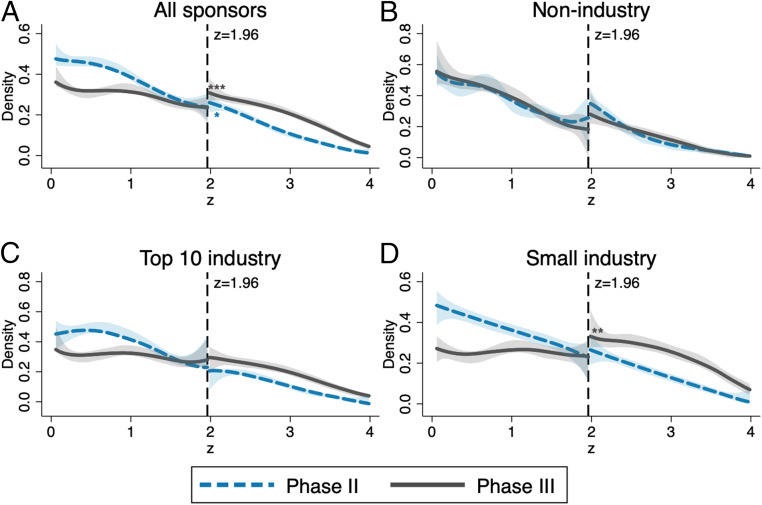
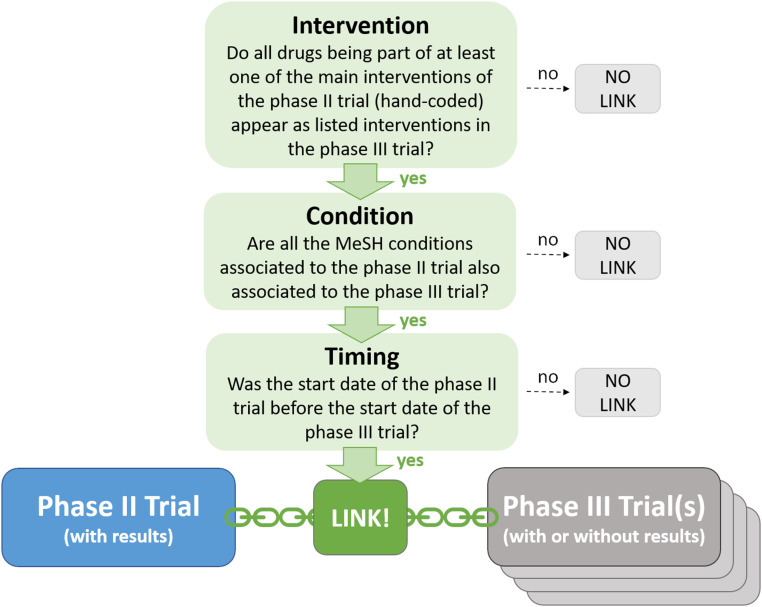
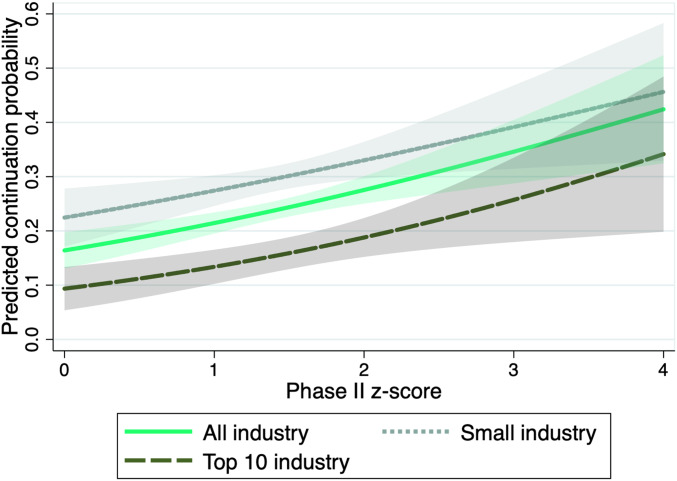
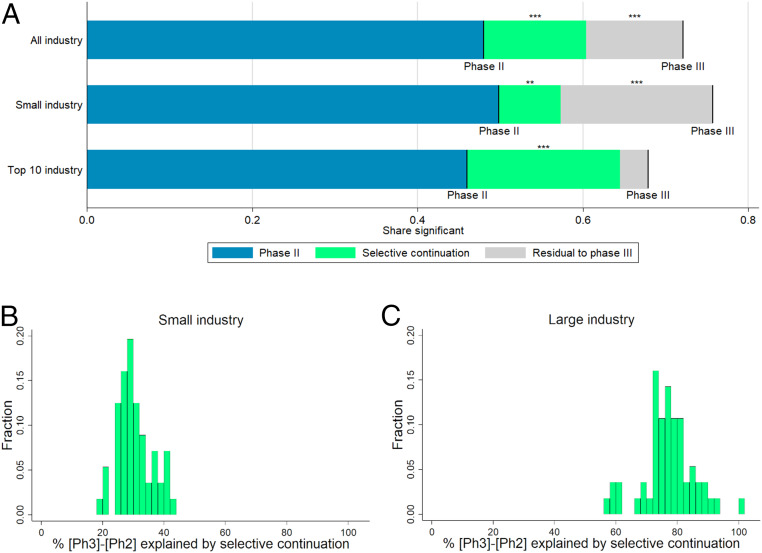
Clinical research should conform to high standards of ethical and scientific integrity, given that human lives are at stake. However, economic incentives can generate conflicts of interest for investigators, who may be inclined to withhold unfavorable results or even tamper with data in order to achieve desired outcomes. To shed light on the integrity of clinical trial results, this paper systematically analyzes the distribution of P values of primary outcomes for phase II and phase III drug trials reported to the ClinicalTrials.gov registry. First, we detect no bunching of results just above the classical 5% threshold for statistical significance. Second, a density-discontinuity test reveals an upward jump at the 5% threshold for phase III results by small industry sponsors. Third, we document a larger fraction of significant results in phase III compared to phase II. Linking trials across phases, we find that early favorable results increase the likelihood of continuing into the next phase. Once we take into account this selective continuation, we can explain almost completely the excess of significant results in phase III for trials conducted by large industry sponsors. For small industry sponsors, instead, part of the excess remains unexplained.

Keywords: clinical trials; drug development; economic incentives in research; p-hacking; selective reporting.


Conflict of interest statement

The authors declare no competing interest.

Figures

Fig. 1.
Fig. 1.
Comparison of phase II and phase III densities of the z score and tests for discontinuity at z=1.96, depending on the affiliation of the lead sponsor. Density estimates of the constructed z statistics for primary outcomes of phase II (dashed blue lines) and phase III (solid gray lines) trials are shown. The shaded areas are 95% confidence bands, and the vertical lines at 1.96 correspond to the threshold for statistical significance at the 0.05 level. Sample sizes: n=3,953 (phase II), n=3,664 (phase III) (A); n=1,171 (phase II), n=720 (phase III) (B); n=1,332 (phase II), n=1,424 (phase III) (C); and n=1,450 (phase II), n=1,520 (phase III) (D). Significance levels for discontinuity tests (38) are shown. **P < 0.05; ***P < 0.01. Exact P values are reported in SI Appendix, Table S2.
Fig. 2.
Fig. 2.
Linking phase II and phase III trials. We considered a phase II trial as continued if we found at least one phase III trial registered in the database (regardless of whether associated results are reported or not) fulfilling all three criteria (intervention, condition, and timing). See SI Appendix for a more detailed description of the linking procedure.
Fig. 3.
Fig. 3.
Predicted continuation probability as function on the phase II z score, depending on affiliation of lead sponsor. Predictions are based on the estimated logit selection functions for selective continuation; see Table 1 for the estimated coefficients. All control variables are fixed at their mean values. The shaded areas are 95% confidence bands.
Fig. 4.
Fig. 4.
(A) Selection-based decomposition of the difference in significant results from primary outcomes between phase II and phase III, depending on affiliation of lead sponsor (top-10 revenues criterion). Phase II and III lines represent the shares of trials with a P value below 5% (or, equivalently, a z score above 1.96). The green segments represent the parts of the differences explained by selective continuation, based on counterfactuals constructed from the phase II distribution. For precise numbers and sample sizes, see SI Appendix, Table S7. Significance levels for the differences (based on a two-sided t-test) are indicated. **P < 0.05; ***P < 0.01. (B and C) Histograms of the percentage share of the difference in the share of significant results between phase III and phase II explained by selective continuation across different definitions for large vs. small industry sponsors. The shares correspond to the green area in A divided by the sum of the green and the gray areas. The sample of industry-sponsored trials is split according to 56 different definitions of large sponsors. These definitions are obtained by ranking sponsors by their 2018 revenues, volume of prescription drug sales in 2018, research and development spending in 2018, and the number of trials reported to the registry. For each of these four criteria, 14 different definitions of “large vs. small” were created: top seven vs. remainder, top eight vs. remainder, and so on, up to top 20 vs. remainder. Further details are provided in SI Appendix.

Similar articles

Cited by

References

    1. Ioannidis J. P. A., Why most published research findings are false. PLoS Med. 2, e124 (2005). - PMC - PubMed
    1. Garattini S., et al. , Evidence-based clinical practice: Overview of threats to the validity of evidence and how to minimise them. Eur. J. Intern. Med. 32, 13–21 (2016). - PubMed
    1. Brown A. W., Kaiser K. A., Allison D. B., Issues with data and analyses: Errors, underlying themes, and potential solutions. Proc. Natl. Acad. Sci. U.S.A. 115, 2563–2570 (2018). - PMC - PubMed
    1. DiMasi J. A., Hansen R. W., Grabowski H. G., The price of innovation: New estimates of drug development costs. J. Health Econ. 22, 151–185 (2003). - PubMed
    1. Relman A. S., Economic incentives in clinical investigation. N. Engl. J. Med. 320, 933–934 (1989). - PubMed

Publication types

MeSH terms