. 2020 Jun 2;5(3):e00057-20.
doi: 10.1128/mSystems.00057-20.

Inference of Bacterial Small RNA Regulatory Networks and Integration with Transcription Factor-Driven Regulatory Networks

Affiliations

Inference of Bacterial Small RNA Regulatory Networks and Integration with Transcription Factor-Driven Regulatory Networks

Mario L Arrieta-Ortiz et al. mSystems. .

Abstract

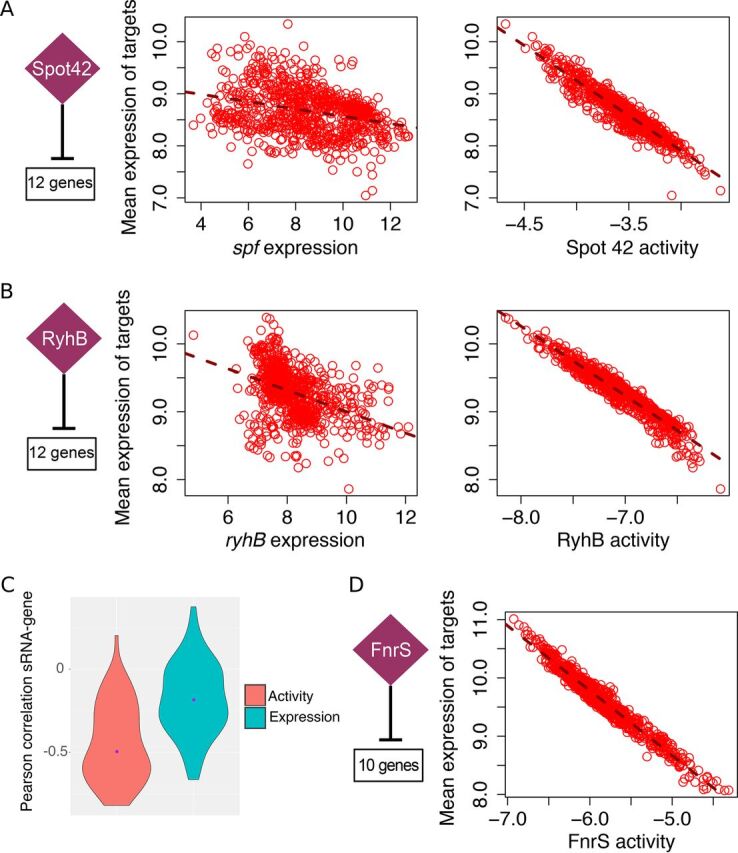
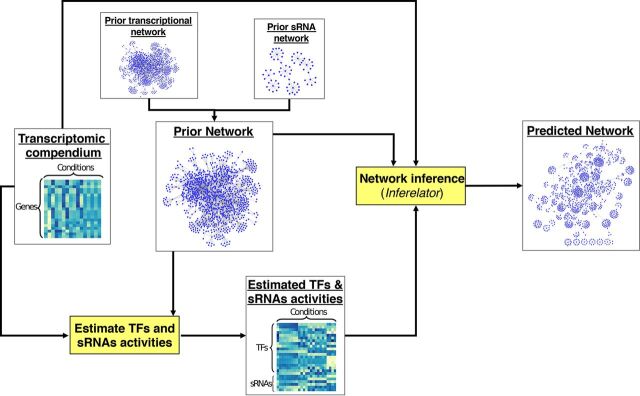
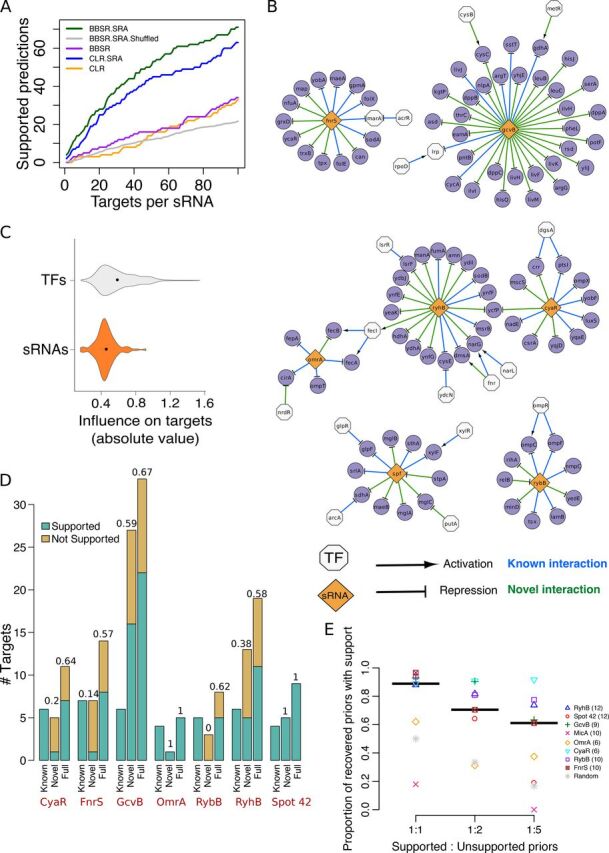
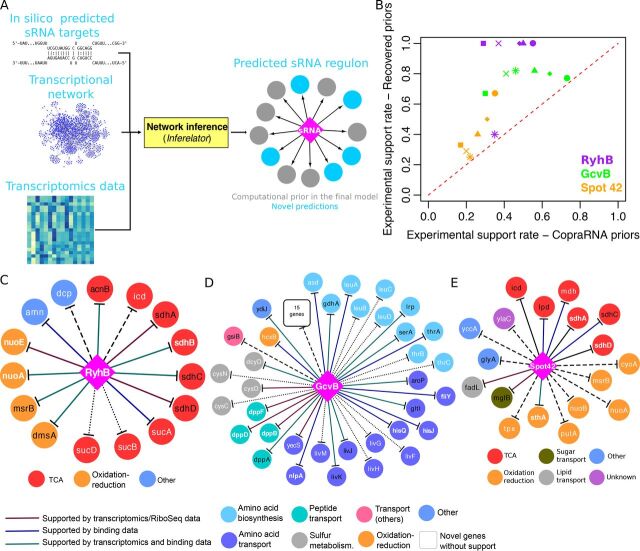
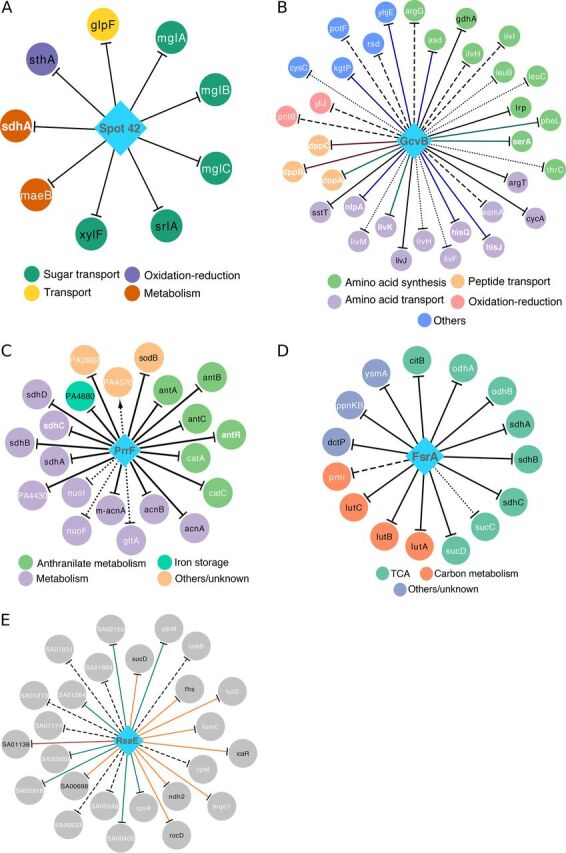
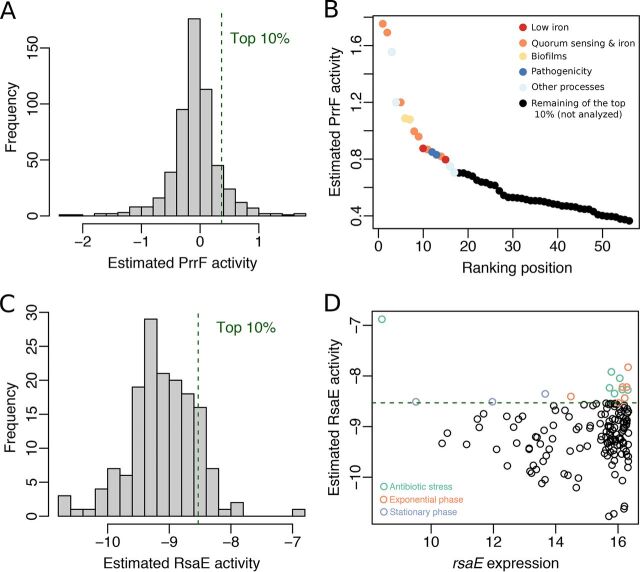
Small noncoding RNAs (sRNAs) are key regulators of bacterial gene expression. Through complementary base pairing, sRNAs affect mRNA stability and translation efficiency. Here, we describe a network inference approach designed to identify sRNA-mediated regulation of transcript levels. We use existing transcriptional data sets and prior knowledge to infer sRNA regulons using our network inference tool, the Inferelator This approach produces genome-wide gene regulatory networks that include contributions by both transcription factors and sRNAs. We show the benefits of estimating and incorporating sRNA activities into network inference pipelines using available experimental data. We also demonstrate how these estimated sRNA regulatory activities can be mined to identify the experimental conditions where sRNAs are most active. We uncover 45 novel experimentally supported sRNA-mRNA interactions in Escherichia coli, outperforming previous network-based efforts. Additionally, our pipeline complements sequence-based sRNA-mRNA interaction prediction methods by adding a data-driven filtering step. Finally, we show the general applicability of our approach by identifying 24 novel, experimentally supported, sRNA-mRNA interactions in Pseudomonas aeruginosa, Staphylococcus aureus, and Bacillus subtilis Overall, our strategy generates novel insights into the functional context of sRNA regulation in multiple bacterial species.IMPORTANCE Individual bacterial genomes can have dozens of small noncoding RNAs with largely unexplored regulatory functions. Although bacterial sRNAs influence a wide range of biological processes, including antibiotic resistance and pathogenicity, our current understanding of sRNA-mediated regulation is far from complete. Most of the available information is restricted to a few well-studied bacterial species; and even in those species, only partial sets of sRNA targets have been characterized in detail. To close this information gap, we developed a computational strategy that takes advantage of available transcriptional data and knowledge about validated and putative sRNA-mRNA interactions for inferring expanded sRNA regulons. Our approach facilitates the identification of experimentally supported novel interactions while filtering out false-positive results. Due to its data-driven nature, our method prioritizes biologically relevant interactions among lists of candidate sRNA-target pairs predicted in silico from sequence analysis or derived from sRNA-mRNA binding experiments.

Keywords: gene networks; global regulation; small RNAs.


Figures

FIG 1
FIG 1
The transcriptional profile of an sRNA is a suboptimal proxy for its regulatory activity. The motivation for estimating sRNA activities is illustrated for three E. coli sRNAs. sRNA activities were estimated for each experimental condition. Each circle represents the value for one microarray experiment. The numbers of known targets used to estimate sRNA activities and to compute the mean expression of the analyzed regulons (under each condition) are indicated. (A) Spot 42 controls the uptake and metabolism of alternative sugars (35). A stronger relation is observed between the estimated Spot 42 activity and the mean expression profile of its dependent genes (right panel) than between the expression profile of spf and its targets (left panel). (B) RyhB represses production of iron-consuming proteins as part of the iron-sparing response (28, 31). Similarly, the relation between estimated RyhB activity and the mean expression profile of its targets is stronger than the relationship between the expression profile of ryhB and its targets. (C) Violin plots show the distribution of Pearson correlation values between sRNAs and the transcriptional profile of their priors when either estimated sRNA activities or sRNA transcriptional profiles are used for computation. Purple dots indicate median correlation values (−0.5 and −0.19 for sRNA activity and sRNA transcriptional profiles, respectively). The difference between both sets of correlation values is statistically significant (t test P value = 9.3e−10). (D) FnrS is associated with anaerobic respiration (72, 73). The probes for fnrS did not need to be present in the E. coli transcriptomic data set in order to be included as a potential regulator in our pipeline. FnrS activity was estimated from the expression profile of 10 FnrS-dependent genes present in the transcriptomic compendium (see Table S1 in the supplemental material).
FIG 2
FIG 2
General strategy. A transcriptomic data set and a prior network (built from experimentally supported TF-gene and experimentally supported or candidate sRNA-mRNA interactions) are used for estimating the regulatory activities of TFs (TFAs) and sRNAs (SRAs) using a network component analysis approach (24, 68). Next, estimated TFAs and SRAs, transcriptomic data, and prior network are used as input for the Inferelator to infer a regulatory network composed of a transcriptional layer (TF based) and a posttranscriptional layer (sRNA based).
FIG 3
FIG 3
Performance of the Inferelator and alternative computational methods for expanding sRNA networks. (A) Performance of the Inferelator (BBSR) and mixed CLR, an alternative method, with incorporation of sRNA activities (SRA suffix) and without incorporation of sRNA activities. Genes predicted as targets but not used for sRNA activity estimation were considered to be experimentally supported if they were included in the compiled list of candidate targets of the corresponding sRNA (Table 1). Most candidate targets were differentially expressed in transcriptional profiling experiments (deletion or overexpression of cyaR, gcvB, micA, omrA, spf [encoding Spot 42], rybB, and ryhB). Additionally, predicted targets were considered experimentally supported when they were part of an operon containing differentially expressed genes or other validated targets. For each sRNA, targets were ranked based on confidence score (in the case of the Inferelator) or mutual information-based score (in the mixed-CLR runs). To estimate the basal performance level of the Inferelator, the average of 10 runs with shuffled sRNA priors was also computed (gray line). (B) The inferred sRNA regulatory network of E. coli. To allow comparison between transcriptional and posttranscriptional networks, overlap between both networks is displayed. (C) Violin plots showing the distribution of absolute values of Bayesian regression coefficients (which indicate magnitude) associated with TF-gene and sRNA-mRNA interactions. Black dots indicate the median values. (D) The inferred sRNA regulons are experimentally supported (description of each sRNA regulon in Data Set S1 in the supplemental material). Experimental support rate for novel predictions (not in the prior network) and full inferred regulons (recovered priors and novel predictions) of the BBSR.SRA run shown in panel A are shown above each bar. (E) The Inferelator identifies experimentally supported targets among noisy priors. Experimental support rates for recovered priors are plotted for different levels of noise in the priors. Each symbol shows the mean value of 10 Inferelator runs (each run with a different set of false priors). Each colored symbol corresponds to one of eight sRNAs. Black lines indicate the median of the average proportions for all eight sRNAs. The gray stars indicate the average expected proportion if priors included in the predicted networks were randomly selected. The numbers of true sRNA targets are shown in parentheses.
FIG 4
FIG 4
The Inferelator identifies computationally predicted sRNA-mRNA interactions with experimental support. (A) General strategy to integrate computational sRNA-mRNA predictions in our pipeline. The resulting sRNA regulons are then analyzed to identify sequence-based sRNA-mRNA interactions supported by available experimental data and potential additions to the sRNA regulon. (B) The experimental support rate of recovered priors is significantly higher than the rate of the original CopraRNA-derived sRNA priors. The six points per sRNA correspond to the six sets of sRNA priors derived from CopraRNA predictions (Table S2). (C) The inferred RyhB regulon when CopraRNA predictions associated with enriched functional terms were used as priors. (D) The inferred GcvB regulon when CopraRNA predictions with P values of ≤0.01 were used as priors. Based on the high number of common GcvB targets in E. coli and S. Typhimurium, experimental data from S. Typhimurium was considered supporting evidence. (E) The inferred Spot 42 regulon when CopraRNA predictions with P values of ≤0.01 and associated with enriched functional terms were used as priors. In panels C to E, diamonds and circles represent sRNAs and target genes, respectively. Solid lines indicate interactions with experimental support. Dashed lines indicate interactions without experimental support; dotted lines indicate targets without direct support but located in the same operon of experimentally supported targets. Priors included in the final regulon are shown with black text. Novel targets (i.e., not present in the priors) are shown by white text. Bold white font indicates validated novel targets. Target genes are colored according to their functional annotation (from the EcoCyc database) (74).
FIG 5
FIG 5
Selected expanded sRNA regulons of E. coli, P. aeruginosa, B. subtilis, and S. aureus. sRNA regulons were inferred using manually selected sRNA priors listed in Table S1. Diamonds and circles represent sRNAs and target genes, respectively. Solid lines indicate priors and experimentally supported novel targets. Dashed lines indicate unsupported predictions. Black node labels indicate prior targets, and white node labels indicate novel targets (not used as sRNA priors). Validated novel targets are shown in bold white font. Target genes are colored according to their functional annotation. (A) The inferred E. coli Spot 42 regulon. All predicted targets were experimentally supported. (B) The inferred E. coli GcvB regulon. Novel interactions supported by transcriptional profiling data, physical binding data, or both are shown in red, blue, and green, respectively. Based on the high number of common GcvB targets in E. coli and S. Typhimurium, experimental data from S. Typhimurium was considered supporting evidence. Dotted lines indicate targets without direct support but located in the same operon of experimentally supported targets. (C) The inferred PrrF regulon of P. aeruginosa. Dotted lines indicate PrrF targets supported by increased expression at the mRNA or protein levels in high-iron versus low-iron conditions but not in prrF deletion strains. (D) The inferred FsrA regulon of B. subtilis. Dotted lines indicate FsrA targets supported by mRNA upregulation in the fur deletion strain (with respect to the wild-type strain) but not in the fsrA fur double deletion strain (with respect to fur deletion strain). (E) The inferred S. aureus RsaE regulon. Experimental support was evaluated using transcriptional profiling data of rsaE deletion, rsaE overexpression, and limited RsaE-mRNA binding data reported by Rochat et al. (52). Green, orange, and red lines indicate RsaE targets supported by one, two, and three data types, respectively. Due to space constraints, the first part of the locus names (SAOUHSC_) was abbreviated to “SA” in panel E.
FIG 6
FIG 6
Analysis of sRNA activity profiles reveals the conditions where sRNAs are most likely to interact with their predicted targets. (A) Distribution of the estimated PrrF activity in the 559 experiments included in the P. aeruginosa transcriptomic compendium. (B) Experimental conditions (10% of 559) where PrrF is most active. Each circle depicts the value for one experiment (normalized with respect to a control condition) (60). The first 17 experiments in the ranking are colored according to the corresponding growth conditions. (C) Distribution of the estimated RsaE activity in the 156 experiments included in the S. aureus transcriptomic compendium. (D) Comparison of the complete RsaE activity and expression profiles. Each circle depicts the value for one experiment. Experiments in the top 10% of RsaE activity are colored according to the corresponding growth conditions.

References

    1. Richmond CS, Glasner JD, Mau R, Jin H, Blattner FR. 1999. Genome-wide expression profiling in Escherichia coli K-12. Nucleic Acids Res 27:3821–3835. doi:10.1093/nar/27.19.3821. - DOI - PMC - PubMed
    1. Fawcett P, Eichenberger P, Losick R, Youngman P. 2000. The transcriptional profile of early to middle sporulation in Bacillus subtilis. Proc Natl Acad Sci U S A 97:8063–8068. doi:10.1073/pnas.140209597. - DOI - PMC - PubMed
    1. Waters LS, Storz G. 2009. Regulatory RNAs in bacteria. Cell 136:615–628. doi:10.1016/j.cell.2009.01.043. - DOI - PMC - PubMed
    1. Storz G, Vogel J, Wassarman KM. 2011. Regulation by small RNAs in bacteria: expanding frontiers. Mol Cell 43:880–891. doi:10.1016/j.molcel.2011.08.022. - DOI - PMC - PubMed
    1. Wagner EGH, Romby P. 2015. Small RNAs in bacteria and archaea: who they are, what they do, and how they do it. Adv Genet 90:133–208. doi:10.1016/bs.adgen.2015.05.001. - DOI - PubMed

LinkOut - more resources