Review
. 2020 May-Jun;9(3):269-277.
doi: 10.1097/APO.0000000000000292.

Translational Retinal Imaging

Affiliations
Review

Translational Retinal Imaging

Jorge Orellana-Rios et al. Asia Pac J Ophthalmol (Phila). 2020 May-Jun.

Abstract

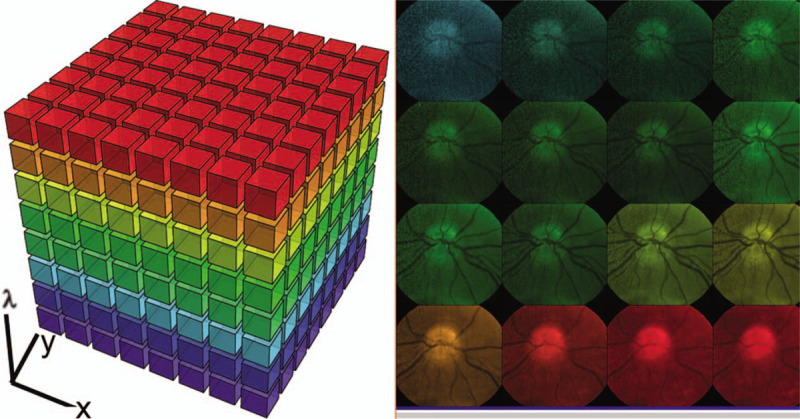
The diagnosis and treatment of medical retinal disease is now inseparable from retinal imaging in all its multimodal incarnations. The purpose of this article is to present a selection of very different retinal imaging techniques that are truly translational, in the sense that they are not only new, but can guide us to new understandings of disease processes or interventions that are not accessible by present methods. Quantitative autofluorescence imaging, now available for clinical investigation, has already fundamentally changed our understanding of the role of lipofuscin in age-related macular degeneration. Hyperspectral autofluorescence imaging is bench science poised not only to unravel the molecular basis of retinal pigment epithelium fluorescence, but also to be translated into a clinical camera for earliest detection of age-related macular degeneration. The ophthalmic endoscope for vitreous surgery is a radically new retinal imaging system that enables surgical approaches heretofore impossible while it captures subretinal images of living tissue. Remote retinal imaging coupled with deep learning artificial intelligence will transform the very fabric of future medical care.


Conflict of interest statement

The authors have no conflicts of interest to disclose.

Figures

FIGURE 1
FIGURE 1
qAF in a patient with multilobular geographic atrophy (GA). A reticular macular disease (RMD) phenotype in a 78-year-old woman as seen on (A) near-infrared reflectance and (B) enhanced depth imaging optical coherence tomography (EDI-OCT) B scan. C, The qAF values were calculated by measuring the mean gray levels and the internal reference above to obtain a color-coded image with a reference bar showing qAF intensities in artificial units. Accordingly, this patient with late age-related macular degeneration can be studied by using overlay tools such as Delori pattern (D) or a region-of-interest (E), within the junctional zone of GA in RMD. qAF indicates quantitative autofluorescence.
FIGURE 2
FIGURE 2
qAF in a 74-year-old man with Stargardt disease. An illustrative case of the right eye as seen on (A) color fundus photography. (B) The mean gray values were measured to obtain a color-coded qAF map (C). The highest qAF values corresponded to hyperAF pisciform retinal flecks, superior to GA. An evident difference can be noted between an age-matched patient with AMD (D) and this patient with Stargardt disease (E). A comparison of a ROI in the perilesional zone of GA in AMD and Stargardt-associated GA revealed a 2-fold higher qAF values in the latter (248 au v/s 528 au). Hence the importance of the qAF method to differentiate AMD from retinal dystrophies. (qAF imaging courtesy of Wei Wei MD). qAF indicates quantitative autofluorescence.
FIGURE 3
FIGURE 3
Left. Retinal pigment epithelium (RPE) bis-retinoids form complex granules known as lipofuscin, which increase with age, and glow gold under blue light. Middle. Normal gray scale FAF image. Right. fundus autofluorescence (FAF) image of subject with geographic atrophy (GA). The GA has a dark, but variable FAF, outlined in red.
FIGURE 4
FIGURE 4
Left. Schematic of a hyperspectral data cube, wth 2 spatial dimensions x, y, and the spectral dimension λ. Right. Disc photo acquired in 16 wavelengths in the visible spectrum (ie, 16 colors). Each image can be considered one layer to be stacked into the corresponding hyperspectral image.
FIGURE 5
FIGURE 5
Left. The broad emission spectrum of RPE lipofuscin from a flatmount of RPE/BRM when excited by 436 nm light, captured by the Nuance camera. The peak in this sample is around 570 nm, in the yellow range (Compare Figure 1 Left). Middle and Right. The full color AF of the sample with drusen is marked RGB. Note again the predominantly yellow AF from the LF surrounding the nuclei in the RPE cells, whereas the AF from the soft drusen is greenish. Right. After mathematical “unmixing” of the AF from the sample, 3 distinct spectra are found in the RPE, labeled S1, S2, and S3, presented graphically in green, blue, and red, and a distinct new spectrum SDr (azure) is found that is specific for drusen/drusen precursors and has a short wavelength emission around 510 nm. Middle. The color-coded tissue localizations of the individual fluorophore sources of the spectra S1, S2 and SDr are shown (S3 not shown). AF indicates autofluorescence; BRM, bruch's membrane; RGB, composite red green blue autofluorescence image; LF, Lipofuscin; RPE, retinal pigment epithelium; SDr, spectrum for drusen.
FIGURE 6
FIGURE 6
The IMS is a prism array that redirects slices of the image so that there is space between slices on the detector array. A prism or diffraction grating spectrally disperses the AF emission into all colors in the direction orthogonal to the length of the image slice. In this way, with a single frame acquisition from the camera, we obtain a spectrum from each spatial location (x, y) in the image, that is, a hyperspectral AF image. The spectral slices for each wavelength are then reconstructed into complete 2D images for each wavelength by a simple pixel remapping. This creates the final hyperspectral data cube for analysis by NMF. AF indicates autofluorescence; IMS, image mapping spectrometer; NMF, non-negative matrix factorization.
FIGURE 7
FIGURE 7
Ophthalmic endoscopic system (FiberTech, Tokyo, Japan). The resolution is of the image on the monitor. The actual tissue resolution is determined by the number of fibers in the scope and the proximity of the scope to the tissue (see Fig. 2A).
FIGURE 8
FIGURE 8
Ophthalmic endoscopic view (25G) under the retina in a PCV patient with a large subretinal hemorrhage (Modified from , with permission of the publisher). A, The retinal pigment epithelium (RPE) can be seen as an orange-colored tissue (asterisk) surrounded by remaining subretinal hemorrhage. The vitreous cutter is above (arrow). This entire field is about 2.5 mm in diameter, captured by the 10,000 fibers of the endoscope, giving about 20 microns per pixel resolution in this image. B, The CNV can be seen directly as a mass lesion of mosaic brown color (double asterisks). C, At the bottom of the CNV, a thin white cord-like tissue can be seen originating from the choroidal side, presumably a feeder vessel (arrow). D, After removal of the CNV, tortuous whitish choroidal vessels are observed, suggesting ischemia. CNV indicates choroidal neovascularization; PCV, polypoidal choroidal vasculopathy.
FIGURE 9
FIGURE 9
Ensemble framework of deep learning-based diabetic retinopathy (DR) screening system. The preprocessed and the original RGB images are input to ensembles of three and two deep learning models, respectively, differing in type of architecture and input image size. Each model then produces a set of 5 probabilities (probs) of belonging to each of the 5 DR classes: none, early, intermediate, severe, and PDR. The 25 total probabilities are then concatenated (grouped) to form a vector of 25 features which is input to a logistic model tree (LMT). The LMT has been trained to decide the DR class based on the totality of the deep learning inputs, and is the final classifier. PDR indicates proliferative diabetic retinopathy; RGB, red green blue images.

References

    1. Delori F, Greenberg JP, Woods RL, et al. Quantitative measurements of autofluorescence with the scanning laser ophthalmoscope. Invest Ophthalmol Vis Sci 2011; 52:9379–9390. - PMC - PubMed
    1. Gliem M, Muller PL, Finger RP, McGuinness MB, Holz FG, Charbel Issa P. Quantitative fundus autofluorescence in early and intermediate age-related macular degeneration. JAMA Ophthalmol 2016; 134:817–824. - PubMed
    1. Orellana-Rios J, Yokoyama S, Agee JM, et al. Quantitative fundus autofluorescence in non-neovascular age-related macular degeneration. Ophthalmic Surg Lasers Imaging Retina 2018; 49:S34–S42. - PubMed
    1. Spaide RF, Ooto S, Curcio CA. Subretinal drusenoid deposits AKA pseudodrusen. Surv Ophthalmol 2018; 63:782–815. - PubMed
    1. Smith RT, Sohrab MA, Busuioc M, Barile G. Reticular macular disease. Am J Ophthalmol 2009; 148:733–743. - PMC - PubMed

MeSH terms