. 2020 Jun 2;11(1):2773.
doi: 10.1038/s41467-020-16391-6.

Low-dose phase retrieval of biological specimens using cryo-electron ptychography

Affiliations

Low-dose phase retrieval of biological specimens using cryo-electron ptychography

Liqi Zhou et al. Nat Commun. .

Abstract

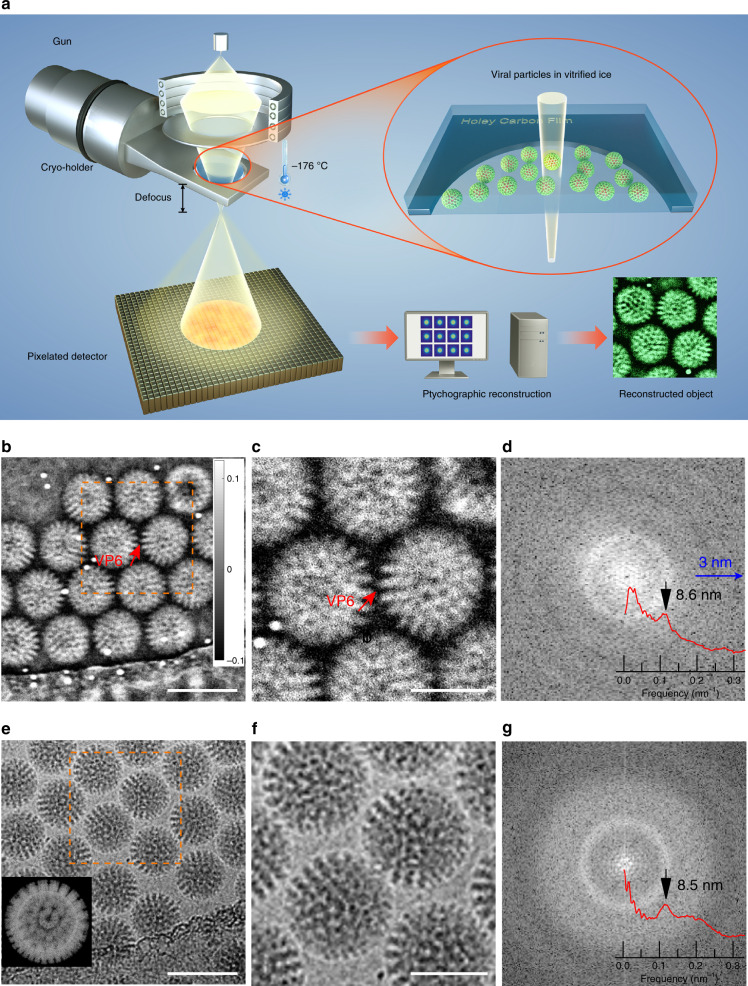
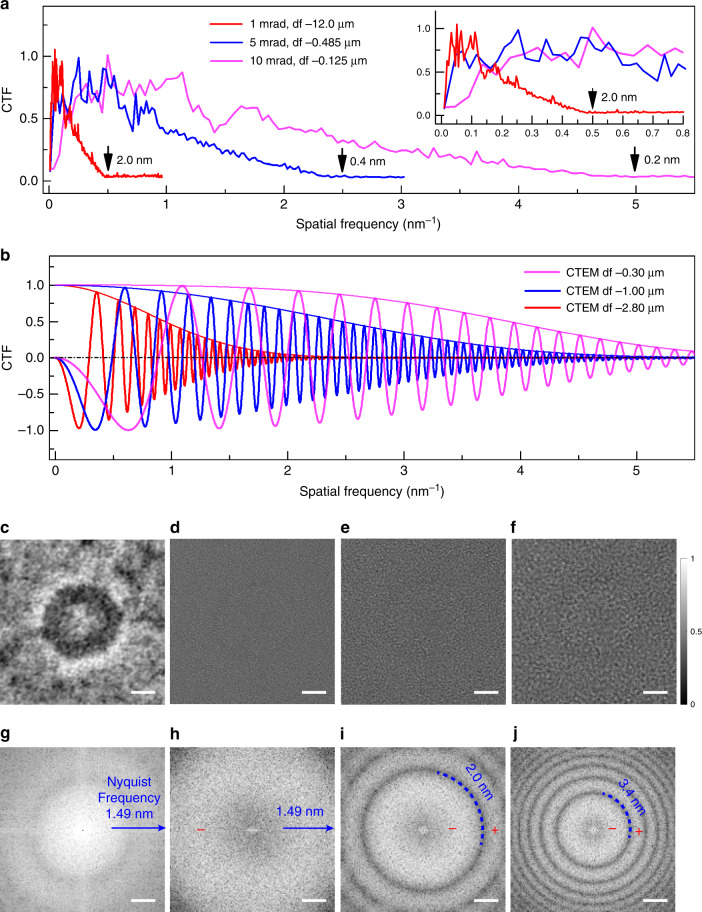
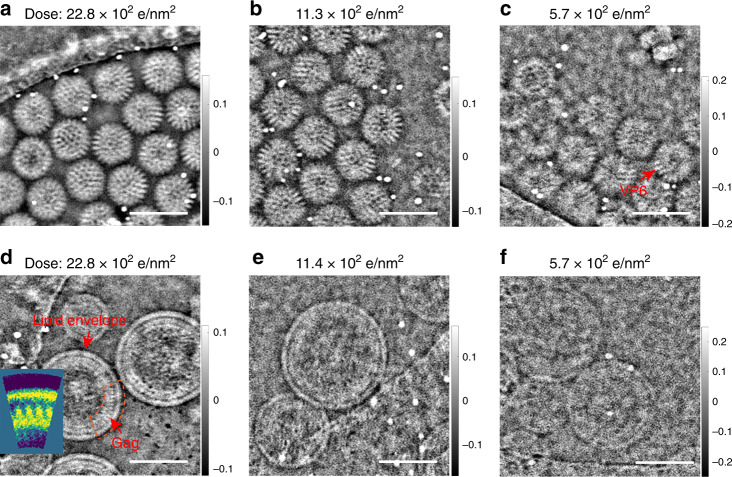
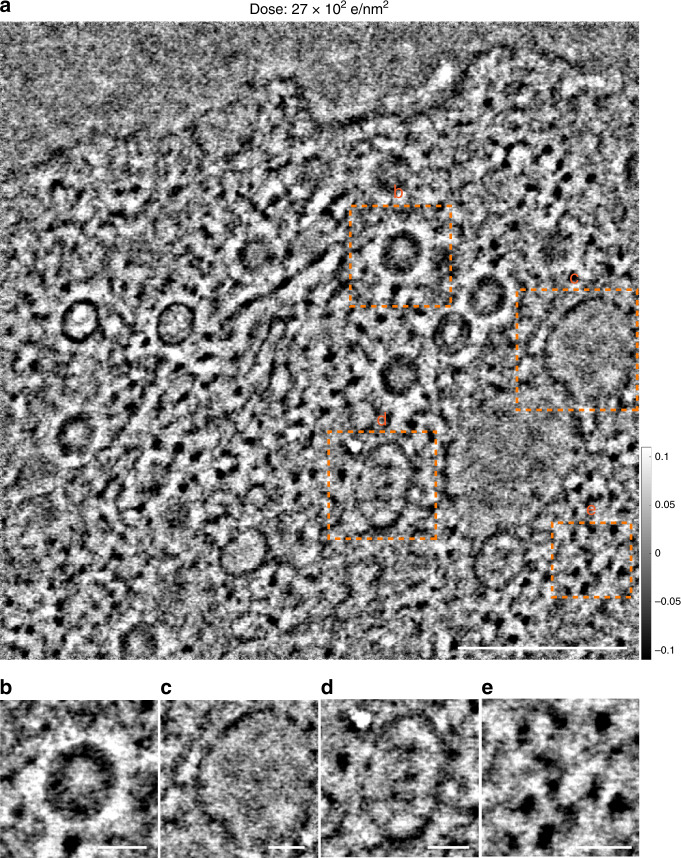
Cryo-electron microscopy is an essential tool for high-resolution structural studies of biological systems. This method relies on the use of phase contrast imaging at high defocus to improve information transfer at low spatial frequencies at the expense of higher spatial frequencies. Here we demonstrate that electron ptychography can recover the phase of the specimen with continuous information transfer across a wide range of the spatial frequency spectrum, with improved transfer at lower spatial frequencies, and as such is more efficient for phase recovery than conventional phase contrast imaging. We further show that the method can be used to study frozen-hydrated specimens of rotavirus double-layered particles and HIV-1 virus-like particles under low-dose conditions (5.7 e/Å2) and heterogeneous objects in an Adenovirus-infected cell over large fields of view (1.14 × 1.14 μm), thus making it suitable for studies of many biologically important structures.


Conflict of interest statement

The authors declare no competing interests.

Figures

Fig. 1
Fig. 1. Cryo-ptychographic configuration and reconstruction of rotavirus DLPs.
a Schematic diagram of the optical configuration. b Ptychographic reconstructed phase at a dose of 22.8 e/Å2 and e defocused TEM images at dose of 35 e/Å2 of rotavirus DLPs in vitrified ice. c, f Magnified views of sub areas marked in b and e with orange squares, respectively. The red arrows in b and c indicate the capsid trimers of viral protein 6 (VP6). The ~6 nm gold particles are displayed as bright features in b and c following established convention where a phase advance (+) is displayed as white and appears as a contrast reversal compared to conventional TEM images. d, g Power spectra calculated from b and e, respectively including radial averages (inset). A rotavirus DLP model is shown in e (inset). The gray scale bar in b is in radians and applies to b and c. Scale bars: 100 nm in b and e, 50 nm in c and f.
Fig. 2
Fig. 2. CTFs and comparisons of ptychography and defocused TEM.
a Simulated ptychographic phase CTFs for different convergence semi-angles with Poisson noise; 1 mrad (red line), 5 mrad (blue line), 10 mrad (magenta line) at an accelerating voltage of 80 kV. b Conventional phase CTFs of noise free for images simulated at different defoci: −0.3 µm (magenta line), −1.0 µm (blue line), −2.8 µm (red line) using envelope functions calculated according to refs. at an accelerating voltage of 80 kV. c Experimental reconstructed ptychographic phase at dose of 146 e/Å2 and TEM images at defoci of d −0.32 μm, e −1.0 μm, f −2.8 μm at dose of 180 e/Å2, of a resin embedded Adenovirus particle recorded at room temperature. For comparison, the ptychographic phase and TEM images are displayed normalized to a range of 0 to 1. Power spectra calculated from g the ptychographic phase and h to j TEM images. Additional calculation parameters are given in Supplementary Tables 2 and 3. The reconstructed ptychographic phase and CTEM images are both displayed normalized to a range of 0 to 1 corresponding to the greyscale on the right of f. Scale bars: 25 nm in c to f and 0.2 nm−1 in g to j.
Fig. 3
Fig. 3. Low-dose cryo-ptychographic reconstruction of viral particles.
Reconstructed phase of rotavirus DLPs at doses of a 22.8 e/Å2, b 11.3 e/Å2 and c 5.7 e/Å2. The red arrow in c indicates the VP6 trimers. Reconstructed phase of non-symmetrical immature HIV-1 VLPs at doses of d 22.8 e/Å2, e 11.4 e/Å2 and f 5.7 e/Å2. The red arrows in d indicate the HIV-1 Gag protein and the lipid envelope. Inset to d is a rotational average of the sub-region indicated by the orange dashed line, (for details see Supplementary Fig. 10 and Supplementary Note 7). Scale bars: 100 nm.
Fig. 4
Fig. 4. Low-dose large scale ptychographic reconstruction at room temperature.
a Micrometer scale reconstructed phase of an Adenovirus-infected cell recorded at a dose of 27 e/Å2. Magnified views of b a viral particle, c a vacant vesicle. d A transport vesicle and e free ribosomes taken from regions indicated with orange squares in a. Scale bars are a 300 nm, and be 50 nm.

References

    1. Henderson R, et al. Model for the structure of bacteriorhodopsin based on high-resolution electron cryo-microscopy. J. Mol. Biol. 1990;213:899–929. - PubMed
    1. Taylor KA, Glaeser RM. Electron diffraction of frozen, hydrated protein crystals. Science. 1974;186:1036–1037. - PubMed
    1. Henderson R, Unwin PNT. Three-dimensional model of purple membrane obtained by electron microscopy. Nature. 1975;257:28. - PubMed
    1. Adrian M, Dubochet J, Lepault J, McDowall AW. Cryo-electron microscopy of viruses. Nature. 1984;308:32. - PubMed
    1. Liao M, Cao E, Julius D, Cheng Y. Structure of the TRPV1 ion channel determined by electron cryo-microscopy. Nature. 2013;504:107. - PMC - PubMed

Publication types

MeSH terms