. 2020 Jun 2;11(1):2843.
doi: 10.1038/s41467-020-16584-z.

Core functional nodes and sex-specific pathways in human ischaemic and dilated cardiomyopathy

Affiliations

Core functional nodes and sex-specific pathways in human ischaemic and dilated cardiomyopathy

Mengbo Li et al. Nat Commun. .

Abstract

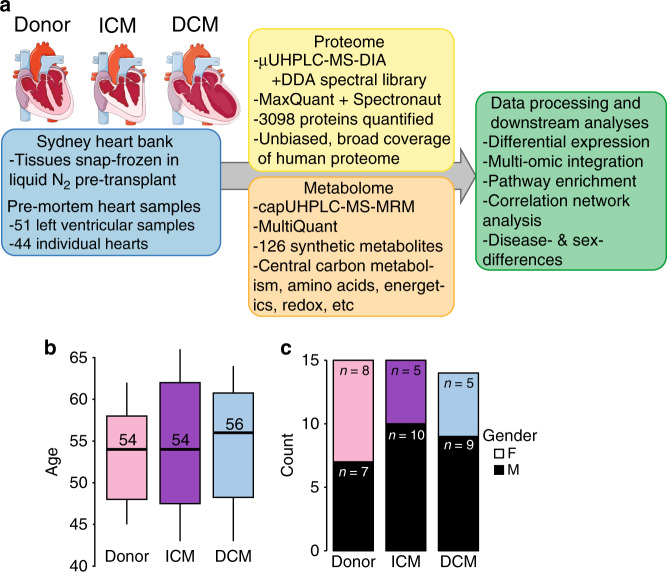
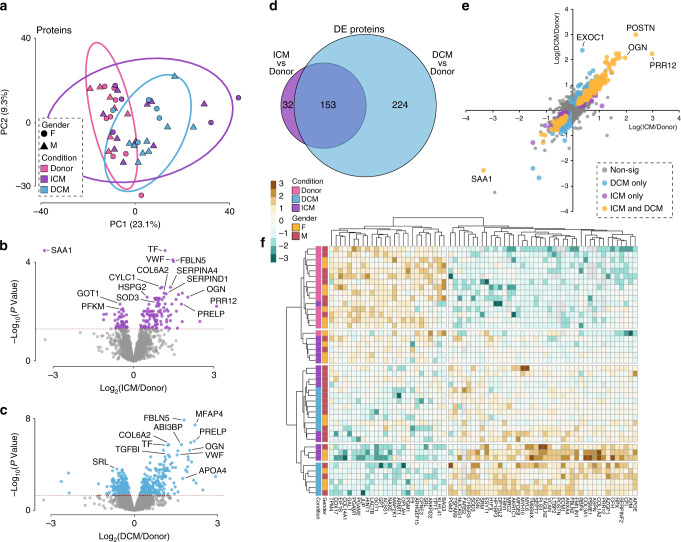
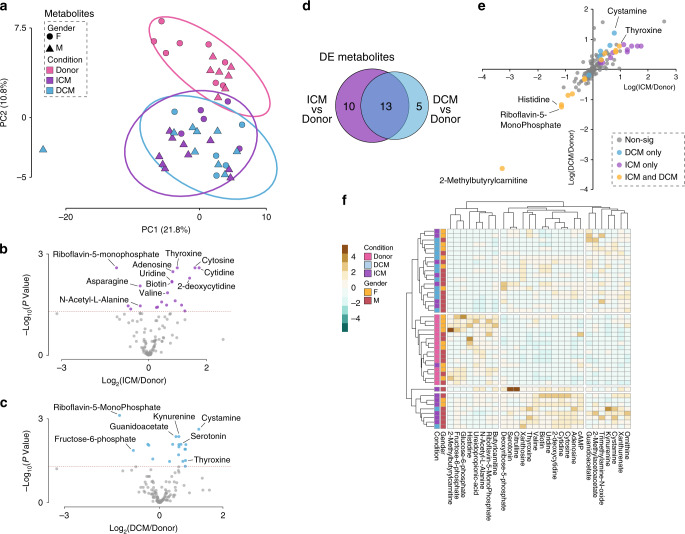
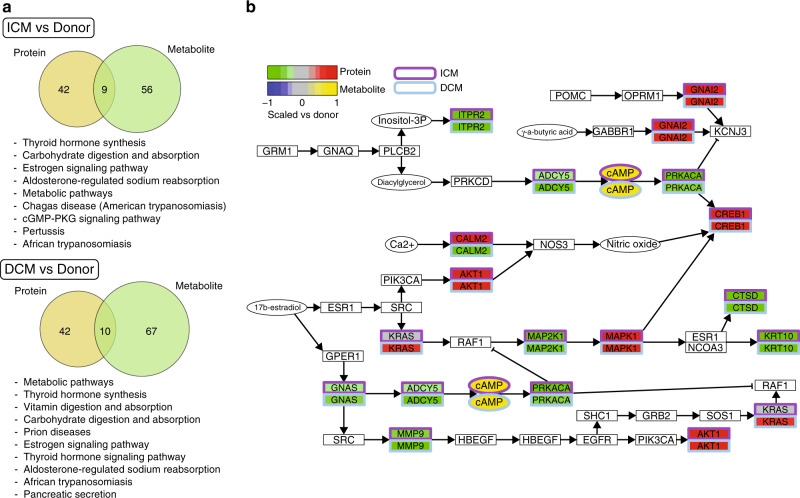
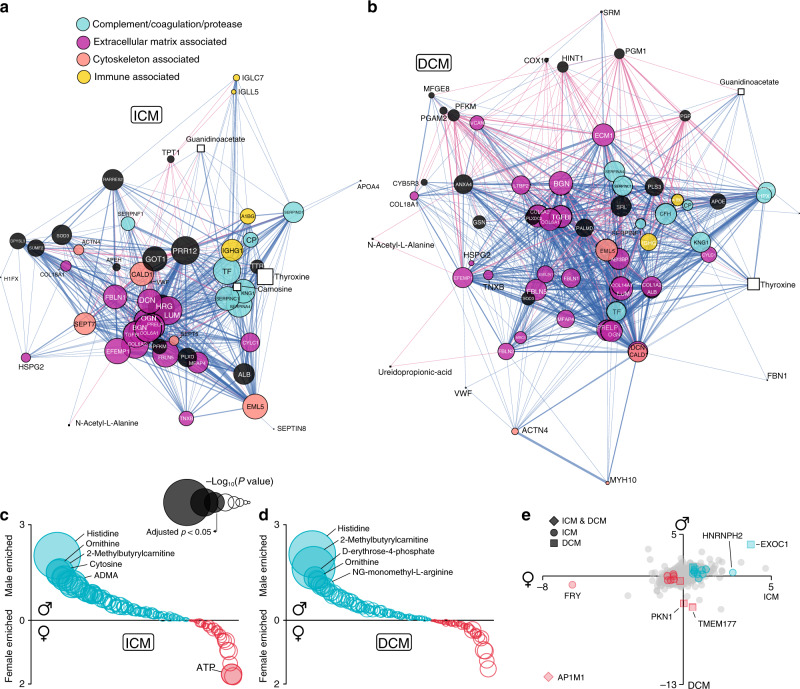
Poor access to human left ventricular myocardium is a significant limitation in the study of heart failure (HF). Here, we utilise a carefully procured large human heart biobank of cryopreserved left ventricular myocardium to obtain direct molecular insights into ischaemic cardiomyopathy (ICM) and dilated cardiomyopathy (DCM), the most common causes of HF worldwide. We perform unbiased, deep proteomic and metabolomic analyses of 51 left ventricular (LV) samples from 44 cryopreserved human ICM and DCM hearts, compared to age-, gender-, and BMI-matched, histopathologically normal, donor controls. We report a dramatic reduction in serum amyloid A1 protein in ICM hearts, perturbed thyroid hormone signalling pathways and significant reductions in oxidoreductase co-factor riboflavin-5-monophosphate and glycolytic intermediate fructose-6-phosphate in both; unveil gender-specific changes in HF, including nitric oxide-related arginine metabolism, mitochondrial substrates, and X chromosome-linked protein and metabolite changes; and provide an interactive online application as a publicly-available resource.


Conflict of interest statement

The authors declare no competing interests.

Figures

Fig. 1
Fig. 1. Schematic summary.
a Schematic outlining pathology, sample acquisition, omic platforms applied, and analysis. b age distribution of all measured patients and donors. The size of each condition group is as indicated in (c); the boxplots indicate the median (the middle line) and third and first quartiles (the box); the whiskers show the 1.5 × IQR (interquartile range) above and below the box. and (c) gender counts of donor heart, ischemic heart disease, and dilated cardiomyopathy groups. ICM ischemic cardiomyopathy, DCM dilated cardiomyopathy. Source data are provided as a Source Data file.
Fig. 2
Fig. 2. Differential analysis in protein expression levels between ICM or DCM and donors.
a PCA of proteomic data in ICM and DCM, including all three conditions and both genders. b Volcano plot of ICM vs Donor proteins. Estimates were derived using the linear regression model adjusted for gender, where nICM = 15 and ndonor = 15. c Volcano plot of DCM v Donor proteins. Estimates were derived using the linear regression model adjusted for gender, where nDCM = 14 and ndonor = 15. d Venn diagram summarising the differential and overlapping proteins. e Plot of fold changes of proteins in ICM, DCM, and both. f Multigroup heatmap with dendrogram of DE protein levels incorporating donor, ICM, and DCM hearts and both genders. DE differential expression. Source data are provided as a Source Data file.
Fig. 3
Fig. 3. Differential analysis in metabolite abundance levels between ICM or DCM and donors.
a PCA of metabolomic data in ICM and DCM, including all three conditions and both genders. b Volcano plot of ICM vs Donor metabolites. Estimates were derived using the linear regression model adjusted for gender, where nICM = 15 and ndonor = 15. c Volcano plot of DCM v Donor metabolites. Estimates were derived using the linear regression model adjusted for gender, where nDCM = 14 and ndonor = 15. d Venn Diagram summarising the differential and overlapping metabolites. e Plot of fold changes of metabolites in ICM, DCM, and both. f Multigroup heatmap with dendrogram of DE metabolite levels incorporating donor, ICM, and DCM hearts and both genders. Source data are provided as a Source Data file.
Fig. 4
Fig. 4. Pathways analysis.
a Venn diagrams illustrating the number of metabolite (yellow) and protein (green) pathways significantly changed in ICM and DCM, followed by list of pathways in ICM and DCM that were regulated at both the protein and metabolite level. b Illustrative example of protein and metabolite changes in Estrogen pathway. Source data are provided as a Source Data file.
Fig. 5
Fig. 5. Network analysis.
a, b Network analyses illustrating functional protein (circles) and metabolite (squares) nodes in ICM and DCM left ventricular myocardium. Nodes colour coded according to functional classification. Plot illustrating metabolite-gender interaction in ICM (c) and DCM (d), and protein-gender interaction in ICM and DCM (e). Source data are provided as a Source Data file.

Similar articles

Cited by

References

    1. Lal S, et al. Best Practice BioBanking of Human Heart Tissue. Biophys. Rev. 2015;7:399–406. - PMC - PubMed
    1. Cao J, et al. Myocardial substrate changes in advanced ischaemic and advanced dilated human heart failure. Eur. J. Heart. Fail. 2019;21:1042–1045. - PubMed
    1. Lal S, et al. Tissue microarray profiling in human heart failure. Proteomics. 2016;16:2319–2326. - PubMed
    1. Mamidi R, et al. Dose-dependent effects of the myosin activator omecamtiv mecarbil on cross-bridge behavior and force generation in failing human myocardium. Circ. Heart. Fail. 2017;10:e004257. - PMC - PubMed
    1. Sequeira V, et al. ADP-stimulated contraction: a predictor of thin-filament activation in cardiac disease. Proc. Natl Acad. Sci. USA. 2015;112:E7003–E7012. - PMC - PubMed

Publication types

MeSH terms