. 2020 Jun 2;11(1):2749.
doi: 10.1038/s41467-020-16583-0.

The tumour microenvironment shapes dendritic cell plasticity in a human organotypic melanoma culture

Affiliations

The tumour microenvironment shapes dendritic cell plasticity in a human organotypic melanoma culture

S Di Blasio et al. Nat Commun. .

Abstract

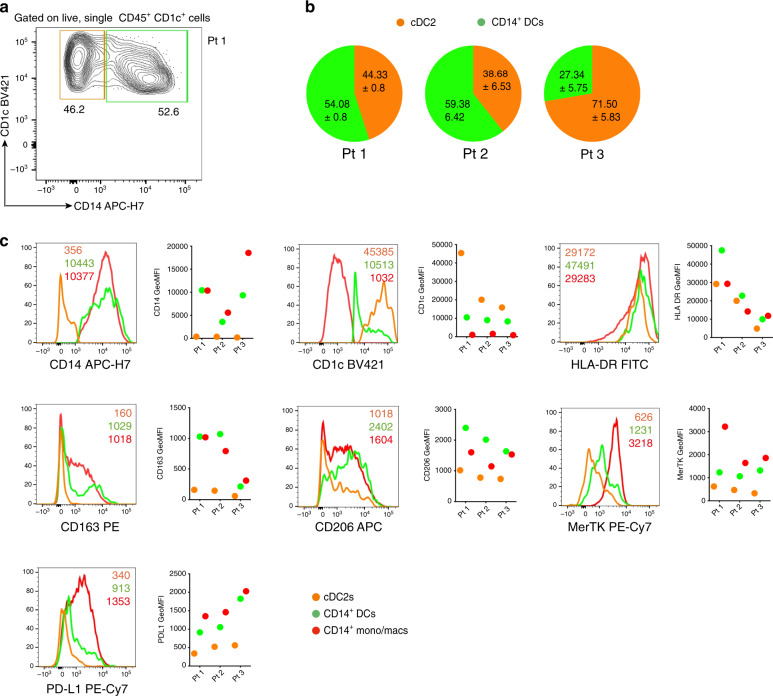
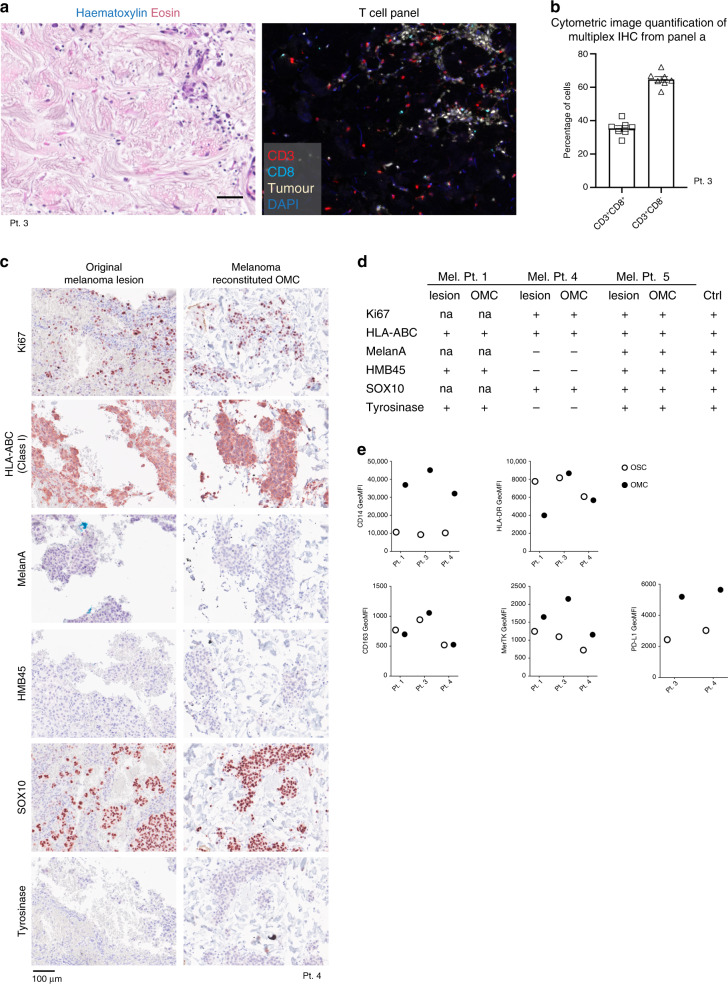
The tumour microenvironment (TME) forms a major obstacle in effective cancer treatment and for clinical success of immunotherapy. Conventional co-cultures have shed light onto multiple aspects of cancer immunobiology, but they are limited by the lack of physiological complexity. We develop a human organotypic skin melanoma culture (OMC) that allows real-time study of host-malignant cell interactions within a multicellular tissue architecture. By co-culturing decellularized dermis with keratinocytes, fibroblasts and immune cells in the presence of melanoma cells, we generate a reconstructed TME that closely resembles tumour growth as observed in human lesions and supports cell survival and function. We demonstrate that the OMC is suitable and outperforms conventional 2D co-cultures for the study of TME-imprinting mechanisms. Within the OMC, we observe the tumour-driven conversion of cDC2s into CD14+ DCs, characterized by an immunosuppressive phenotype. The OMC provides a valuable approach to study how a TME affects the immune system.


Conflict of interest statement

The authors declare no competing interests.

Figures

Fig. 1
Fig. 1. Human OMC generation and characterization.
a Overview of the OMC generation (prior to immune cell addition). b Histological comparison of tissue sections obtained from primary tumour lesion (left) and OMC (right), showing epidermal and dermal compartments with interspersed tumour cells. Haematoxylin-eosin staining, representative pictures (n = 3). Representative areas (n = 3) of primary tumour lesion (left) and OMC (right), showing triplex fluorescent staining of Ki67 (magenta), tumour marker (yellow) and DAPI (blue) fluorescence IHC staining. Composite and single colour images of higher magnification are shown. Arrows indicate proliferating tumour cells. Representative flow cytometry histogram of Ki67+ cells measured within the OMC-digested live CD45-negative fraction. c Multiplex fluorescence IHC shows representative area (n = 3) of the tumour lesion (left) and the OMC (right) containing fibroblasts (fibroblast-specific protein 1, FSP1+ cells, magenta) and melanoma cells (tumour marker (tyrosinase and SOX10)+ cells, yellow). DAPI (blue) indicates nuclei. Inserts show higher magnification. Pseudo-DAB of isolated fluorescent channels of the same areas are shown and fibroblasts are indicated with arrows. Scale bars, 100 μm. Source data are provided as a Source data file.
Fig. 2
Fig. 2. The OMC microenvironment sustains immune cell survival and distribution.
a Overview of the experimental approach used to obtain an immunocompetent OMC. b Tissue classification and DC localization within the selected ROI. Coloured dots indicate distribution of immune (red) and other cell types (pink), based on tissue segmentation and positivity score (upper panel, 1); cytometric image analysis and gating strategy to identify viable DCs (DAPI+ Cleaved-Caspase-3 CD45+ events) (lower panel, 2). c Viable cDC2s as a result of the gating strategy visualized in the original image, showing a representative selection of gated events. DAPI (blue), CD45 (green). d Quantification of viable, immune cells/mm2 in at least 5 sections per construct, wherein colours indicate two independent experiments. Source data are provided as a Source data file.
Fig. 3
Fig. 3. Visualization of cDC2-tumour cell interaction.
a Section of OMC showing multiplex fluorescence immunohistochemistry representative area. cDC2s (CD45+ cells, green) are found in close proximity to melanoma cells (tumour (tyrosinase and SOX10)+ cells, yellow) and fibroblasts (FAP+ cells, magenta). DAPI (blue) indicates nuclei (n = 2). b PKH26 (yellow) and second harmonic generation (SHG, cyan) signals of multiphoton images, acquired with excitation wavelength (λ) of 950 nm. PKH26 signal indicates cDC2s; SHG was generated by collagen bundles. c Characteristic amoeboid behaviour of DCs patrolling the environmental niche. d Representative time points during time-lapse recording of melanoma BLM cells expressing GFP [λ (excitation) = 950 nm]. BLM cells showed high cellular dynamics (dotted lines; protrusion, white arrowhead and retraction, blue arrow). e, f Representative time points during time-lapse recording of cDC2s (PKH26)-tumour cell (GFP) interaction [λ (excitation) = 950 nm]. e DC (dotted line, white) sensed and sampled tumour-derived particle (dotted line, yellow). f Prolonged interaction of DCs with tumour-derived fragments. Tumour cells showed intense membrane dynamics and blebbing. Scale bars, 20 μm.
Fig. 4
Fig. 4. Identification and phenotypic characterization of CD14+ DCs isolated from the human OMC.
a Two days after cDC2s injection, OMCs were digested and cell suspensions were stained. Representative flow cytometry contour plots showing gated cDC2s (CD1c+CD14 cells) and CD14+ DCs (CD1c+CD14+ cells) in OSCs (upper contour plots) and OMCs (lower counter plots). Results obtained with three different melanoma cell lines (BLM, Mel624, A375) are shown. Numbers indicate the percentage of gated cells. b Pie charts depicting the frequency of cDC2s and CD14+ DCs in OSCs and OMCs. Independent experiments were performed with three different melanoma cell lines: BLM (n = 8), Mel624 (n = 2), A375 (n = 2). Frequencies from control OSCs are pooled (n = 12). Data are mean ± SD. c Graphs showing the frequency of cDC2s (p = 0.0005) and CD14+ DCs (p = 0.0005) in OSCs and OMCs (across the three melanoma cell lines). A non-parametric two-tailed Wilcoxon signed-rank test was used for statistical analysis. d Representative overlaid histogram plots showing expression of the indicated markers in cDC2s and CD14+ DCs isolated from OMCs. For each marker a summary graph reporting the ratio of the geometric mean of the fluorescence intensity (GeoMFI) between CD14+ DCs and cDC2s isolated from OSCs and OMCs is shown. A blue background indicates a GeoMFI ratio <1, higher expression in cDC2s; whereas a red background indicates a GeoMFI ratio >1, higher expression in CD14+ DCs. At least n = 3 donors for each marker are included. The p values were estimated using a non-parametric two-tailed Wilcoxon signed-rank test. e Representative histogram plots and GeoMFI graphs of macrophage-related markers CD163, CD206 and MerTK in cDC2s and CD14+ DCs isolated from OMCs. At least n = 3 donors for each marker are provided. The p values were estimated using a non-parametric two-tailed Wilcoxon signed-rank test. Statistical significance was annotated as follows: *p < 0.05, ***p < 0.001. Source data are provided as a Source data file.
Fig. 5
Fig. 5. Effect of soluble factors and dimensionality on the CD14+ DC conversion and phenotype.
a Frequency of CD14+ DCs upon culture of cDC2s in DC medium (n = 5), BLM-conditioned medium (n = 5) or OMC-conditioned medium (n = 4). Each symbol represents an individual donor (Mean±SEM; one-way ANOVA and Tukey’s multiple comparisons tests). b Heatmap of the indicated soluble factors in conditioned media (CM) from 2D-cultured Fibroblasts and BLM cells, as well as from 3D-cultured OSC and OMC, as assessed by Luminex-based bead immunoassay and dedicated PGE2 ELISA. c Frequency of CD14+ DCs in cDC2s cultured in DC medium (n = 4) only, in the absence or presence of recombinant human (rh) factors (n = 4). Each symbol represents an individual donor (mean ± SEM; two-way ANOVA and Tukey’s multiple comparisons tests). d Fold change of the percentage of CD14+DCs relative to their frequency in DC medium. IL-6 blockade attenuates the cDC2s conversion induced by rhIL-6 (n = 4), BLM-c.m. (n = 5) and OMC-c.m (n = 2). Each symbol represents an individual donor (mean ± SEM; two-tailed paired t tests) (p = 0.0024). e Flow cytometry analysis shows phenotype of cDC2s and CD14+ DCs isolated from OMCs and conventional tumour-cDC2 co-cultures (2D). Overlaid histograms for the indicated markers, from one representative experiment out of four, are shown. Colour legends indicate: cDC2s (orange), CD14+DCs (green). Statistical significance was annotated as follows: *p < 0.05, **p < 0.01, ***p < 0.001. Source data are provided as a Source data file.
Fig. 6
Fig. 6. Functional characterization of cDC2s and CD14+ DCs isolated from human OMC.
a Two days after total cDC2s injection, BLM-OMCs were digested and CD1c+CD14 (cDC2s) and CD1c+CD14+ (CD14+DCs) subsets FAC-sorted for RNA extraction and molecular characterization by qRT-PCR. Gene expression levels (2−ΔCt) for the indicated genes in cDC2s and CD14+DCs. Reported values for each gene are the means of n = 3 biological replicates (mean ± SEM; two-way ANOVA and Sidak’s multiple comparisons test). ACTB was used as internal reference. Colour legends indicate: cDC2s (orange), CD14+DCs (green). b IL-6 production assayed by intracellular cytokine staining in BLM-educated cDC2s, upon stimulation with LPS (1 μg/mL) for 6 h. cDC2s and CD14+DCs were identified and gated based on CD1c and CD14 expression in CD45+ live single cells. Representative dot plots are shown. Numbers indicate the percentage of gated cells. c Intracellular protein expression of S100A9 in tumour-educated cDC2s and CD14+DCs. Representative GeoMFI histograms for BLM and Mel624 are shown. d Proliferation of allogeneic CD3+ T cells 5 days after co-culture with FAC-sorted cDC2s and CD14+DCs. Scattered dot plots (five independent experiments, in triplicate (Exps. 1–2-3) and duplicate (Exps. 4-5) samples; mean ± SEM; one-way analysis of variance (ANOVA) and Tukey’s multiple comparisons tests). Representative CFSE histogram plots from Exp. 2 are shown; numbers indicate the percentage of gated cells. e Biplot of HLA-DR expression and induced allogeneic T-cell proliferation in Exps. 4 and 5. Correlation assessed by linear regression. f Autologous T cells were co-cultured with cDC2s and CD14+DCs for 5 days and then stained for HLA-DR, CD25, CD3, CD8 and live/dead marker. Percentage of activated CD25+HLA-DR+ cells in total CD3+ T cells is reported. Scattered dot plots (two independent experiments, in triplicate samples (mean ± SEM; one-way analysis of variance (ANOVA) and Tukey’s multiple comparisons tests). Representative dot plots from Exp. 1 are shown. Statistical significance was annotated as follows: **p < 0.01, ***p < 0.001, ****p < 0.0001. Source data are provided as a Source data file.
Fig. 7
Fig. 7. CD14+DCs in melanoma lesion phenotypically resemble those recapitulated in human OMC.
Human metastatic melanoma lesions were digested and stained (n = 3). a CD1c+CD14 (cDC2s) and CD1c+CD14+ (CD14+ DCs) were identified and gated based on CD1c and CD14 expression in CD45+CD1c+ live single cells. A representative contour plot from one patient (Pt. 1) is shown. b Pie charts report percentages (mean ± SD) of cDC2s and CD14+ DCs across different melanoma patients (n = 3, in triplicate samples; mean ± SD). c Graphs showing GeoMFI’s of the phenotypic analysis of cDC2s, CD14+ DCs and CD14+ mono/macs defined within intra-tumoural CD45+CD11c+ live single cells from melanoma patient samples. Representative histogram plots for each indicated marker are shown. Colour legends indicate: cDC2s (orange), CD14+ DCs (green), CD14+ mono/macs (red). Source data are provided as a Source data file.
Fig. 8
Fig. 8. Analysis of patient-derived OMC.
a, b Comparison of melanoma patient’s cell suspension cultured in a de-epidermized human dermis versus ex vivo analysis. Two days after injection, microtissues containing the patient material were fixed and processed for paraffin embedding. a Multiplex IHC staining on tissue sections was performed using the following antibodies: CD3 (red), CD8 (light blue) and tumour marker (white). The latter consists of a mix of antibodies recognizing the melanoma antigens: HMB45 (gp100), MelanA (MART-1), Tyrosinase and SOX10. Representative H&E stain and multicolour composite pictures for T-cell-related antibodies (T-cell panel) are shown (n = 1, Pt. 3). Scale bar, 50 µm. b Cytometric image manual quantification analysis of multiplex IHC sections (n = 7) shown in panel (a), to identify lymphocytes (tumour marker-CD3+CD8+ and Tumour marker-CD3+CD8 events). Mean ± SEM; two-tailed unpaired t tests) (p < 0.0001) (Gating strategy is shown in Supplementary Fig. 11). c, d Representative IHC images of tumour-specific characteristics in original melanoma lesion (left) and pt-derived OMC (right) (n = 3). Scale bars, 100 μm. d Overview of tumour-specific characteristics in original melanoma lesions and pt-derived OMCs. Ctrl is control melanoma tissue. e Graphs reporting the Geometric mean of fluorescence intensity (GeoMFI) of the indicated markers in CD14+ monocytes cultured within OSCs or pt-derived OMCs (n = 3; except for PD-L1: n = 2). Source data are provided as a Source Data file.

References

    1. Zou W. Immunosuppressive networks in the tumour environment and their therapeutic relevance. Nat. Rev. Cancer. 2005;5:263–274. - PubMed
    1. Pitt JM, et al. Targeting the tumor microenvironment: removing obstruction to anticancer immune responses and immunotherapy. Ann. Oncol. 2016;27:1482–1492. - PubMed
    1. Klemm F, Joyce JA. Microenvironmental regulation of therapeutic response in cancer. Trends Cell Biol. 2015;25:198–213. - PMC - PubMed
    1. Gajewski TF. Failure at the effector phase: immune barriers at the level of the melanoma tumor microenvironment. Clin. Cancer Res. 2007;13:5256–5261. - PubMed
    1. Feder-Mengus C, Ghosh S, Reschner A, Martin I, Spagnoli GC. New dimensions in tumor immunology: what does 3D culture reveal? Trends Mol. Med. 2008;14:333–340. - PubMed

Publication types