. 2020 Jun 2;11(1):2764.
doi: 10.1038/s41467-020-16594-x.

Supernumerary B chromosomes of Aegilops speltoides undergo precise elimination in roots early in embryo development

Affiliations

Supernumerary B chromosomes of Aegilops speltoides undergo precise elimination in roots early in embryo development

Alevtina Ruban et al. Nat Commun. .

Abstract

Not necessarily all cells of an organism contain the same genome. Some eukaryotes exhibit dramatic differences between cells of different organs, resulting from programmed elimination of chromosomes or their fragments. Here, we present a detailed analysis of programmed B chromosome elimination in plants. Using goatgrass Aegilops speltoides as a model, we demonstrate that the elimination of B chromosomes is a strictly controlled and highly efficient root-specific process. At the onset of embryo differentiation B chromosomes undergo elimination in proto-root cells. Independent of centromere activity, B chromosomes demonstrate nondisjunction of chromatids and lagging in anaphase, leading to micronucleation. Chromatin structure and DNA replication differ between micronuclei and primary nuclei and degradation of micronucleated DNA is the final step of B chromosome elimination. This process might allow root tissues to survive the detrimental expression, or overexpression of B chromosome-located root-specific genes with paralogs located on standard chromosomes.


Conflict of interest statement

The authors declare no competing interests.

Figures

Fig. 1
Fig. 1. Root-restricted elimination of B chromosomes starts with radicle formation at the onset of embryo differentiation of Ae. speltoides.
a Flow cytometric histograms representing the DNA content of nuclei of 17 DAP 0B and +B embryos. Black peaks correspond to 0B nuclei with 2C or 4C DNA content and red peaks correspond to nuclei containing B chromosomes. The presence of additional 0B peaks in +B embryos implies that the elimination of Bs had been initiated prior to this stage of embryogenesis. Tissue sections (b, c) of +B embryos and (d) seedling after FISH using the B-specific probe AesTR-183. For each stage of embryo/plant development 2–4 embryos/seedlings were sectioned and analyzed. Obtained results were consistent. b Embryo at the stage of 5 DAP exhibits B-specific signals in all cells. Scale bar, 10 µm. c 15 DAP old embryo exhibiting complete absence of Bs in root cells. Root region is indicated by arrowheads. Scale bar, 100 µm. d Tissue section of a one-day-old seedling. The transition zone between B-positive leaf and B-negative root tissues is marked by yellow dotted lines. Scale bar, 100 µm. The insert shows the seedling with the sectioning plane marked by a black dashed line. Scale bar, 5 mm.
Fig. 2
Fig. 2. Nondisjunction of centromere-active B chromosomes results in the formation of micronuclei.
a Anaphase with lagging Bs after immunostaining of CENH3 (in purple) and α-tubulin (in green), for further details see Supplementary Movie 1. Scale bar, 5 µm. FISH signals of the B-specific probes AesTR-183 and AesTR-205 are shown in yellow. Scale bar, 10 µm. The enlarged regions (b, c) are marked by rectangles. Interaction of α-tubulin with the CENH3-positive centromeres of (b) A- and (c) B chromosomes. Scale bar, 1 µm. In total 7 anaphase cells with lagging B chromosomes were analyzed in 3 embryos using super resolution microscopy. On 5 from those cells interaction of α-tubulin with the CENH3-positive centromeres was consistently observed. d Formation of B-containing micronuclei during telophase. Note the position of centromeres on the opposite sides of the micronuclei resulting from the spindle microtubule tension during anaphase. The centromeric signals were observed for 60 micronuclei in 10 embryos. Scale bar, 10 µm. e Box plot showing CENH3 signal volumes (Y-axis, µm3) on A- and B centromeres at anaphase. Measurements are performed for 7 anaphase cells and data are statistically treated. Because the data failed the normality test, a Mann–Whitney test for comparison of both centromere types was performed. The data were not significantly different (P = 0.363). The box indicates the 25th–75th percentiles, the line marks the median. The error bars indicate the 10th and 90th percentiles and the open circles the outlying points. Source data underlying e are provided as a Source data file.
Fig. 3
Fig. 3. Chromatin structure and replication differs between micronuclei and primary nuclei.
a Micronuclei chromatin assessed by the TUNEL assay. 9% (n = 184) of analyzed micronuclei (arrowed) were TUNEL positive (in green). Scale bar, 10 µm. b None of the micronuclei (n = 120) incorporated EdU, despite normal DNA replication of the primary nuclei. EdU is shown in purple, the B-specific FISH probe AesTR-183 in green. Scale bar, 10 µm. cf Electron micrographs of ultra-thin tissue sections of developing +B embryos. Micronuclei (n = 30) are marked by red squares and are further enlarged. c, d A micronucleus with a disrupted membrane (arrowed, was observed in 20% of the cases) and an increased chromatin density (43% of micronuclei showed dense chromatin) in comparison to the corresponding nucleus. Scale bar, 1 µm. e, f Micronucleus surrounded by an intact double membrane and with a considerable amount of euchromatin. Scale bar, 1 µm.
Fig. 4
Fig. 4. Multichromosomal origin of Ae. speltoides B chromosomes.
Visualisation generated with Circos. For clarity and visual aspects, the size of both, mitochondrial and chloroplast organelles, are depicted with a ×1000 magnification. The heatmap illustrates B assigned sequence segments, derived from the number of aligned microdissected reads. All other chromosomes are depicted at real Mb length and are analyzed in 5 Mb window segments. The order of B-assigned sequence segments were not resolved: the respective segments are constituted as aggregated blocks. (A) Chromosome IDs and Mb scales (B) Gene locations (yellow) in 5 Mb segments (C) Centromere locations (D) Heatmap (quantity of B assigned seq. bp) in 5 Mb segments (E) Linked segments of B origins. Source data are provided as a Source data file.
Fig. 5
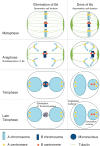
Fig. 5. Schematic comparison of the cellular process of B elimination with the process of post-meiotic B chromosome drive reveals striking similarities.
In both processes, nondisjunction of Bs occurs despite centromere activity and centromere-tubulin interaction. Spindle symmetry differs between the two processes: during the first pollen mitosis an asymmetric cell division occurs whereas the spindle in roots is symmetrical. Therefore, in roots, lagging B chromosomes form micronuclei and undergo elimination. In contrast, due to the asymmetric geometry of the spindle at first pollen mitosis, the inclusion of the lagging joint B chromatids in the generative nucleus takes place and chromosome accumulation occurs.

References

    1. Wang J, Davis RE. Programmed DNA elimination in multicellular organisms. Curr. Opin. Genet Dev. 2014;27:26–34. - PMC - PubMed
    1. Smith JJ. Programmed DNA elimination: keeping germline genes in their place. Curr. Biol. 2018;28:R601–R603. - PubMed
    1. Marcussen T, et al. Ancient hybridizations among the ancestral genomes of bread wheat. Science. 2014;345:1250092. - PubMed
    1. Mendelson D, Zohary D. Behavior and transmission of supernumerary chromosomes in Aegilops speltoides. Heredity. 1972;29:329–339.
    1. Jones RN, Rees H. B chromosomes. New York: Academic Press; 1982.

Publication types

LinkOut - more resources