. 2020 Jun 2;10(1):8943.
doi: 10.1038/s41598-020-65696-5.

Ultra-rapid glutathionylation of chymotrypsinogen in its molten globule-like conformation: A comparison to archaeal proteins

Affiliations

Ultra-rapid glutathionylation of chymotrypsinogen in its molten globule-like conformation: A comparison to archaeal proteins

Alessio Bocedi et al. Sci Rep. .

Abstract

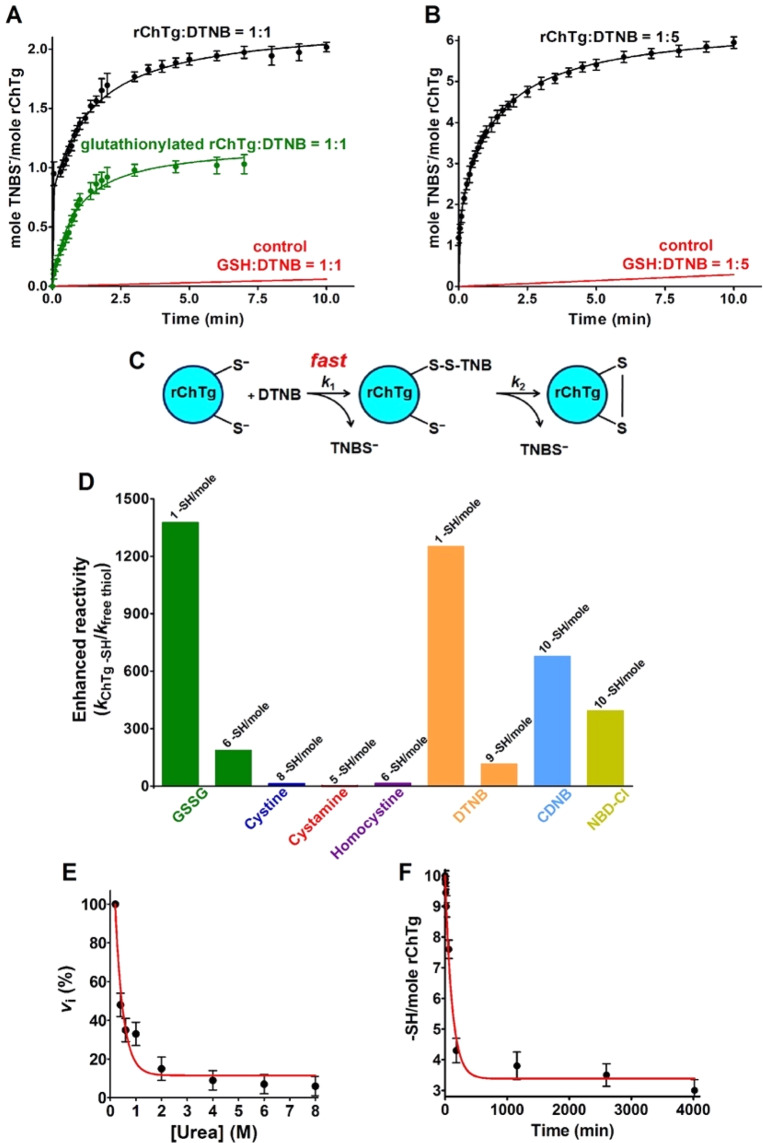
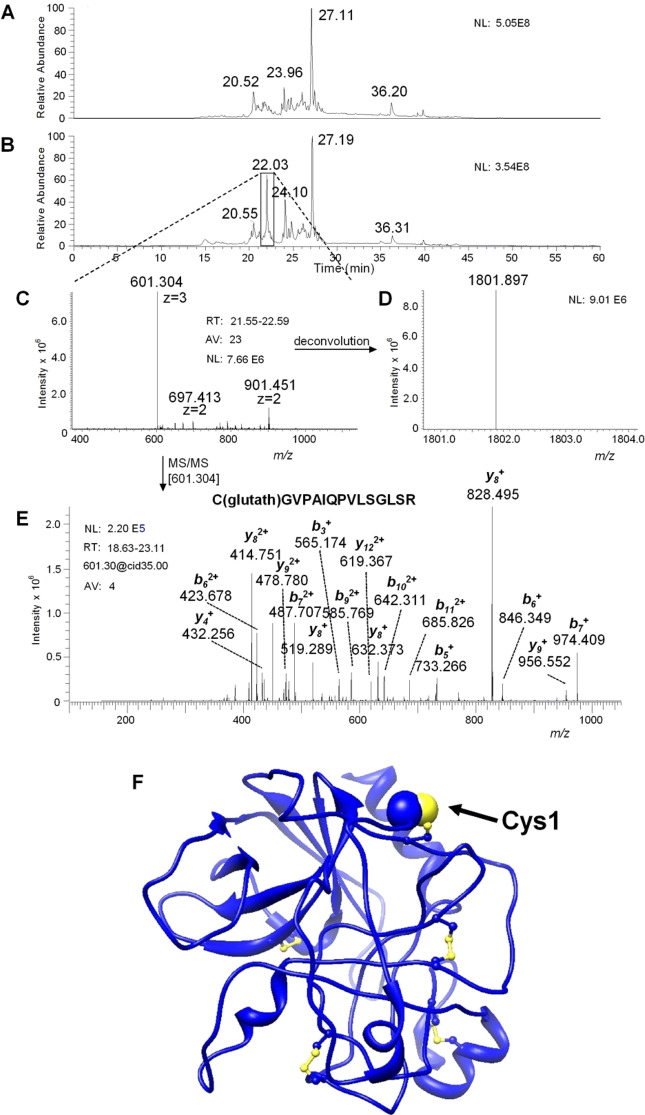
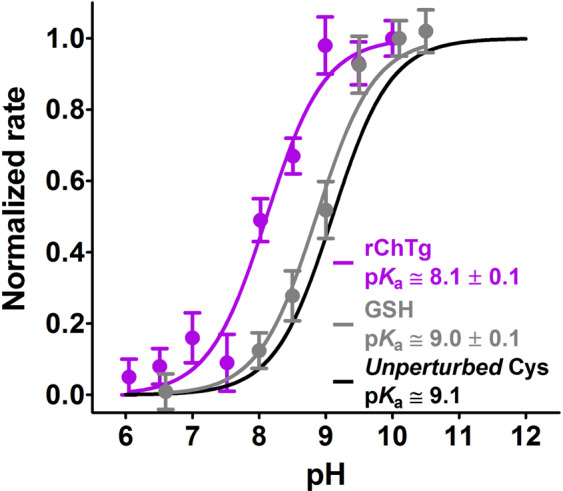
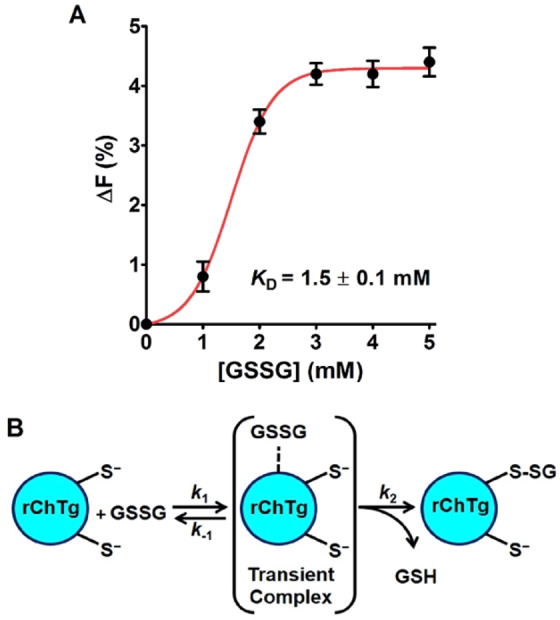
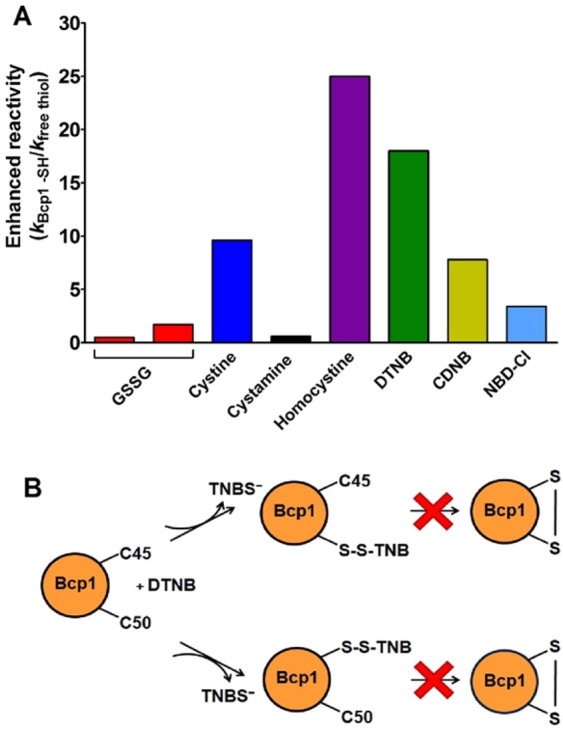
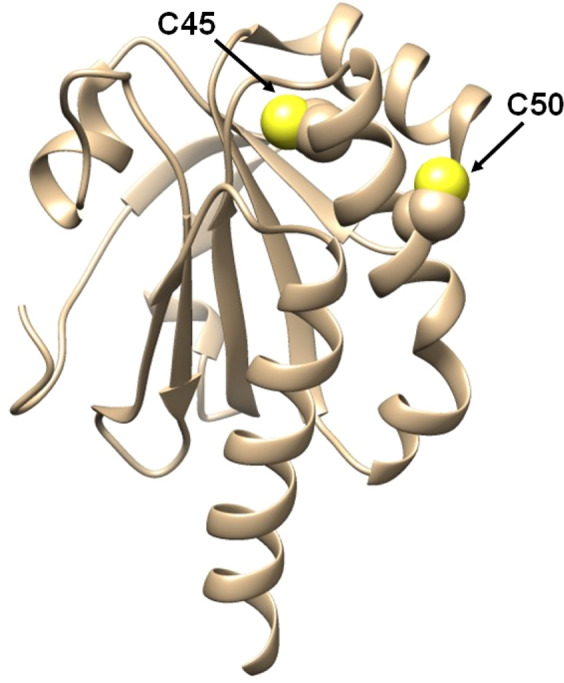
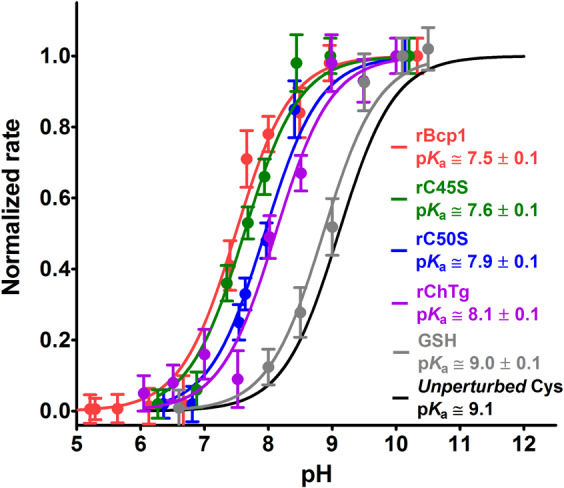
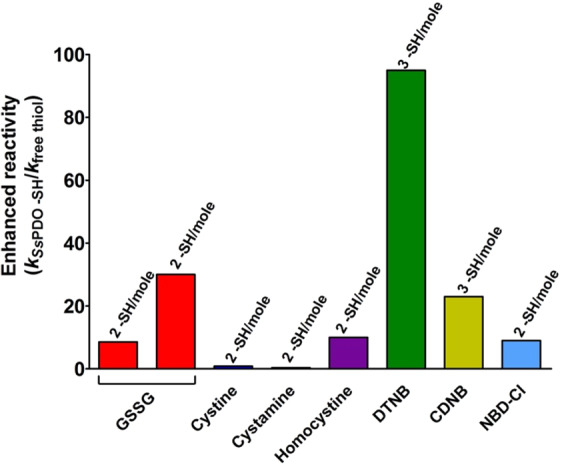
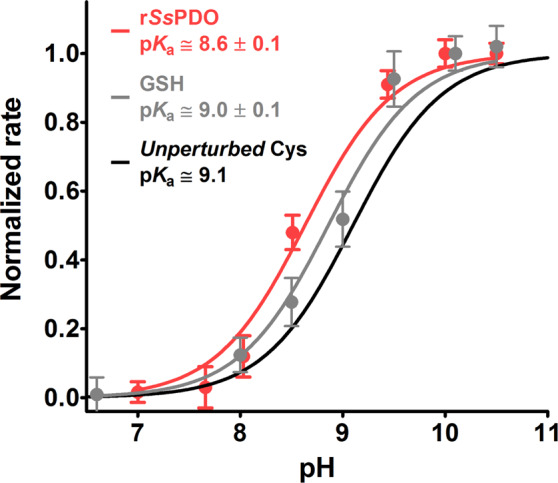
Chymotrypsinogen, when reduced and taken to its molten globule-like conformation, displays a single cysteine with an unusual kinetic propensity toward oxidized glutathione (GSSG) and other organic thiol reagents. A single residue, identified by mass spectrometry like Cys1, reacts with GSSG about 1400 times faster than an unperturbed protein cysteine. A reversible protein-GSSG complex and a low pKa (8.1 ± 0.1) make possible such astonishing kinetic property which is absent toward other natural disulfides like cystine, homocystine and cystamine. An evident hyper-reactivity toward 5,5'-dithiobis-(2-nitrobenzoic acid) (DTNB) and 1-chloro-2,4-dinitrobenzene (CDNB) was also found for this specific residue. The extraordinary reactivity toward GSSG is absent in two proteins of the thermophilic archaeon Sulfolobus solfataricus, an organism lacking glutathione: the Protein Disulphide Oxidoreductase (SsPDO) and the Bacterioferritin Comigratory Protein 1 (Bcp1) that displays Cys residues with an even lower pKa value (7.5 ± 0.1) compared to chymotrypsinogen. This study, which also uses single mutants in Cys residues for Bcp1, proposes that this hyper-reactivity of a single cysteine, similar to that found in serum albumin, lysozyme, ribonuclease, may have relevance to drive the "incipit" of the oxidative folding of proteins from organisms where the glutathione/oxidized glutathione (GSH/GSSG) system is present.


Conflict of interest statement

The authors declare no competing interests.

Figures

Figure 1
Figure 1
Representative scheme of α-chymotrypsin activation. Residues that undergo hydrolysis are represented in red, cysteines are shown in yellow and the black lines represent the disulfide bridges.
Figure 2
Figure 2
Reactivity of rChTg cysteines. (A) TNBS- release after reaction of rChTg (0.58 µM, 5.8 µM protein -SH) with substoichiometric DTNB (0.58 µM) in 50 mM acetate buffer at pH 5.0, 0.2 M urea 25 °C (black line). The same rection as above but after 20 min incubation of 0.58 µM of rChTg with 1 mM GSSG (green line). Reaction of GSH (5.8 µM) with DTNB (0.58 µM) in the same conditions (red line). (B) TNBS- release after reaction of rChTg (0.58 µM, 5.8 µM protein -SH) with substoichiometric DTNB (2.9 µM) in 50 mM acetate buffer at pH 5.0, 0.2 M urea 25 °C. Reaction of GSH (5.8 µM) with DTNB (2.9 µM) in the same conditions (red line). (C) Schematic representation of the reaction of rChTg with stoichiometric DTNB. (D) “Enhanced reactivity” of rChTg toward disulfides and thiol reagents i.e. second order kinetic constants of rChTg (kChTg -SH) normalized to the constant calculated for an unperturbed protein cysteine for GSSG or normalized to the constants for free GSH for all other reagents (kfree thiol) (see Table 1). The number of protein cysteines per mole with a given reactivity is indicated on the top of each column. (E) Reactivity of cysteines in rChTg (0.6 µM) toward DTNB (47.5 μM) at variable urea concentrations (pH 5.0) (25 °C) (circles, red line). Rate of reaction of 10 µM free cysteine (or GSH) with 50 µM DTNB was not inhibited by 8 M urea (not shown). The error bars represent the S.D. from three independent experiments. (F) Disappearence of rChTg cysteines (5 µM, 50 µM protein -SH) during the reaction with 1 mM GSSG at pH 5.0, 0.2 M urea (25 °C). The error bars represent the S.D. from three independent experiments.
Figure 3
Figure 3
MS and MS/MS analysis. (A) Total ion current (TIC) nano-HPLC-ESI-MS profile of the tryptic digest of reduced chymotrypsinogen A and treated with bromopyruvic acid. (B) TIC nano-HPLC-ESI-MS profile of the tryptic digest of reduced chymotrypsinogen A and treated with glutathione before the reaction with bromopyruvic acid. The comparison of the two profiles evidenced a new peak with an elution time of 22.03 min in the tryptic digest. (C) The peak was related to a peptide with a [M + 3 H]3+ = 601.304 m/z (and a [M + 2 H]2+ = 901.451 m/z). (D) The deconvolution provided the monoisotopic [M + H]1+ = 1801.897 m/z of the peptide. (E) The collision induced dissociation CID MS/MS carried out on the ion [M + 3 H]3+ = 601.304 m/z, elaborated by manual inspection and by the Proteome Discover software, was in perfect agreement with the theoretical fragmentation of the tryptic peptide C(Gluthat)GVPAIQPVLSGLSR. This peptide corresponds to amino acid residues 1–15 of chymotrypsinogen A bovine with a glutathione residue linked to Cys1 by a disulfide bridge. (F) Three-dimensional structure of native ChTg from bovine pancreas is represented in blue ribbons; cysteines are in ball-and-stick, the Cys1 is displayed by blue and yellow spheres.
Figure 4
Figure 4
Average pKa determination of ChTg. rChTg (0.6 µM) was reacted with CDNB (1 mM) at variable pH values (purple line). Average pKa = 8.1 ± 0.1 of the ten reactive cysteines in rChTg. As a control experiment GSH (100 µM) was reacted with CDNB (1 mM) at variable pH values (gray line). The error bars represent the S.D. from three independent experiments. The theoretical curve (black line) of an unperturbed protein cysteine (pKa = 9.1) is also reported.
Figure 5
Figure 5
Transient complex formation with GSSG. (A) Quenching of the intrinsic fluorescence of rChTg (0.5 µM) after addition of GSSG (pH 5.0, 25 °C) subtracted from the fluorescence of NATA with GSSG. The error bars represent the S.D. from three independent experiments. (B) Representative reaction scheme of rChTg with GSSG. The glutathionylation occurs at the most reactive cysteine.
Figure 6
Figure 6
Circular dichroism spectra of ChTg and rChTg. CD spectra of native ChTg (1.3 µM) (black line); rChTg (1.3 µM) in 0.2 M urea (blue line) and rChTg (1.3 µM) in 8 M urea (red line). CD spectra were recorded at pH 5.0, 25 °C. The spectrum of rChTg in 8 M urea cannot be extended below 218 nm due to the interference of 8 M urea.
Figure 7
Figure 7
Reactivity of rBcp1 cysteines. (A) “Enhanced reactivity” of rBcp1 toward disulfides and thiol reagents i.e. second order kinetic constants of rBcp1 (kBcp1 -SH) normalized to the constant calculated for an unperturbed protein cysteine for GSSG or normalized to the constants for free GSH for all other reagents (kfree thiol) (see Table 2). (B) Schematic representation of the reaction of native reduced Bcp1 with DTNB, the formation of the intramolecular disulfide does not proceed in the molten globule-like state (see Table 2).
Figure 8
Figure 8
Three-dimensional structure of native Bcp1 from Sulfolobus solfataricus is represented in light brown ribbons. The sulfur atoms of the two cysteines are shown as yellow spheres.
Figure 9
Figure 9
Average pKa determination of Bcp1. rBcp1 (1.25 μM) (red line), rC45S (2.6 μM) (green line) and rC50S (2.6 μM) (blue line) were reacted with DTNB (20 μM) at variable pH values (25 °C). Average pKa values of the reactive cysteine are reported within the graph according with curves colours. As a control experiment, GSH (100 µM) was reacted with CDNB (1 mM) at variable pH values (gray line). The error bars represent the S.D. from three independent experiments. The reference curve (from Fig. 4) of rChTg reacted with CDNB at variable pH values (purple line) is displayed. The theoretical curve (black line) of an unperturbed protein cysteine (pKa = 9.1) is also reported.
Figure 10
Figure 10
Circular dichroism spectra of Bcp1 and its mutants. (A) CD spectra of native Bcp1 (1.25 μM) (black line); rBcp1 (1.25 μM) in 0.2 M urea (blue line) and rBcp1 (1.25 µM) in 8 M urea (red line). The spectrum of rBcP1 in 8 M urea cannot be extended below 218 nm due to the interference of 8 M urea. (B) CD spectra of C45S (1.25 µM) (black line) and rC45S (1.25 μM) in 0.2 M urea (blue line). (C) CD spectra of C50S (1.25 µM) (black line) and rC50S (1.25 µM) in 0.2 M urea (blue line). CD spectra for the three proteins were recorded at pH 7.4, 25 °C.
Figure 11
Figure 11
Reactivity of rSsPDO cysteines. “Enhanced reactivity” of rSsPDO toward disulfides and thiol reagents i.e. second order kinetic constants of rSsPDO (kSsPDO -SH) normalized to the constant calculated for an unperturbed protein cysteine for GSSG or normalized to the constants for free GSH for all other reagents (kfree thiol) (see Table 3).
Figure 12
Figure 12
Average pKa determination of SsPDO. rSsPDO (1 µM) was reacted with CDNB (1 mM) at variable pH values (red line). Average pKa = 8.6 ± 0.1 of the three reactive cysteines in rSsPDO. As a control experiment, GSH (100 µM) was reacted with CDNB (1 mM) at variable pH values (gray line). The error bars represent the S.D. from three independent experiments. The theoretical curve (black line) of an unperturbed protein cysteine (pKa = 9.1) is also reported.
Figure 13
Figure 13
Circular dichroism spectra of SsPDO and rSsPDO. CD spectra of native SsPDO (1 µM) (black line) in H2O, 25 °C; rSsPDO (1 µM) in 0.6 M urea (blue line) and rSsPDO (1 µM) in 8 M urea (red line) at pH 7.4, 25 °C. The spectrum of rSsPDO in 8 M urea cannot be extended below 218 nm due to the interference of 8 M urea.

Similar articles

Cited by

References

    1. Bocedi A, et al. The extreme hyper-reactivity of selected cysteines drives hierarchical disulfide bond formation in serum albumin. FEBS J. 2016;283:4113–4127. doi: 10.1111/febs.13909. - DOI - PubMed
    1. Bocedi A, et al. The extreme hyper-reactivity of Cys94 in lysozyme avoids its amorphous aggregation. Sci. Rep. 2018;8:16050. doi: 10.1038/s41598-018-34439-y. - DOI - PMC - PubMed
    1. Bocedi A, et al. Ultra-Rapid Glutathionylation of Ribonuclease: Is this the Real Incipit of its Oxidative Folding? Int. J. Mol. Sci. 2019;20:E5440. doi: 10.3390/ijms20215440. - DOI - PMC - PubMed
    1. Chakravarthi S, Jessop CE, Bulleid NJ. The role of glutathione in disulphide bond formation and endoplasmatic-reticulum-generated oxidative stress. EMBO Rep. 2006;7:271–275. doi: 10.1038/sj.embor.7400645. - DOI - PMC - PubMed
    1. Bass R, Ruddock LW, Klappa P, Freedman RB. A major fraction of endoplasmic reticulum-located glutathione is present as mixed disulfides with protein. J. Biol. Chem. 2004;279:5257–5262. doi: 10.1074/jbc.M304951200. - DOI - PubMed

Publication types

MeSH terms