. 2020 Jun 1;10(1):176.
doi: 10.1038/s41398-020-0858-y.

Impaired mitochondrial complex I function as a candidate driver in the biological stress response and a concomitant stress-induced brain metabolic reprogramming in male mice

Affiliations

Impaired mitochondrial complex I function as a candidate driver in the biological stress response and a concomitant stress-induced brain metabolic reprogramming in male mice

Tim L Emmerzaal et al. Transl Psychiatry. .

Abstract

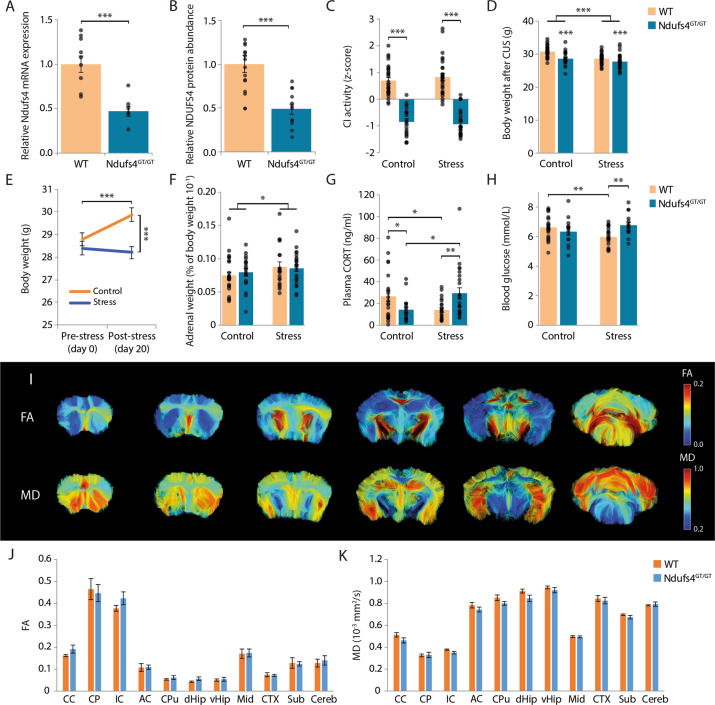
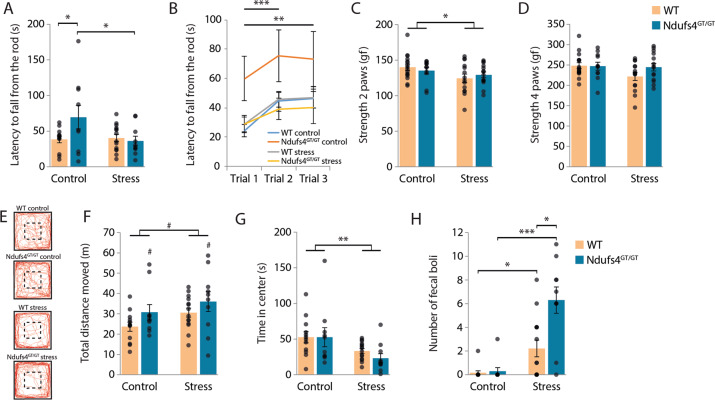
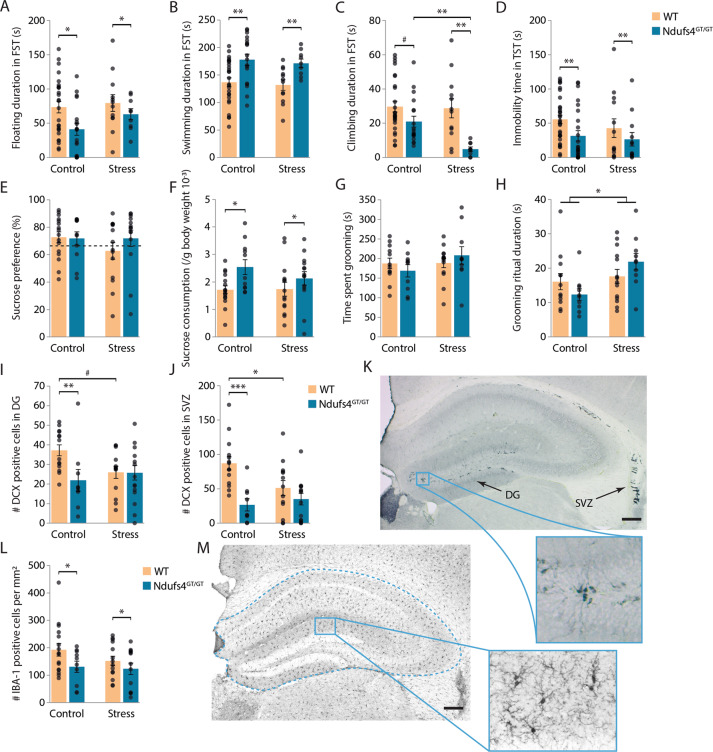
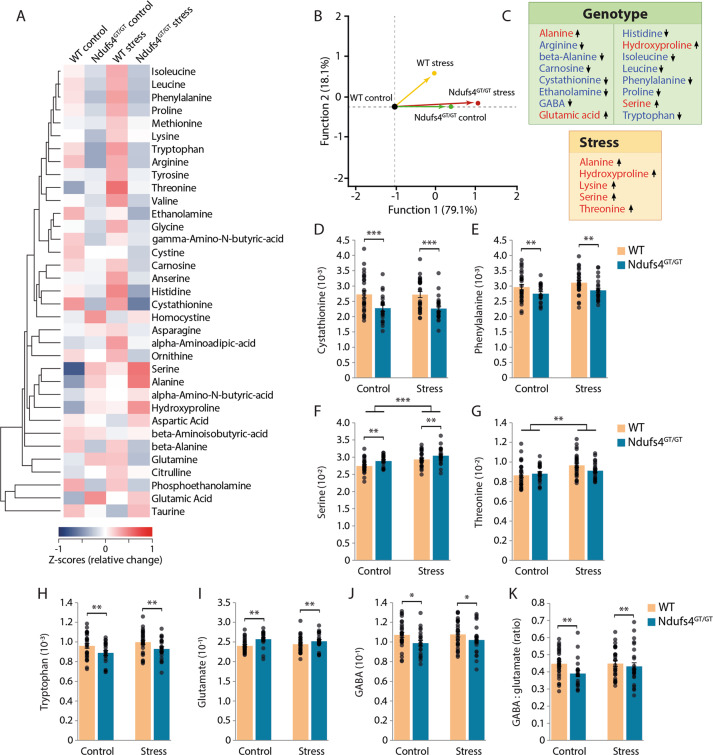
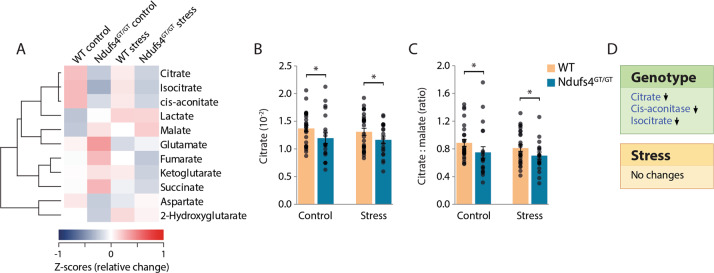
Mitochondria play a critical role in bioenergetics, enabling stress adaptation, and therefore, are central in biological stress responses and stress-related complex psychopathologies. To investigate the effect of mitochondrial dysfunction on the stress response and the impact on various biological domains linked to the pathobiology of depression, a novel mouse model was created. These mice harbor a gene trap in the first intron of the Ndufs4 gene (Ndufs4GT/GT mice), encoding the NDUFS4 protein, a structural component of complex I (CI), the first enzyme of the mitochondrial electron transport chain. We performed a comprehensive behavioral screening with a broad range of behavioral, physiological, and endocrine markers, high-resolution ex vivo brain imaging, brain immunohistochemistry, and multi-platform targeted mass spectrometry-based metabolomics. Ndufs4GT/GT mice presented with a 25% reduction of CI activity in the hippocampus, resulting in a relatively mild phenotype of reduced body weight, increased physical activity, decreased neurogenesis and neuroinflammation compared to WT littermates. Brain metabolite profiling revealed characteristic biosignatures discriminating Ndufs4GT/GT from WT mice. Specifically, we observed a reversed TCA cycle flux and rewiring of amino acid metabolism in the prefrontal cortex. Next, exposing mice to chronic variable stress (a model for depression-like behavior), we found that Ndufs4GT/GT mice showed altered stress response and coping strategies with a robust stress-associated reprogramming of amino acid metabolism. Our data suggest that impaired mitochondrial CI function is a candidate driver for altered stress reactivity and stress-induced brain metabolic reprogramming. These changes result in unique phenomic and metabolomic signatures distinguishing groups based on their mitochondrial genotype.


Conflict of interest statement

The authors declare that they have no conflict of interest.

Figures

Fig. 1
Fig. 1. Physiological characterization of Ndufs4GT/GT mice.
a Relative Ndufs4 mRNA expression normalized to B2m and Gapdh using the Pfaffl method in the brain of WT (orange bars) and Ndufs4GT/GT (blue bars) mice. b NDUFS4 protein abundance relative to beta-Actin in the brain. cZ-scores of mitochondrial complex I (CI) activity from hippocampal tissue. d Body weight as measured after 20 days of chronic unpredictable stress (CUS). e Body weight change from the start of chronic stress to the end of the experiment. In this graph, the genotype is not shown since there was no difference in body weight change between WT and Ndufs4GT/GT mice over time. f Adrenal weight expressed as a percentage of the body weight of the animals. g Plasma corticosterone (CORT) levels measured one day after the last stressor. h Blood glucose concentrations measured with a FreeStyle Freedom Lite glucose meter using a drop of trunk blood shortly after decapitation. i Representative images from one animal showing the fractional anisotropy (FA) and mean diffusivity (MD) at different Bregmata. Approximately at Bregma 1.10 mm, 0.62 mm, −0.70 mm, −1.70 mm, −2.80 mm, and −6.24 mm. j FA was measured in several different brain regions. k In these same regions, MD was also measured. Graphs show the geometric mean (a) or average (bh, j, k) ± SEM, with each black dot representing the result of an individual animal. *p < 0.05, **p < 0.01, and ***p < 0.001. Abbreviations: CC, corpus callosum; CP, cerebral peduncle; IC, internal capsule; AC, anterior commissure; CPu, caudate putamen; dHip, dorsal part of the hippocampus; vHip, ventral part of the hippocampus; Mid, midbrain; CTX, cortex; Sub, subthalamic regions; Cereb, cerebellum.
Fig. 2
Fig. 2. Lower mitochondrial complex I function in Ndufs4GT/GT mice did not negatively impact locomotor function or grip strength, but Ndufs4GT/GT mice showed slightly more anxiety-related behavior following stress.
a Average latency to fall from a rotating rod accelerating from 4 to 40 rpm in 300s. b Average latency to fall from the rod during the three individual trials investigating the ability of the mice to adapt to the test. c The average grip strength of the animals was measured using only their forepaws or (d) all four paws. The grip strength test measured the peak force (in gram force, gf) of each animal. e Representative locomotion tracks from the open field with the center area delineated. Animals freely explored the open field for 10 min. Traces of all animals during the open field are shown in Fig. S8. f The total distance moved in meters, (g) average time spent in the center, and (h) defecation during the 10min in the open field were measured. Graphs show average ±SEM, with each black dot representing the result of an individual animal. *p < 0.05, **p < 0.01, and ***p < 0.001, and #p < 0.07.
Fig. 3
Fig. 3. Ndufs4GT/GT animals showed a more active coping style in the forced swim test (FST) and tail suspension test (TST), they also had less neurogenesis and inflammation in the brain.
a The time the animals spent floating, (b) swimming, and (c) climbing was analyzed during the last 4 min of the FST. Floating was defined as minimal movement of one hind paw so the animal could stay above the water without the animal having a clear swimming direction. d During the TST, the total immobility time was measured. e During the sucrose preference test, mice could choose between two bottles, one bottle containing 1% sucrose and one bottle containing tap water. Their sucrose preference was measured as a percentage of total fluid intake. The dotted line indicates 65%, which has been suggested to be the threshold for anhedonia. f Total sucrose consumption was also measured. The total sucrose consumption was normalized with the body weight of each animal. g After spraying the dorsal coat of the animals with a 10% sucrose solution, the total time spent grooming and (h) average grooming ritual duration was measured. Grooming ritual was defined as the time spent grooming divided by the frequency to start grooming. i The number of doublecortin (DCX) positive neurons was counted as a marker for neurogenesis in the subgranular zone of the dentate gyrus (DG). j The number of DCX-positive neurons in the subventricular zone (SVZ) was also measured. k Representative image from the DCX staining showing the hippocampus with DG and SVZ (arrows). The blue rectangle represents an enlargement from the overview detailing DCX-positive cells in the DG. l As a proxy for inflammation in the brain, the number of Ionized calcium-binding adapter molecule 1 (IBA-1) positive microglia were analyzed in the hippocampus. The number of positive cells was normalized to the surface of the measured area. m Representative image from the IBA-1 staining. The number of IBA-1 cells was only counted in the hippocampus and was corrected for the hippocampal surface, as indicated by the dashed blue line. The blue rectangle represents an enlargement from the overview detailing several IBA-1 positive cells. Scale bars indicate 200 µm. Graphs show average ± SEM, with each black dot representing the result of an individual animal. *p < 0.05, **p < 0.01, ***p < 0.001, and #p < 0.07.
Fig. 4
Fig. 4. Ndufs4GT/GT mice and chronically stressed mice show an altered metabolic rewiring.
a Hierarchical clustering heat map of normalized (z-score) levels for all measured amino acid (AA) metabolites. The dendrogram indicates the degree of correlation between each of the metabolites across all four groups. b Stepwise linear discriminant analysis of all AA metabolites indicated that the AA profile discriminated the Ndufs4GT/GT mice from WTs, as well as control from stress mice. c A highlight of the AA metabolites that were found to be statistically different between genotypes (top) or chronic stress condition (bottom). Arrows indicate the direction of the change compared to WT and control. dg The four metabolites selected by the stepwise analysis as major contributing factors discrimination in the LDA analysis; cystathionine, phenylalanine, serine, and threonine, respectively. h Relative tryptophan, (i) glutamate, and (j) gamma-aminobutyric acid (GABA) levels across all four groups. k Relative GABA to glutamate ratio. Data were normalized to total AA concentration and show average ±SEM, with each black dot representing the result of an individual animal. *p < 0.05, **p < 0.01, and ***p < 0.001.
Fig. 5
Fig. 5. Ndufs4GT/GT mice show signs of a reverse flux in the tricarboxylic acid (TCA) cycle.
a Hierarchical clustering heat map of normalized (z-score) levels for all measured TCA cycle metabolites. The dendrogram indicates the degree of correlation between each of the metabolites across all four groups. b Relative citrate levels measured from the prefrontal cortex. c Relative citrate to malate ratio. d A highlight of the TCA metabolites that were found to be statistically different between genotypes (top) or chronic stress condition (bottom). Data were normalized to total TCA concentration and show average ± SEM, with each black dot representing the result of an individual animal. Asterisk (*) indicates p < 0.05.

Similar articles

Cited by

References

    1. Joëls M, Baram TZ. The neuro-symphony of stress. Nat. Rev. Neurosci. 2009;10:459. - PMC - PubMed
    1. Morava E, Kozicz T. Mitochondria and the economy of stress (mal)adaptation. Neurosci. Biobehav. Rev. 2013;37:668–680. - PubMed
    1. Picard M, et al. Mitochondrial functions modulate neuroendocrine, metabolic, inflammatory, and transcriptional responses to acute psychological stress. Proc. Natl Acad. Sci. USA. 2015;112:E6614–E6623. - PMC - PubMed
    1. Picard M, McEwen BS. Psychological stress and mitochondria: a systematic review. Psychosom. Med. 2018;80:141–153. - PMC - PubMed
    1. Rezin GT, et al. Inhibition of mitochondrial respiratory chain in brain of rats subjected to an experimental model of depression. Neurochem. Int. 2008;53:395–400. - PubMed

Publication types

Substances

LinkOut - more resources