. 2020 Jun 2;11(1):2763.
doi: 10.1038/s41467-020-16593-y.

Malaria parasites regulate intra-erythrocytic development duration via serpentine receptor 10 to coordinate with host rhythms

Affiliations

Malaria parasites regulate intra-erythrocytic development duration via serpentine receptor 10 to coordinate with host rhythms

Amit K Subudhi et al. Nat Commun. .

Abstract

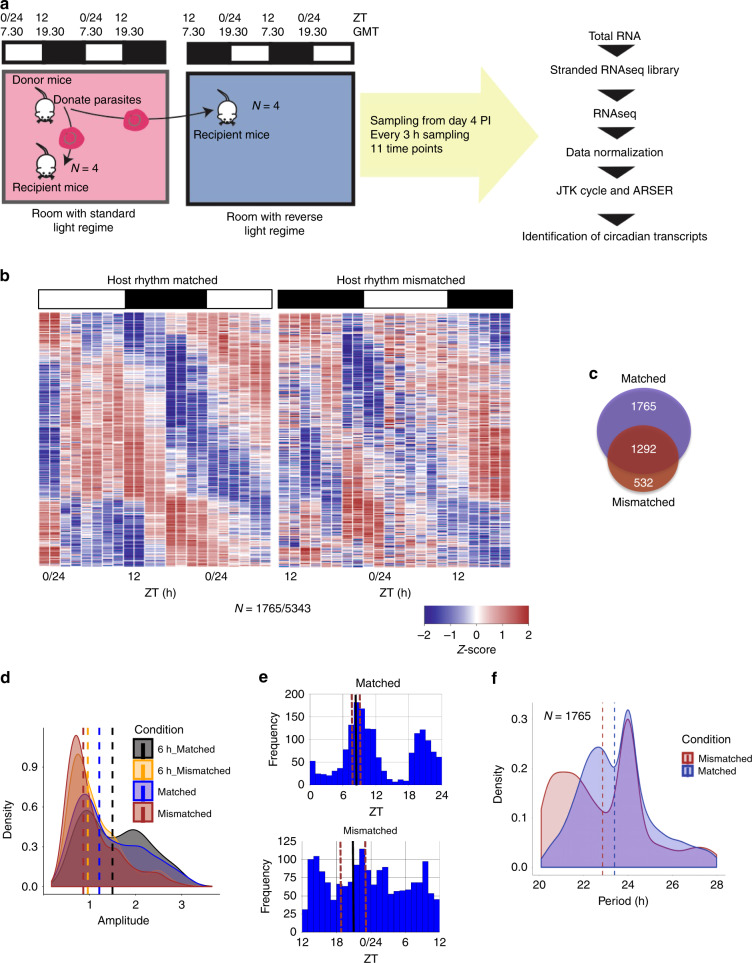
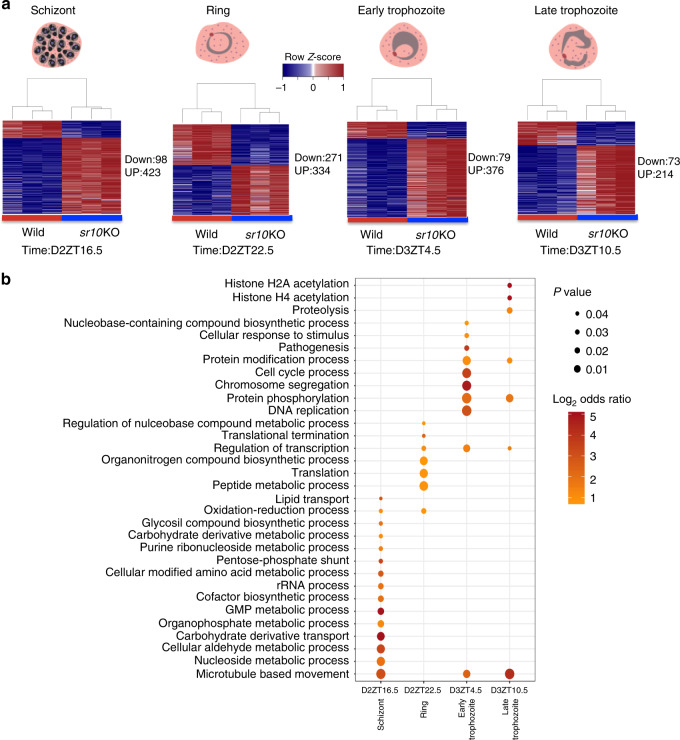
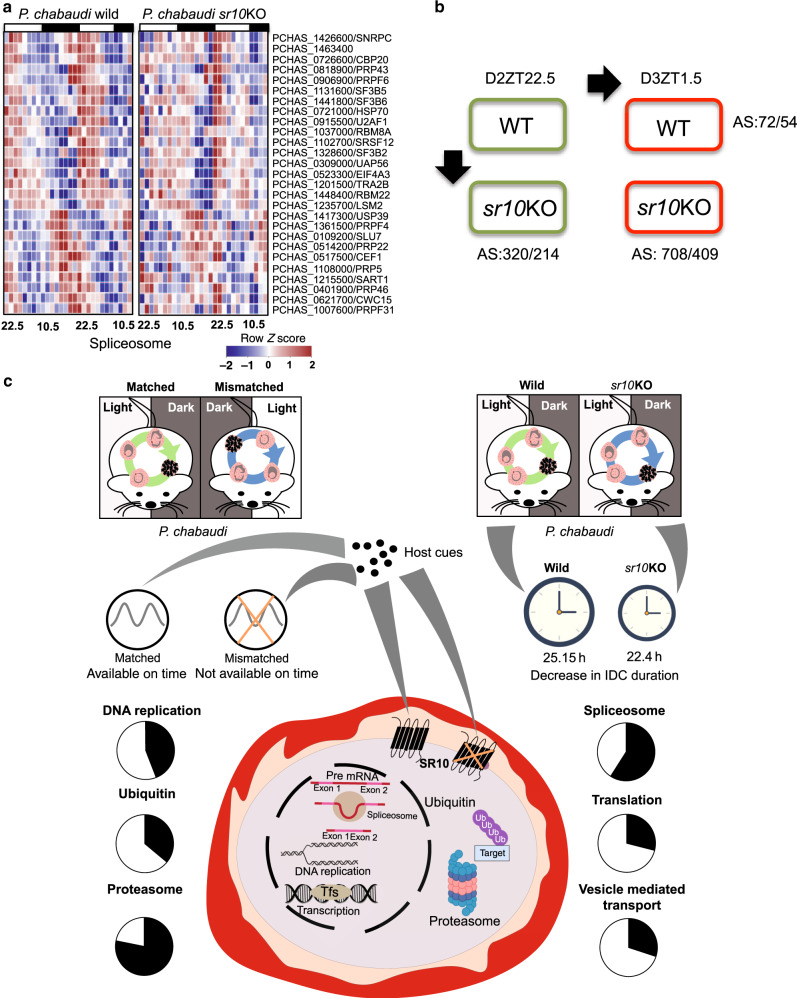
Malaria parasites complete their intra-erythrocytic developmental cycle (IDC) in multiples of 24 h suggesting a circadian basis, but the mechanism controlling this periodicity is unknown. Combining in vivo and in vitro approaches utilizing rodent and human malaria parasites, we reveal that: (i) 57% of Plasmodium chabaudi genes exhibit daily rhythms in transcription; (ii) 58% of these genes lose transcriptional rhythmicity when the IDC is out-of-synchrony with host rhythms; (iii) 6% of Plasmodium falciparum genes show 24 h rhythms in expression under free-running conditions; (iv) Serpentine receptor 10 (SR10) has a 24 h transcriptional rhythm and disrupting it in rodent malaria parasites shortens the IDC by 2-3 h; (v) Multiple processes including DNA replication, and the ubiquitin and proteasome pathways, are affected by loss of coordination with host rhythms and by disruption of SR10. Our results reveal malaria parasites are at least partly responsible for scheduling the IDC and coordinating their development with host daily rhythms.


Conflict of interest statement

The authors declare no competing interests.

Figures

Fig. 1
Fig. 1. P. chabaudi gene expression is sensitive to the phase of host circadian rhythms.
a Ring stage parasites from donor mice were used to infect recipient mice housed in two rooms that differed by 12 h in their light:dark cycle. Blood samples were collected for RNAseq analysis from day 4 post-infection every 3 h for 11 time points (N = 4 mice per group per time point). ZT is Zeitgeber time:hours after lights on. b Time series gene expression heatmap illustrates daily rhythmicity in matched parasites (left) that lost strong rhythmicity in mismatched parasites (right). Transcripts ordered in the same sequence based on their phase of expression. Each row represents a single gene, sorted according to the phase of maximum expression starting from first sample time point. The phase of expression of each gene was obtained from ARSER and N represents number of genes with 24 h rhythmicity in expression. Each time point is represented by expression heatmap of two biological replicates. Colors represent the row Z-score. c Venn diagram of the number of daily rhythmic genes in matched (top) and mismatched (bottom) parasites. d Transcripts with daily rhythmicity in both matched and mismatched parasites had lower median amplitude (0.86, brown dashed line) in mismatched parasites compared to matched parasites (1.22, blue dashed line). This was also the case for transcripts that had ~6 h delayed phase of expression in mismatched compared to matched parasites. e Histogram of the phase distributions of 1765 genes that displayed daily rhythmicity only in matched parasites. Solid black line indicates the mean circular phase, brown line represents the standard deviation of the mean of phases. Whilst these genes are not identified as having daily rhythms in mismatched parasites, their distribution is shown for comparison. f Transcripts that displayed daily rhythmicity only in matched parasites have median period close to 24 h (blue dashed line) and (for comparison) 23 h in mismatched parasites (brown dotted line). Source data are provided as Source Data file.
Fig. 2
Fig. 2. Biological pathways affected by mismatch to the phase of host rhythms.
a Time series gene expression view of genes that displayed with 24 h rhythmicity in matched parasites but lost rhythmicity in mismatched parasites. Genes were sorted based on phase of maximum expression and segregated into 12 groups with each group representing 2 h phase clusters. Line plots along the sides of the heat map represent expression profiles of individual genes significantly enriched to gene ontology terms (FDR corrected p < 0.05, hypergeometric test, one-sided) representing few crucial biological processes. The Y axis represents relative expression of genes at each time point determined by count level expression of each gene normalized by its mean across 11 time points. b Heatmaps illustrating the expression patterns of 24 h rhythmic genes for matched and mismatched parasites that are involved in the ubiquitin and proteasome systems, and the DNA replication and glycolysis pathways. These genes lost rhythmicity in mismatched parasites. Genes have been sorted based on the phase of maximum expression. The color scheme represents the row Z-score. Each time point is represented by the expression heatmap of two biological replicates.
Fig. 3
Fig. 3. Serpentine receptor 10 maintains the duration of the intra-erythrocytic developmental cycle.
a Time series RNAseq gene expression heatmap view of 24 h rhythmic genes identified in P. falciparum in vitro in “free running” (constant temperature and darkness) conditions. Genes sorted based on the phase of maximum expression starting from time T:0 that corresponds to 3 h post merozoite invasion. b Manually curated gene ontology terms enriched for P. falciparum genes with 24 h expression (FDR corrected p < 0.05, hypergeometric test, one-sided). c Line graphs represent the expression of serpentine receptor 10 in P. falciparum over its 48 h IDC (top plot) and in P. chabaudi during its 24 h IDC (bottom plot). Dotted lines show the best-fit sinusoidal curves. d P. chabaudi wild type and sr10KO parasites were used to initiate infections in CBS mice. Blood was collected from day 1 (ZT 13.5) every 3 h during the following 48 h. Expression data from two biological replicates over 14 time points (from day 2 PI, ZT 22.5) were analyzed to identify putative “circadian” transcripts. PVM parasitophorous vacuole membrane, PPM parasite plasma membrane, RBC red blood cell. e Proportion of parasites in the blood at early trophozoite stage in P. chabaudi wild type (WT) and sr10KO clones (Mean ± SEM, N = 4/clone). f IDC duration of P. chabaudi wild type (WT) and sr10KO clones (Mean ± SEM, N = 4/clone). g Proportion of parasites in the blood at early trophozoite stage in P. yoelii wild type (WT) and sr10KO clones (Mean ± SEM, N = 4/clone). h IDC duration of P. yoelii wild type (WT) and sr10KO clones (Mean ± SEM, N = 4/clone). Source data are provided as Source Data file.
Fig. 4
Fig. 4. Disruption of sr10 affects daily rhythms in P. chabaudi gene expression.
a Time series gene expression heatmap view of genes expressed with daily rhythmicity in P. chabaudi wild type that lost rhythmicity in sr10KO parasites. Right most heatmap shows the expression pattern of transcripts that lost rhythmicity in sr10KO parasites. Each row represents a single gene, sorted according to phase of maximum expression starting from first time point of sample collection. N represents number of genes with 24 h rhythmicity identified. Each time point is represented by an expression heatmap of two biological replicates. b Venn diagram of number of genes with 24 h rhythmic expression identified by both JTK and ARSER in wild type and sr10KO parasites. c Phase distributions of genes with 24 h expression in wild type that lost 24 h rhythmicity in sr10KO parasites. The mean circular phase for each condition is indicated by a solid black line. N represents the number of cycling transcripts. Pink lines represent standard deviation of the mean circular phases. d Transcripts that displayed with 24 h (putative “circadian”) rhythmicity only in wild type parasites have median periods close to 26 h in wild-type parasites (blue dashed line) and 24 h in sr10KO parasites (brown dashed line). e Genes that were rhythmic in both wild type and sr10KO parasites had a significantly lower mean amplitude in sr10KO parasites (1.15, brown dashed line) compared to wild type parasites (1.53, p < 0.00001). Source data are provided as Source Data file.
Fig. 5
Fig. 5. Knock out of sr10 affects multiple biological processes.
a Differentially regulated genes were identified by comparing four matching time points of sr10KO and wild type Plasmodium chabaudi parasites. Up and down represent differentially regulated genes with the false discovery rate corrected p < 0.05 and Log2 fold change < −1 for downregulated genes and > 1 for upregulated genes at each time point. The four time points analyzed represent four IDC stages as derived from examination of parasite morphology in thin blood smears. b Gene ontology analysis of the differentially regulated genes within each time point. Manually curated functional annotations of biological processes (False discovery rate corrected p < 0.05, hypergeometric test, one-sided) are represented and the color spectrum represents the odds ratio.
Fig. 6
Fig. 6. Cross-talk between the intraerythrocytic developmental cycle and host rhythms.
a sr10 knockout affects parasite spliceosome machinery. Heatmap illustrating the expression pattern of sr10 knockout affected 24 h rhythmic genes involved in spliceosome pathway in P. chabaudi wild type and sr10KO parasites. The list of genes was obtained by mapping the SR10 linked rhythmic genes (SLRGs) to P. chabaudi spliceosome pathway represented in the KEGG database. Genes have been sorted based on phase of maximum expression. The color scheme represents the row Z-score. b sr10 knockout affects alternative splicing signature of the transcriptome. sr10 knock out affects the alternative splicing signature of the parasite transcriptome. Two consecutive time points were compared between wild type and sr10KO parasites to identify differential usage of exons. As a control two consecutive time points (Day 2 ZT 22.5 and Day 3 ZT 1.5) from the same parasite strain were also compared. The number shown depicts the number of differential exon usage events detected (p < 0.05). Two biological replicates per time point were used. Differential exon usage events were identified using DEXSeq. c Schematic figure summarizing the cross-talk between the IDC schedule of P. chabaudi and host rhythms. The parasite can reschedule its IDC when its developmental rhythms are mismatched with the host rhythms. The parasite responds to mismatch by losing rhythmic expression of genes associated with multiple biological processes as depicted in the pie-charts on the left. P. chabaudi serpentine receptor 10 (sr10) is expressed rhythmically during the IDC, and knocking out sr10 in P. chabaudi reduces the IDC duration by ~2–3 h and also affects the rhythmic expression of genes associated with multiple biological processes as depicted in the pie charts on the right. We speculate that SR10 may serve as one of the receptors through which the parasite receives rhythmic cues from the host that influence the IDC schedule, permitting rescheduling to recover from mismatch. Black section within the pie-charts represent the percentage of rhythmic genes in each biological process that fell under the threshold for rhythmic expression in mismatched and sr10KO parasites.

References

    1. Reece SE, Prior KF, Mideo N. The life and times of parasites: rhythms in strategies for within-host survival and between-host transmission. J. Biol. Rhythms. 2017;32:516–533. - PMC - PubMed
    1. Westwood ML, et al. The evolutionary ecology of circadian rhythms in infection. Nat. Ecol. Evol. 2019;3:552–560. - PMC - PubMed
    1. Rijo-Ferreira F, Pinto-Neves D, Barbosa-Morais NL, Takahashi JS, Figueiredo LM. Trypanosoma brucei metabolism is under circadian control. Nat. Microbiol. 2017;2:17032. - PMC - PubMed
    1. Hirako IC, et al. Daily rhythms of TNFalpha expression and food intake regulate synchrony of Plasmodium stages with the host circadian cycle. Cell Host Microbe. 2018;23:796–808. - PMC - PubMed
    1. Prior KF, et al. Timing of host feeding drives rhythms in parasite replication. PLoS Pathog. 2018;14:e1006900. - PMC - PubMed

Publication types

MeSH terms

Substances