. 2020 Jun 2;11(1):2776.
doi: 10.1038/s41467-020-16604-y.

Stable isotopes show that earthquakes enhance permeability and release water from mountains

Affiliations

Stable isotopes show that earthquakes enhance permeability and release water from mountains

Takahiro Hosono et al. Nat Commun. .

Abstract

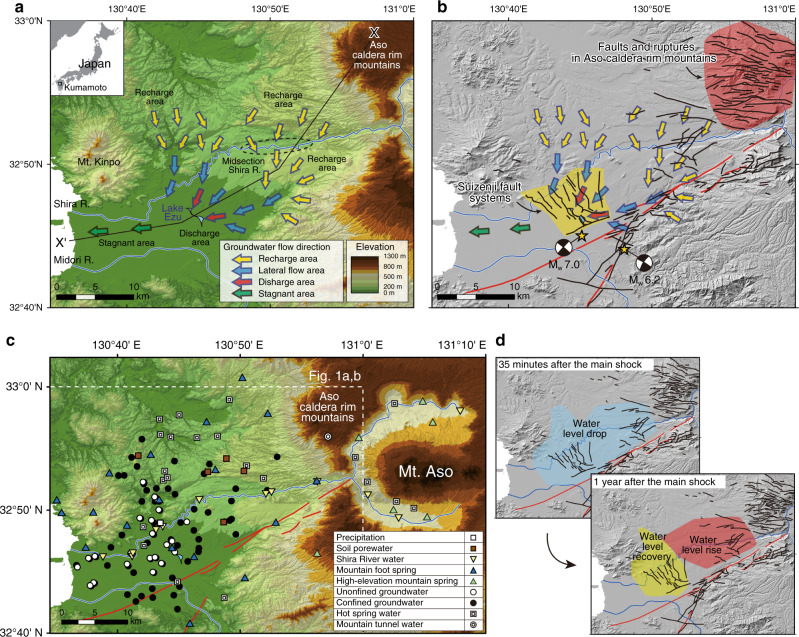
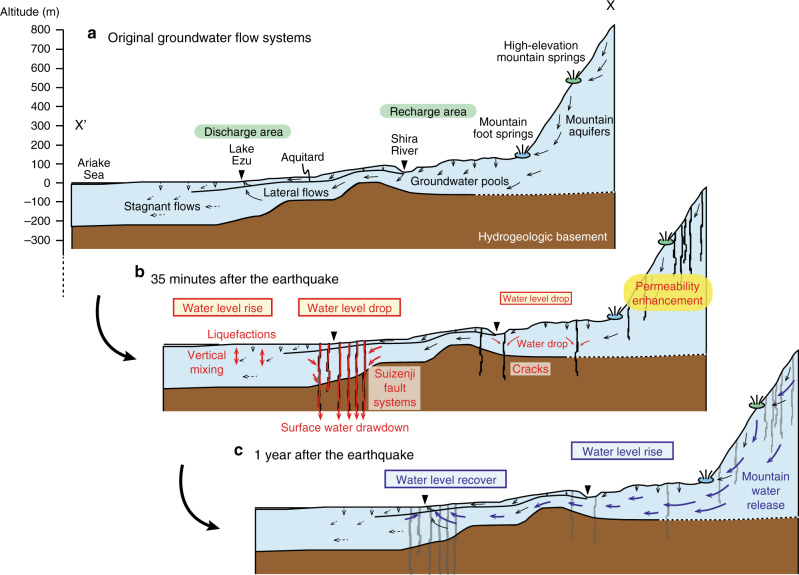
Hydrogeological properties can change in response to large crustal earthquakes. In particular, permeability can increase leading to coseismic changes in groundwater level and flow. These processes, however, have not been well-characterized at regional scales because of the lack of datasets to describe water provenances before and after earthquakes. Here we use a large data set of water stable isotope ratios (n = 1150) to show that newly formed rupture systems crosscut surrounding mountain aquifers, leading to water release that causes groundwater levels to rise (~11 m) in down-gradient aquifers after the 2016 Mw 7.0 Kumamoto earthquake. Neither vertical infiltration of soil water nor the upwelling of deep fluids was the major cause of the observed water level rise. As the Kumamoto setting is representative of volcanic aquifer systems at convergent margins where seismotectonic activity is common, our observations and proposed model should apply more broadly.


Conflict of interest statement

The authors declare no competing interests.

Figures

Fig. 1
Fig. 1. Hydrogeology and seismotectonics of Kumamoto.
a Map showing original hydrological systems in the study area before the 2016 Kumamoto earthquake. Flow directions in each area of the confined aquifer are shown with arrows of different colors. b Seismotectonic structures crosscutting regional groundwater flow systems after the 2016 Kumamoto earthquake. Distributions of the foreshock and main shock epicenters (stars) with their mechanisms (beach ball plots), pre-existing fault systems (red lines), and locations of newly recognized ruptures (black lines) are from refs. , . c Sampling locations for various waters used for isotopic comparisons. d Cartoon showing the areas where groundwater level changed 35 min and 1 year after the main shock (see Supplementary Fig. 2 for detailed water level change distributions). Hydrogeological cross-section X–X′ is shown in Fig. 4.
Fig. 2
Fig. 2. Isotopic compositions of waters before the earthquake.
Oxygen and hydrogen stable isotope ratios characterizing the original hydrological systems in Kumamoto. Samples from different seasons are included. Two local meteoric water lines including high-water (during April to September, n = 70) and low-water (during October to March, n = 65) seasons are shown in the figures using monthly precipitation data (see Methods). The global meteoric water line and isotopic evolution trends due to altitude effects and evaporation are from refs. . Error bars in the figure represent analytical precision.
Fig. 3
Fig. 3. Coseismic changes in stable isotope ratios.
a Oxygen and hydrogen stable isotope ratios showing compositional changes before (April 2011 to July 2011) and after (August 2016 to May 2017) the main shock for river and spring waters for the samples from various seasons. Compositions of hot spring waters and mountain aquifer water from ongoing tunnel construction for the samples collected after the main shock are also plotted. Springs (blue and green triangles) and river (yellow triangle) water samples obtained after the earthquake are shown in darker colors than samples from before the earthquake. b Compositional changes before (November 2009 to November 2011) and after (June 2016 to December 2017) the main shock for confined groundwaters for the samples from various seasons. c, d Compositional changes of groundwaters for recharge and lateral flow to discharge areas, respectively. Samples from all seasons for both aquifers (unconfined and confined aquifers) are plotted. The two local meteoric water lines are the same as in Fig. 2. In b–d, groundwater samples after the earthquake are shown in red, while those before the earthquake are shown in white. Errors are shown in Fig. 3b.
Fig. 4
Fig. 4. Cartoons showing coseismic hydrogeological changes.
a Schematic cross-section X–X′ (see Fig. 1a for its location) showing original hydrogeological systems in the study area. b, c Cross-sections showing coseismic hydrogeological changes 35 min and 1 year after the main shock of the 2016 Kumamoto earthquake, respectively. Coseismic groundwater drawdown mechanisms are after ref. .

References

    1. Montgomery DR, Manga M. Streamflow and water well responses to earthquakes. Science. 2003;300:2047–2049. - PubMed
    1. Wang, C. -Y. & Manga, M. Earthquakes and Water (Springer, 2009).
    1. Jónsson S, Segall P, Pedersen R, Björnsson G. Post-earthquake ground movements correlated to pore-pressure transients. Nature. 2003;424:179–183. - PubMed
    1. Wakita H. Water wells as possible indicators of tectonic strain. Science. 1975;189:553–555. - PubMed
    1. Tsunogai U, Wakita H. Precursory chemical changes in ground water: Kobe earthquake, Japan. Science. 1995;269:61–63. - PubMed

Publication types