. 2020 Jun 2;11(1):2741.
doi: 10.1038/s41467-020-16545-6.

The impact of climate and antigenic evolution on seasonal influenza virus epidemics in Australia

Affiliations

The impact of climate and antigenic evolution on seasonal influenza virus epidemics in Australia

Edward K S Lam et al. Nat Commun. .

Abstract

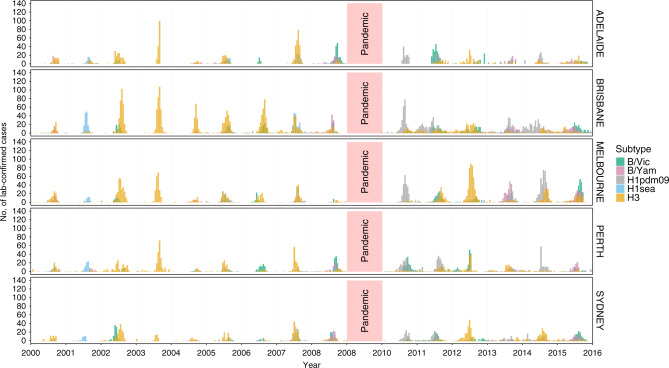
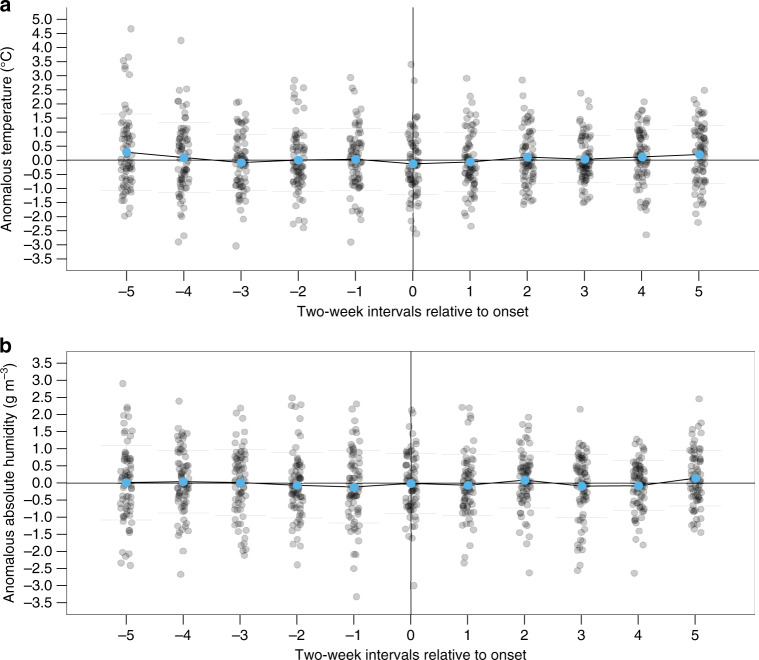
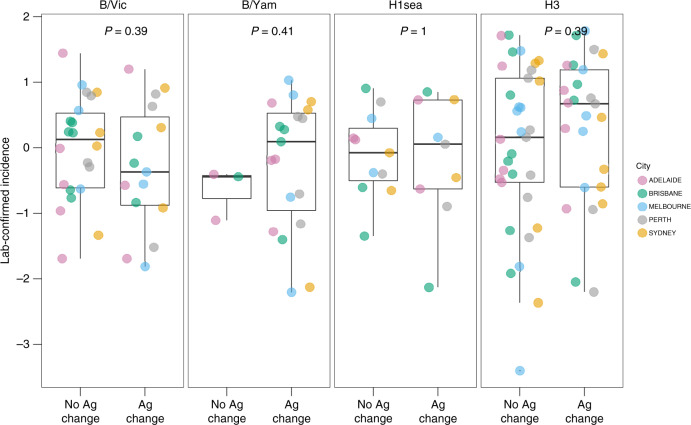
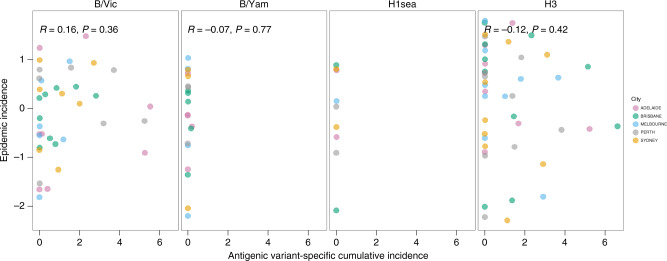
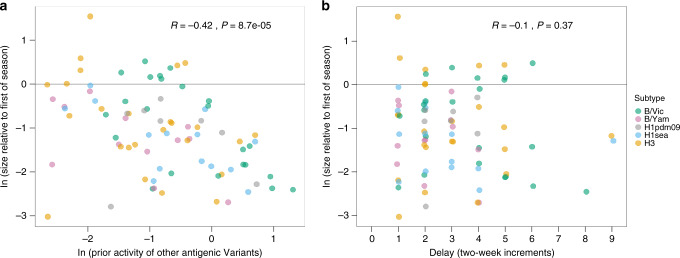
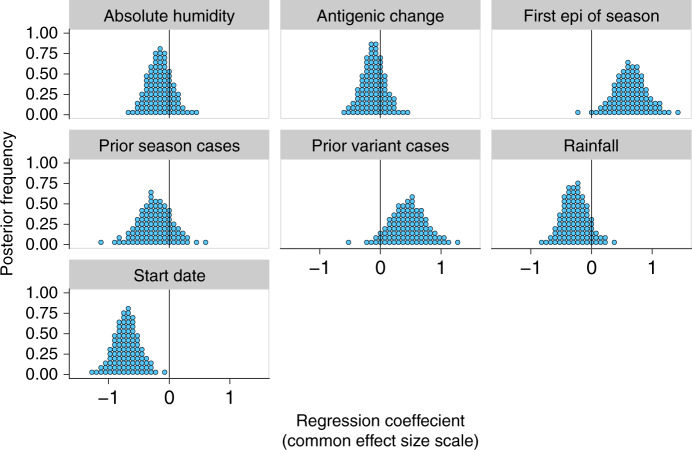
Although seasonal influenza viruses circulate globally, prevention and treatment occur at the level of regions, cities, and communities. At these scales, the timing, duration and magnitude of epidemics vary substantially, but the underlying causes of this variation are poorly understood. Here, based on analyses of a 15-year city-level dataset of 18,250 laboratory-confirmed and antigenically-characterised influenza virus infections from Australia, we investigate the effects of previously hypothesised environmental and virological drivers of influenza epidemics. We find that anomalous fluctuations in temperature and humidity do not predict local epidemic onset timings. We also find that virus antigenic change has no consistent effect on epidemic size. In contrast, epidemic onset time and heterosubtypic competition have substantial effects on epidemic size and composition. Our findings suggest that the relationship between influenza population immunity and epidemiology is more complex than previously supposed and that the strong influence of short-term processes may hinder long-term epidemiological forecasts.


Conflict of interest statement

The authors declare no competing interests.

Figures

Fig. 1
Fig. 1. Number of laboratory-confirmed seasonal influenza virus infections from 2000 to 2015 for the five largest cities in Australia.
Cases are aggregated by 2-week periods, stratified by city and coloured by subtype/lineage.
Fig. 2
Fig. 2. Climatic conditions around epidemic onset.
a Anomalous temperature T′ and b absolute humidity AH′ prior to and after epidemic onset across all five cities. Epidemic onset is marked by the vertical line at 0. For the earliest-onset epidemic in each season and city (15 years × 5 cities = 75 epidemics), T′ and AH′ for each time point are represented by grey points: a point below the horizontal line denotes that the value is lower than the 31-year city-specific mean. Blue points show the mean T′ and AH′ for that 2-week period for all epidemics across all cities within the study period. There were no periods with statistically significant reductions (P < 0.05; Non-parametric bootstrapping) in T′ or AH′ from the 31-year averages.
Fig. 3
Fig. 3. Effect of antigenic change on epidemic incidence.
Epidemic incidence was compared between seasons associated with and without the epidemic-level circulation of a new major antigenic variant. Within each subtype, the incidence for individual epidemics was log-transformed and subtracted by the city-specific mean of log incidence, to allow for comparison between cities. P values are from Wilcoxon two-sample tests (n = 37, 26, 22 and 63 for B/Vic, B/Yam, A/H1sea and A/H3, respectively). Each point corresponds to one epidemic in a city, and the box plots show the median, first and third quartile of the transformed values, and range.
Fig. 4
Fig. 4. Effect of prior immunity on epidemic incidence.
Within each subtype, the incidence for individual epidemics was log-transformed and subtracted by the city-specific mean of log incidence, to allow for comparison between cities. Antigenic variant-specific cumulative incidence was measured relative to the city-specific mean epidemic size, where 1 is equivalent to the mean epidemic incidence. r- and P values are from Pearson’s correlation tests (n = 37, 20, 9 and 45 for B/Vic, B/Yam, A/H1sea and A/H3, respectively). Antigenic variants of B/Yam rarely initiated multiple epidemics during the study period, and it was not possible to calculate a correlation coefficient for A/H1sea because the one new antigenic variant to emerge during the study period caused only a single epidemic per city.
Fig. 5
Fig. 5. Effect of competition among subtypes on epidemic incidence.
The relationship between the size of an epidemic and a the amount of prior activity of all other antigenic variants and subtypes, and b the delay in epidemic onset. The size of each epidemic, relative to the earliest epidemic of that season, was log-transformed: the horizontal line at 0 denotes that the size of an epidemic is equal to that of the earliest epidemic of that season and city. In panel (a), prior activity by other subtypes within the same season was measured relative to the city-specific mean epidemic size. In panel b, delay in epidemic onset was measured relative to the onset timing of the earliest epidemic of that season. r- and P values are from Pearson’s correlation tests (n = 82).
Fig. 6
Fig. 6. Joint contributions of climatic and virological factors on epidemic incidence.
The mean effects across all subtypes were estimated using the Bayesian multilevel model. Predictors were mean-centred and scaled, so effect sizes are shown on a common scale.

References

    1. World Health Organization. Influenza (Seasonal) Fact sheet. https://www.who.int/news-room/fact-sheets/detail/influenza-(seasonal) (2018).
    1. Denoeud L, et al. Predicting pneumonia and influenza mortality from morbidity data. PLoS ONE. 2007;2:3–6. - PMC - PubMed
    1. Finkelman BS, et al. Global patterns in seasonal activity of influenza A/H3N2, A/H1N1, and B from 1997 to 2005: Viral coexistence and latitudinal gradients. PLoS One. 2007;2:e1296. - PMC - PubMed
    1. Gandon S, Day T, Metcalf CJE, Grenfell BT. Forecasting epidemiological and evolutionary dynamics of infectious diseases. Trends Ecol. Evol. 2016;31:776–788. - PubMed
    1. Public Health England. Flu plan winter 2016/17. Public Heal. Engl. 10.1037/e500942012-001 (2016).

Publication types

Substances