

Hierarchical biota-level and taxonomic controls on the chemistry of fossil melanosomes revealed using synchrotron X-ray fluorescence
- PMID: 32488139
- PMCID: PMC7265528
- DOI: 10.1038/s41598-020-65868-3
Hierarchical biota-level and taxonomic controls on the chemistry of fossil melanosomes revealed using synchrotron X-ray fluorescence
Abstract
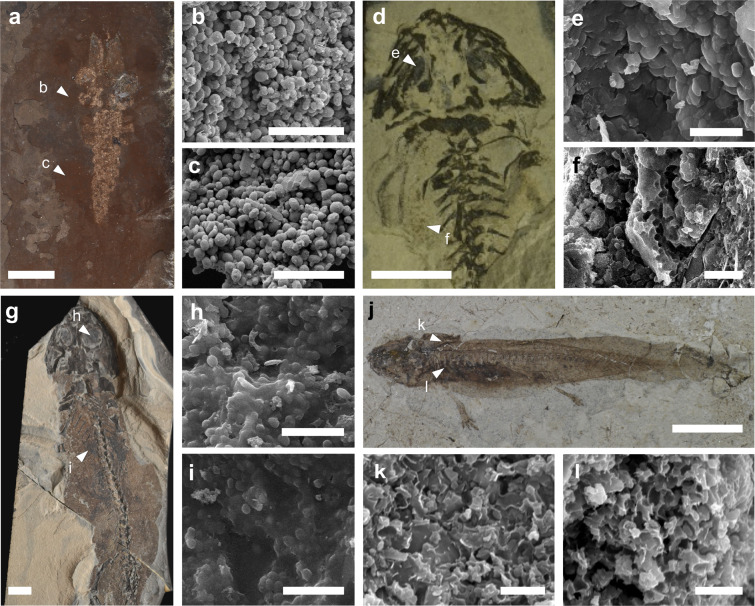
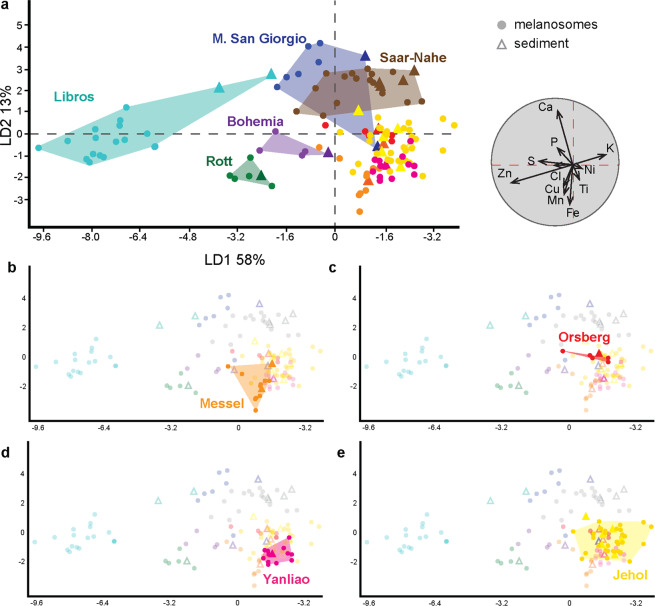
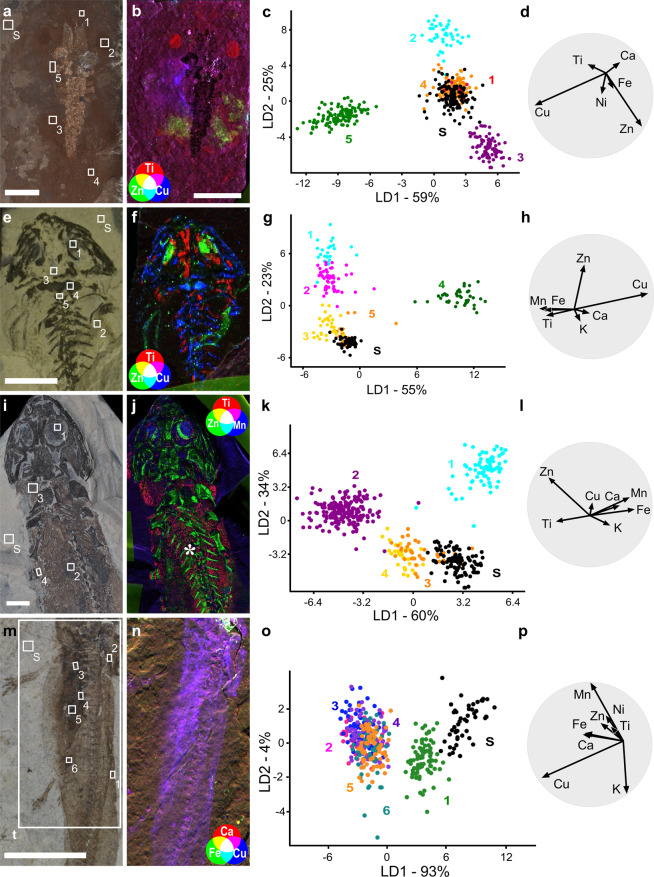
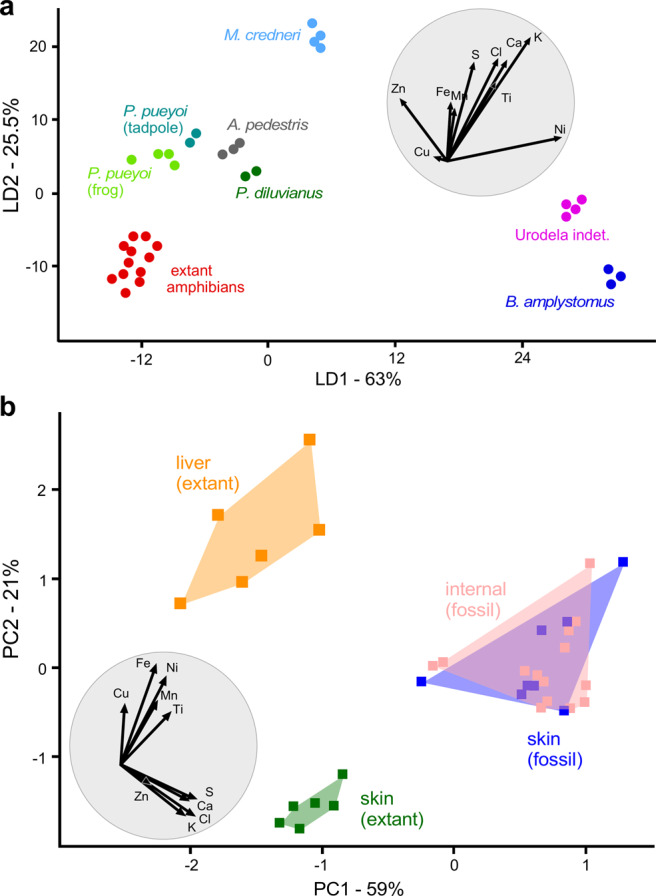
Fossil melanosomes, micron-sized granules rich in melanin in vivo, provide key information for investigations of the original coloration, taxonomy and internal anatomy of fossil vertebrates. Such studies rely, in part, on analysis of the inorganic chemistry of preserved melanosomes and an understanding of melanosome chemical taphonomy. The extent to which the preserved chemistry of fossil melanosomes is biased by biotic and abiotic factors is, however, unknown. Here we report the discovery of hierarchical controls on the inorganic chemistry of melanosomes from fossil vertebrates from nine biotas. The chemical data are dominated by a strong biota-level signal, indicating that the primary taphonomic control is the diagenetic history of the host sediment. This extrinsic control is superimposed by a biological, tissue-level control; tissue-specific chemical variation is most likely to survive in fossils where the inorganic chemistry of preserved melanosomes is distinct from that of the host sediment. Comparative analysis of our data for fossil and modern amphibians reveals that most fossil specimens show tissue-specific melanosome chemistries that differ from those of extant analogues, strongly suggesting alteration of original melanosome chemistry. Collectively, these findings form a predictive tool for the identification of fossil deposits with well-preserved melanosomes amenable to studies of fossil colour and anatomy.
Conflict of interest statement
The authors declare no competing interests.
Figures
References
-
- D’Alba L, Shawkey MD. Melanosomes: biogenesis, properties, and evolution of an ancient organelle. Physiol. Rev. 2018;99:1–19. - PubMed
-
- Morgan, E. D. Biosynthesis in Insects (Royal Society of Chemistry, Cambridge, UK, 2010, pp 199).
-
- Borovansky, J. & Riley, P. A. Melanins and Melanosomes: biosynthesis, structure, physiological and pathological functions (John Wiley & Sons, 2011).
-
- Solano F. Photoprotection versus photodamage: updating an old but still unsolved controversy about melanin. Polym. Int. 2016;65:1276–1287.
-
- Galván I, Solano F. Melanin chemistry and the ecology of stress. Physiol. Biochem. Zool. 2015;88:352–355. - PubMed
Publication types
MeSH terms
LinkOut - more resources
Full Text Sources
