. 2020 Jun 2;10(1):8934.
doi: 10.1038/s41598-020-65721-7.

Parthenium hysterophorus steps up Ca-regulatory pathway in defence against highlight intensities

Affiliations

Parthenium hysterophorus steps up Ca-regulatory pathway in defence against highlight intensities

Javed Ahmad et al. Sci Rep. .

Abstract

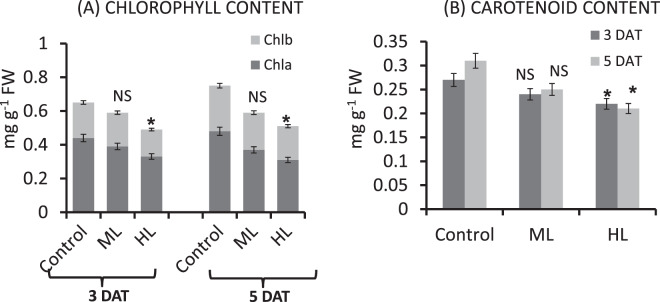
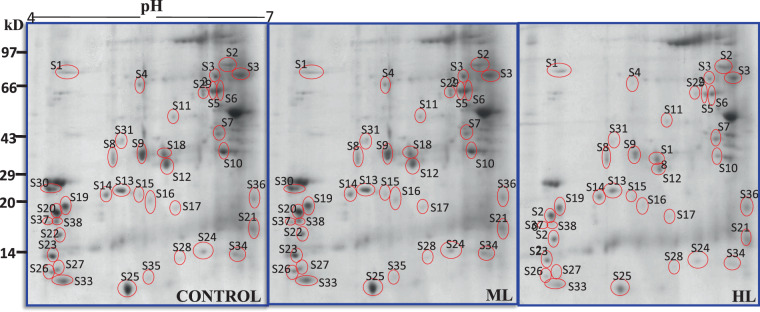
Parthenium hysterophorus exhibits tolerance to a great extent against abiotic stresses including high light intensities. In this study, P. hysterophorus was subjected to three different light intensities viz. control (CL, 250 µmol photons m-2 s-1), moderately high (ML, 500 µmol photons m-2 s-1) and high (HL, 1000 µmol photons m-2 s-1) for assessment of biochemical and physiological responses at 3 and 5 days after treatment (DAT). Proteomic responses were also observed at 5 DAT. Level of oxidative stress marker, abundance of H2O2 and O2- was highest in leaves exposed to HL followed by ML treatment. Biomass accumulation, photosynthetic parameters, chloroplast and mitochondrial integrity were also affected by both ML and HL treatments. Differential protein expression data showed modulation of thirty-eight proteins in ML and HL intensities. P. hysterophorus exhibited good ability to survive in ML then HL treatment as demonstrated by enhancement of the antioxidant system and photosynthesis. Furthermore, P. hysterophorus mobilized some key proteins related to calcium signaling, which in turn coordinate physiological homeostasis under stress. Proline and total soluble sugar content were high under stress; however, results of simulated experiment of our study indicate such accumulation of osmolytes may inhibit photon-availability to chloroplast. These results clarify our understanding of the mechanisms underlying the light stress tolerance of P. hysterophorus.


Conflict of interest statement

The authors declare no competing interests.

Figures

Figure 1
Figure 1
Effect of control (Control, 250 µmol photons m−2 s−1), moderate (ML, 500 µmol photons m−2 s−1) and high (HL, 1000 µmol photons m−2 s−1) light intensities on content of thiobarbituric acid substances (TBARS) showing the magnitude of oxidative damage in leaf of Parthenium hysterophorus at 3 DAT and 5 DAT. Values are mean ± SD and n = 5.
Figure 2
Figure 2
(AF) In situ histochemical detection of hydrogen peroxide formed in Parthenium hysterophorus leaves under the effect of control (Control, 250 µmol photons m−2 s−1), moderate (500 µmol photons m−2 s−1) and high (1000 µmol photons m−2 s−1) light intensities at A. 3 DAT and B. 5 DAT. Quantification was performed for per cent H2O2 spots formed against total leaf area.
Figure 3
Figure 3
(A–F) In situ histochemical detection of superoxide radicals formed in Parthenium hysterophorus leaves under the effect of control (Control, 250 µmol photons m−2 s−1), moderate (500 µmol photons m−2 s−1) and high (1000 µmol photons m−2 s−1) light intensities at A. 3 DAT and B. 5 DAT. Quantification was performed for per cent superoxide radical (O2) spots formed against total leaf area.
Figure 4
Figure 4
(A,B) Effect of moderate (500 µmol photons m−2 s−1) and high (1000 µmol photons m−2 s−1) light intensities on content of proline (A) and total soluble sugar (B) in leaf of Parthenium hysterophorus at 3 DAT and 5 DAT. Values are mean ± SE and n = 5.
Figure 5
Figure 5
(A,B) Effect of moderate (500 µmol photons m−2 s−1) and high (1000 µmol photons m−2 s−1) light intensities on content of calcium (A) and total antioxidant capacity (B) in leaf of Parthenium hysterophorus at 3 DAT and 5 DAT. Values are mean ± SE and n = 5.
Figure 6
Figure 6
(A–D) Effect of moderate (500 µmol photons m−2 s−1) and high (1000 µmol photons m−2 s−1) light intensities on (A). rate of photosynthesis (Pn)), (B) rate of transpiration (Tn) and (C) rate of stomatal movement (Gs) in leaf of Parthenium hysterophorus at 3 DAT and 5 DAT. Values are mean ± SE and n = 5.
Figure 7
Figure 7
(A,B) Effect of moderate (500 µmol photons m−2 s−1) and high (1000 µmol photons m−2 s−1) light intensities on contents of Chl a, Chl b and total (a + b) chlorophyll and content of carotenoid in leaf of Parthenium hysterophorus at 3 DAT and 5 DAT. Values are mean ± SE and n = 5.
Figure 8
Figure 8
(A,B) Effect of moderate (500 µmol photons m−2 s−1) and high (1000 µmol photons m−2 s−1) light intensities on plant fresh weight (A) and dry weight (B) of Parthenium hysterophorus at 3 DAT and 5 DAT. Values are mean ± SE and n = 5.
Figure 9
Figure 9
(AF) Changes induced in ultrastructure of chloroplast by moderate (500 µmol photons m−2 s−1) and high (1000 µmol photons m−2 s−1) light intensities at 3 DAT and 5 DAT. A = Control (0 DAT), B = ML (3 DAT), C = HL (3 DAT), D = Control (0 DAT), E = ML (5 DAT), F = HL (5 DAT). 3 DAT and 5 DAT = 3 or 5 days after treatment.
Figure 10
Figure 10
(AF) Changes induced in ultrastructure of mitochondria by moderate (500 µmol photons m−2 s−1) and high (1000 µmol photons m−2 s−1) light intensities at 3 DAT and 5 DAT. A = Control (0 DAT), B = ML (3 DAT), C = HL (3 DAT), D = Control (0 DAT), E = ML (5 DAT), F = HL (5 DAT). 3 DAT and 5 DAT = 3 or 5 days after treatment.
Figure 11
Figure 11
2-DE gel images representing proteins of interest selected for tryptic digestion based on differential expression in control versus moderate (500 µmol photons m−2 s−1) and high (1000 µmol photons m−2 s−1) light intensities exposed Parthenium hysterophorus at five days after treatments (5 DAT).
Figure 12
Figure 12
(AC) Multivariate analysis of obtained data using MetaboAnalyst software. (A) Hierarchical clustering based on percentage volumes of the differentially modulated spots was performed. (B) Loadings plot displays a distinct partition of protein spots between control and stressed leaves. (C) PCA biplot shows the component scores and variable loadings obtained by PCA in two dimensions.
Figure 13
Figure 13
Communication network analysis of the identified proteins using STRING software. Different colored lines depict different types of evidences for the association of the proteins. The circled nodes are the important networks under ML and HL stress.
Figure 14
Figure 14
An outline of metabolic pathways of P. hysterophorus modulated under ML and HL stress. Up-ward arrow indicates over-expressed proteins and downward arrow indicates under-expressed proteins in ML and HL stress. S denotes protein spot on 2D gels.
Figure 15
Figure 15
Impact of osmolytes accumulation on resistance (ohm) measured using a light-dependent resistor (LDR). The above model is proposed to exhibit the possible condition of the availability of photons in a cell/chloroplast with changing concentrations of osmolytes.

References

    1. Szymańska R, Ślesak I, Orzechowska A, Kruk J. Physiological and biochemical responses to high light and temperature stress in plants. Environ. Exp. Bot. 2017;139:165–177.
    1. Van Gelderen K, Kang C, Pierik R. Light signaling, root development, and plasticity. Plant Physiol. 2018;176(2):1049–1060. - PMC - PubMed
    1. Jokel M, Johnson X, Peltier G, Aro EM, Allahverdiyeva Y. Hunting the main player enabling Chlamydomonas reinhardtii growth under fluctuating light. Plant J. 2018;94(5):822–835. - PubMed
    1. Zandalinas SI, Sengupta S, Burks D, Azad RK, Mittler R. Identification and characterization of a core set of ROS wave‐associated transcripts involved in the systemic acquired acclimation response of Arabidopsis to excess light. Plant J. 2019;98:126–141. - PMC - PubMed
    1. Bayat, L. et al. Effects of growth under different light spectra on the subsequent high light tolerance in rose plants. AoB Plants. 10(5), ply205 (2018). - PMC - PubMed

Publication types

MeSH terms