. 2020 Jul;412(19):4647-4658.
doi: 10.1007/s00216-020-02718-1. Epub 2020 Jun 1.

FT-IR versus EC-QCL spectroscopy for biopharmaceutical quality assessment with focus on insulin-total protein assay and secondary structure analysis using attenuated total reflection

Affiliations

FT-IR versus EC-QCL spectroscopy for biopharmaceutical quality assessment with focus on insulin-total protein assay and secondary structure analysis using attenuated total reflection

Sven Delbeck et al. Anal Bioanal Chem. 2020 Jul.

Abstract

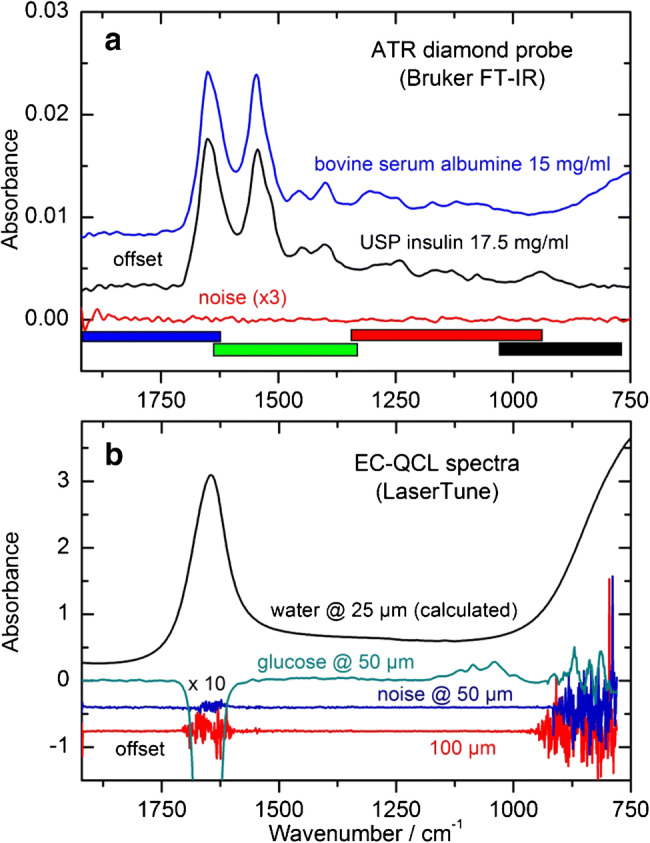
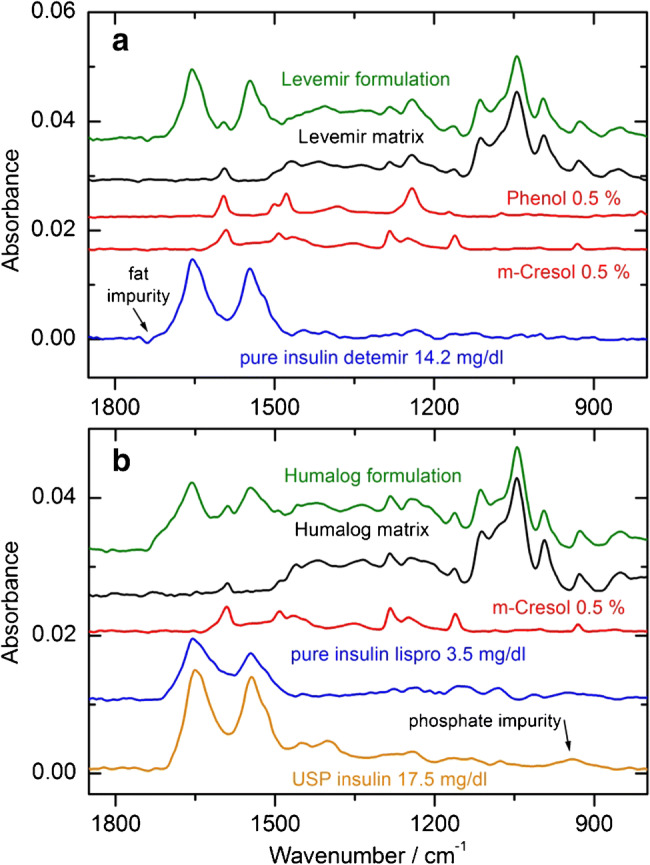
For the quality control of biopharmaceutical products, which contain proteins as the most important active ingredients, shelf life may be limited due to inappropriate storage conditions or mechanical stress. For insulins as representatives of life-saving pharmaceuticals, analytical methods are needed, which are providing additional information than obtained by assays for total protein quantification. Despite sophisticated formulations, the chemical stability may be challenged by temperatures deviating from recommended conditions or shear rate exposure under storage, leading to misfolding, nucleation, and subsequent fibril formation, accompanied by a decrease in bioactivity. A reliable method for insulin quantification and determination of secondary structure changes has been developed by attenuated total reflection (ATR) Fourier-transform infrared spectroscopy of insulin formulations by a silver halide fiber-coupled diamond probe with subsequent dry-film preparation. A special emphasis has been placed on the protein amide I band evaluation, for which spectral band analysis provides unique information on secondary structure fractions for intact and misfolded insulins. Quantitative measurements are possible down to concentrations of less than 0.5 mg/ml, whereas the dry-film preparation delivers high signal-to-noise ratios due to the prior water evaporation, thus allowing a reliable determination of secondary structure information. Graphical abstract.

Keywords: Biopharmaceuticals; FT-IR-ATR spectroscopy; Insulin fibrils; Insulin stability; Quality control; Secondary structure analysis.


Conflict of interest statement

The authors declare that they have no conflict of interest.

Figures

None
Graphical abstract
Fig. 1
Fig. 1
Overview of the different analytical approaches, used for the analysis of proteins. Besides the options on determining structural characteristics such as the secondary structure for monitoring the protein stability or aggregation processes, also a variety of possibilities for the quantitation and identification exist (SDS-PAGE, sodium dodecyl sulfate polyacrylamide gel electrophoresis; SEM, scanning electron microscopy; DSC, differential scanning calorimetry; ROA, Raman optical activity)
Fig. 2
Fig. 2
Photography of the fiber-optic probe with two silver halide waveguides encased in polyetheretherketone (PEEK) tubings for guaranteeing stability, flexibility, and protection from chemical and UV damage. The probe head in the inset shows the diamond ATR element allowing for two 45° reflections, as highlighted in the schematics
Fig. 3
Fig. 3
Image of the surface structure and thickness of a model insulin detemir dry-film, showing a cross-section on a microscopic slide, recorded with a laser scanning microscope (LSM). For the preparation, a 50 μl sample had been poured alongside the tape/slide interface in vertical direction and was then dried under ambient temperature in a laminar flow cabinet for 24 h, before the tape was removed (left side)
Fig. 4
Fig. 4
Comparison of spectra from 1% aqueous creatinine solutions as measured with a 30 μm transmission cell and an ATR diamond probe (a). Experimental and theoretical considerations concerning the penetration depth and effective path length for radiation in the mid-infrared wavenumber range between 2100 and 850 cm−1 into an aqueous diluted solution, using optical constants of water from Bertie et al. [30] (b)
Fig. 5
Fig. 5
Transmittance (red and purple) and single beam (magenta and blue) spectra of distilled water and human plasma as measured in a transmission cell with a path length of either 3 or 30 μm (a). Absorbance spectra of a human plasma sample measured with an ATR μ-Circle cell (green) and in transmission (blue—30 μm path length). The dark red and yellow curves represent a dialyzed plasma sample and an ethylenediaminetetraacetic acid (EDTA) solution, measured in the 30 μm transmission cell (b)
Fig. 6
Fig. 6
Comparison of two different infrared spectroscopic measurement techniques. In plot (a), aqueous solutions of bovine serum albumin and an USP human insulin sample were measured by ATR spectroscopy and reveal the potential for analyzing the whole protein spectrum between 1750 and 750 cm−1. The colored bars at the bottom represent the spectral ranges, covered by four combined tunable QCL modules, whose spectra are shown below (b). The black curve is a calculated water spectrum at a transmission path length of 25 μm. Plotted underneath is a glucose spectrum, measured in a 50 μm transmission cell by the EC-QCL spectrometer with an average power of 3 mW, as well as absorbance noise spectra for two water-filled cells with different path lengths
Fig. 7
Fig. 7
Spectral overview of the different aqueous excipients as used in commercial insulin formulations within the wavenumber range of protein-related vibrational bands. All spectra are offset for clarity and were measured against water as background with the fiber-optic ATR probe
Fig. 8
Fig. 8
Plots (a) and (b) show a detailed spectral analysis of two commercially available insulins, such as insulin detemir (Levemir) and insulin lispro (Humalog), respectively. For the matrix composition, the excipients with appropriate concentrations were taken from the package insert (see Table 1)
Fig. 9
Fig. 9
(a) Spectra of a formulated insulin detemir (Levemir), freshly taken from the vial (red), and after fibrillation (black), as well as the corresponding second derivative spectra. (b) Comparison of absorbance and second derivative spectra from a formulated and dried insulin detemir sample (scaled for clarity), showing the same protein secondary structures
Fig. 10
Fig. 10
(a) Spectra of pure glycerol, water, and an insulin lispro dry-film sample, as well as the insulin sample after scaled subtraction, measured with the ATR fiber probe. (b) Second derivative spectra of an assembled water and glycerol spectrum, as characteristic for these excipients in formulated insulin dry-films, as well as from the insulin lispro sample before and after scaled subtraction of the abovementioned excipients

References

    1. Heinemann L, Braune K, Carter A, Zayani A, Krämer LA. Insulin storage: a critical reappraisal. J Diabetes Sci Technol. 2020;online first. 10.1177/1932296819900258. - PMC - PubMed
    1. Beals JM, DeFelippis MR, Kovach PM, Jackson JA. Insulin. In: Crommelin DJA, Sindelar RD, Meibohm B, editors. Pharmaceutical biotechnology – fundamentals and applications. 4. New York: Springer; 2013. pp. 255–275.
    1. Hua Q-X, Weiss MA. Mechanism of insulin fibrillation. J Biol Chem. 2004;20(14):21449–21460. doi: 10.1074/jbc.M314141200. - DOI - PubMed
    1. Frankaer CG, Sonderby P, Bang MB, Mateiu RV, Groenning M, Bukrinski J, Harris P. Insulin fibrillation: the influence and coordination of Zn2+ J Struc Biol. 2017;199:27–38. doi: 10.1016/j.jsb.2017.05.006. - DOI - PubMed
    1. Palaniswamy MS, Coffey A. Size exclusion chromatography of biosimilar and innovator insulin. In: Agilent. Aggregates/fragment analysis – application compendium. USA:Agilent; 2020. p. 22–28.