

What Is the Test-Retest Reliability of Common Task-Functional MRI Measures? New Empirical Evidence and a Meta-Analysis
- PMID: 32489141
- PMCID: PMC7370246
- DOI: 10.1177/0956797620916786
What Is the Test-Retest Reliability of Common Task-Functional MRI Measures? New Empirical Evidence and a Meta-Analysis
Abstract
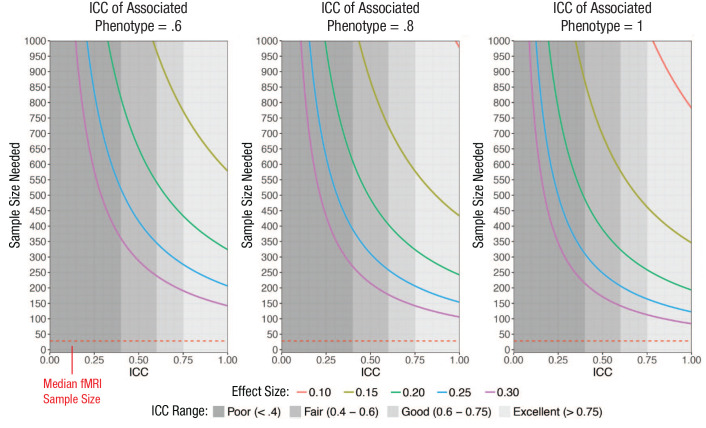
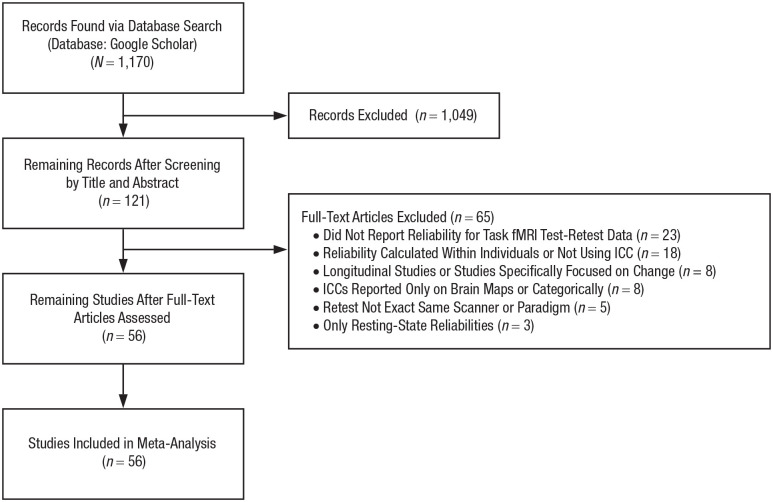
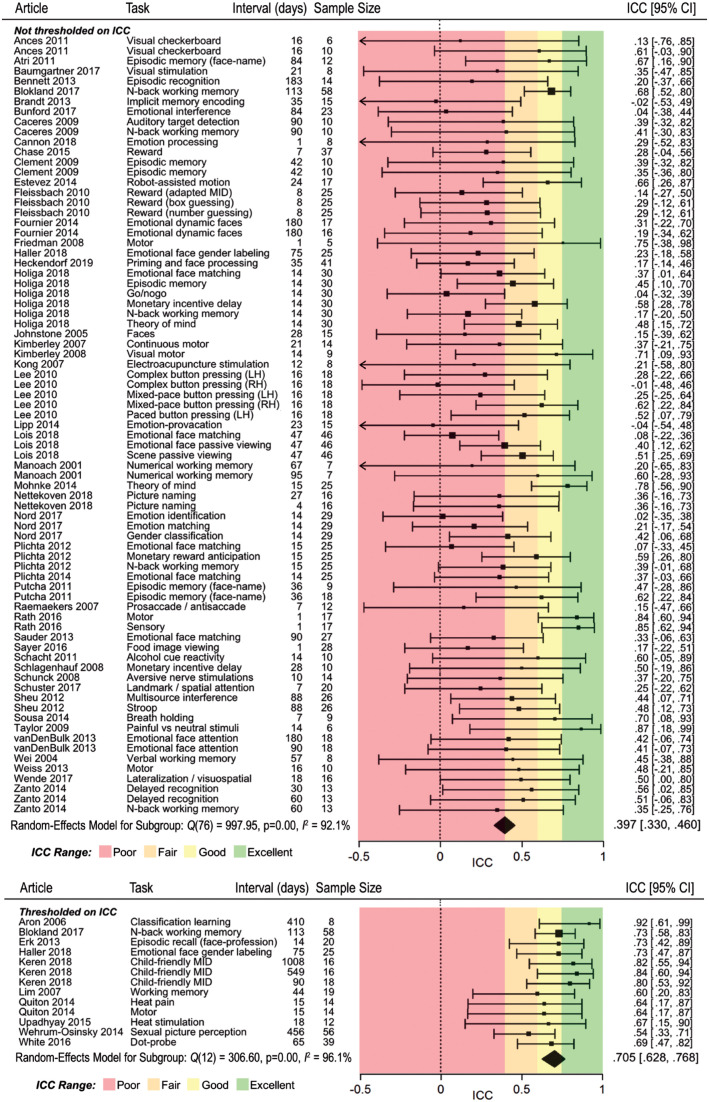
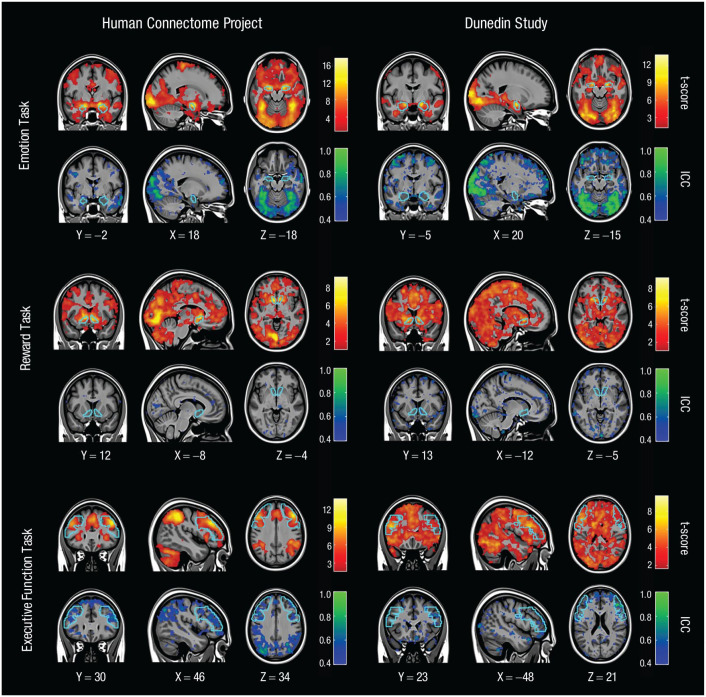
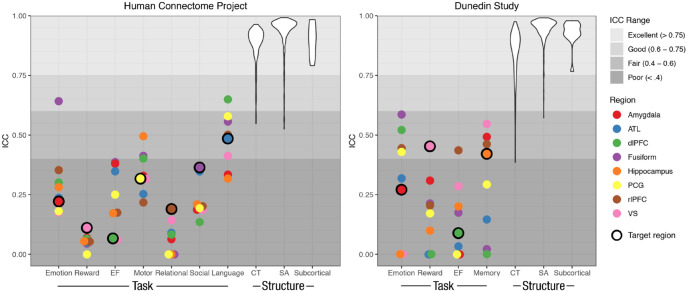
Identifying brain biomarkers of disease risk is a growing priority in neuroscience. The ability to identify meaningful biomarkers is limited by measurement reliability; unreliable measures are unsuitable for predicting clinical outcomes. Measuring brain activity using task functional MRI (fMRI) is a major focus of biomarker development; however, the reliability of task fMRI has not been systematically evaluated. We present converging evidence demonstrating poor reliability of task-fMRI measures. First, a meta-analysis of 90 experiments (N = 1,008) revealed poor overall reliability-mean intraclass correlation coefficient (ICC) = .397. Second, the test-retest reliabilities of activity in a priori regions of interest across 11 common fMRI tasks collected by the Human Connectome Project (N = 45) and the Dunedin Study (N = 20) were poor (ICCs = .067-.485). Collectively, these findings demonstrate that common task-fMRI measures are not currently suitable for brain biomarker discovery or for individual-differences research. We review how this state of affairs came to be and highlight avenues for improving task-fMRI reliability.
Keywords: cognitive neuroscience; individual differences; neuroimaging; statistical analysis.
Conflict of interest statement
Figures
Comment in
-
Need for Psychometric Theory in Neuroscience Research and Training: Reply to Kragel et al. (2021).Psychol Sci. 2021 Apr;32(4):627-629. doi: 10.1177/0956797621996665. Epub 2021 Mar 8. Psychol Sci. 2021. PMID: 33685291 No abstract available.
-
Functional MRI Can Be Highly Reliable, but It Depends on What You Measure: A Commentary on Elliott et al. (2020).Psychol Sci. 2021 Apr;32(4):622-626. doi: 10.1177/0956797621989730. Epub 2021 Mar 8. Psychol Sci. 2021. PMID: 33685310 Free PMC article. No abstract available.
Similar articles
-
General functional connectivity: Shared features of resting-state and task fMRI drive reliable and heritable individual differences in functional brain networks.Neuroimage. 2019 Apr 1;189:516-532. doi: 10.1016/j.neuroimage.2019.01.068. Epub 2019 Jan 29. Neuroimage. 2019. PMID: 30708106 Free PMC article.
-
Test-retest reliability of evoked BOLD signals from a cognitive-emotive fMRI test battery.Neuroimage. 2012 Apr 15;60(3):1746-58. doi: 10.1016/j.neuroimage.2012.01.129. Epub 2012 Feb 8. Neuroimage. 2012. PMID: 22330316
-
Capturing brain-cognition relationship: Integrating task-based fMRI across tasks markedly boosts prediction and test-retest reliability.Neuroimage. 2022 Nov;263:119588. doi: 10.1016/j.neuroimage.2022.119588. Epub 2022 Aug 31. Neuroimage. 2022. PMID: 36057404
-
Test-retest reliabilities of resting-state FMRI measurements in human brain functional connectomics: a systems neuroscience perspective.Neurosci Biobehav Rev. 2014 Sep;45:100-18. doi: 10.1016/j.neubiorev.2014.05.009. Epub 2014 May 27. Neurosci Biobehav Rev. 2014. PMID: 24875392 Review.
-
A decade of test-retest reliability of functional connectivity: A systematic review and meta-analysis.Neuroimage. 2019 Dec;203:116157. doi: 10.1016/j.neuroimage.2019.116157. Epub 2019 Sep 5. Neuroimage. 2019. PMID: 31494250 Free PMC article.
Cited by
-
Noxious pressure stimulation demonstrates robust, reliable estimates of brain activity and self-reported pain.Neuroimage. 2020 Nov 1;221:117178. doi: 10.1016/j.neuroimage.2020.117178. Epub 2020 Jul 22. Neuroimage. 2020. PMID: 32707236 Free PMC article.
-
Elevating the field for applying neuroimaging to individual patients in psychiatry.Transl Psychiatry. 2024 Feb 10;14(1):87. doi: 10.1038/s41398-024-02781-7. Transl Psychiatry. 2024. PMID: 38341414 Free PMC article. Review.
-
Characterization of whole-brain task-modulated functional connectivity in response to nociceptive pain: A multisensory comparison study.Hum Brain Mapp. 2022 Feb 15;43(3):1061-1075. doi: 10.1002/hbm.25707. Epub 2021 Nov 11. Hum Brain Mapp. 2022. PMID: 34761468 Free PMC article.
-
Internal reliability of blame-related functional MRI measures in major depressive disorder.Neuroimage Clin. 2021;32:102901. doi: 10.1016/j.nicl.2021.102901. Epub 2021 Nov 28. Neuroimage Clin. 2021. PMID: 34911203 Free PMC article.
-
The impact of neighborhood disadvantage on amygdala reactivity: Pathways through neighborhood social processes.Dev Cogn Neurosci. 2022 Apr;54:101061. doi: 10.1016/j.dcn.2022.101061. Epub 2022 Jan 12. Dev Cogn Neurosci. 2022. PMID: 35042163 Free PMC article.
References
-
- Bennett C. M., Miller M. B. (2010). How reliable are the results from functional magnetic resonance imaging? Annals of the New York Academy of Sciences, 1191, 133–155. - PubMed
-
- Borenstein M., Hedges L. V., Higgins J. P. T., Rothstein H. R. (2009). Introduction to meta-analysis. Chichester, England: John Wiley. doi:10.1002/9780470743386 - DOI
-
- Button K. S., Ioannidis J. P. A., Mokrysz C., Nosek B. A., Flint J., Robinson E. S. J., Munafò M. R. (2013). Power failure: Why small sample size undermines the reliability of neuroscience. Nature Reviews Neuroscience, 14, 365–376. - PubMed
-
- Champely S. (2018). Package ‘pwr.’ Retrieved from http://cran.r-project.org/package=pwr
Publication types
MeSH terms
Grants and funding
LinkOut - more resources
Full Text Sources
Medical
