. 2020 May 19:11:2042018820920551.
doi: 10.1177/2042018820920551. eCollection 2020.

Levothyroxine prescriptions trends may indicate a downtrend in prescribing

Affiliations

Levothyroxine prescriptions trends may indicate a downtrend in prescribing

Jacqueline Jonklaas et al. Ther Adv Endocrinol Metab. .

Abstract

Background: There has been a trend for increased prescribing of levothyroxine (LT4) in many countries, including the United States. Several different factors have been suggested to be the cause of this practice pattern. These factors include increased size of the United States population, more diagnosis of hypothyroidism, more treatment of minimally elevated thyroid-stimulating hormone (TSH) levels, more use of LT4 in older patients, and use of LT4 for treatment of euthyroid patients with non-thyroidal conditions.

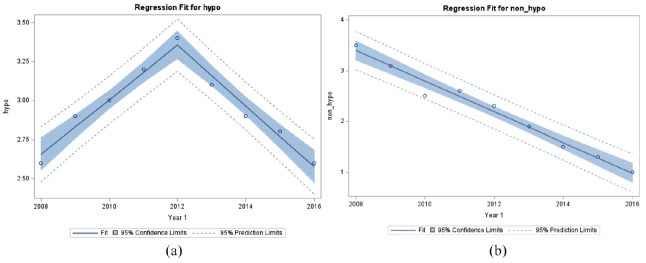
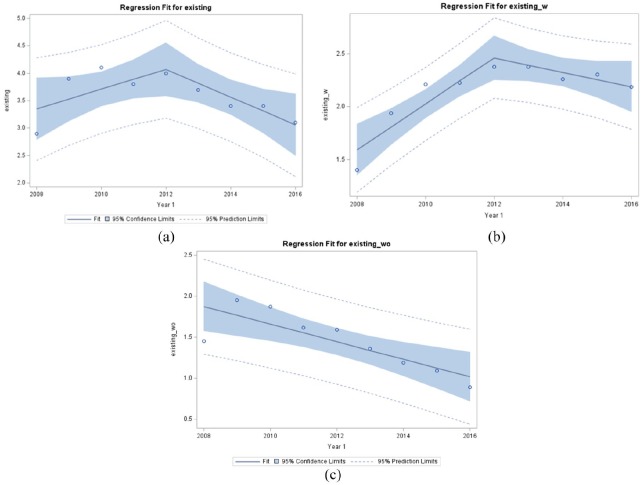
Methods: The electronic databases of the MedStar Health system operating in the Washington, DC and Maryland areas were interrogated to determine the number of patients who were being prescribed levothyroxine during the time period 2008-2016, the number of prescriptions supplied to these individuals, the associated diagnosis, and whether the prescriptions were new or existing prescriptions. Regression analyses were also performed to determine the prescribing trends during this time period.

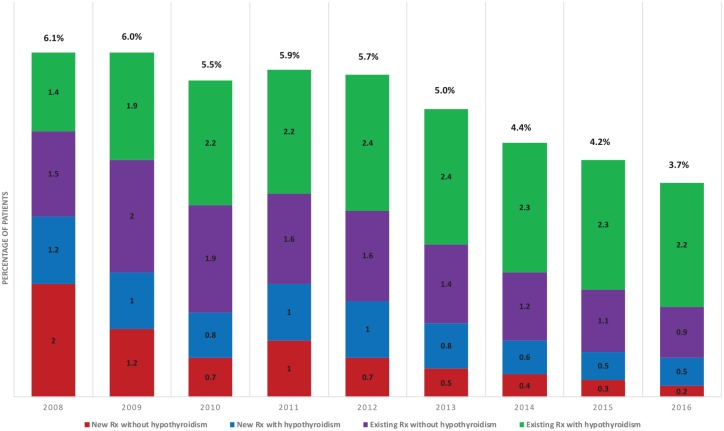
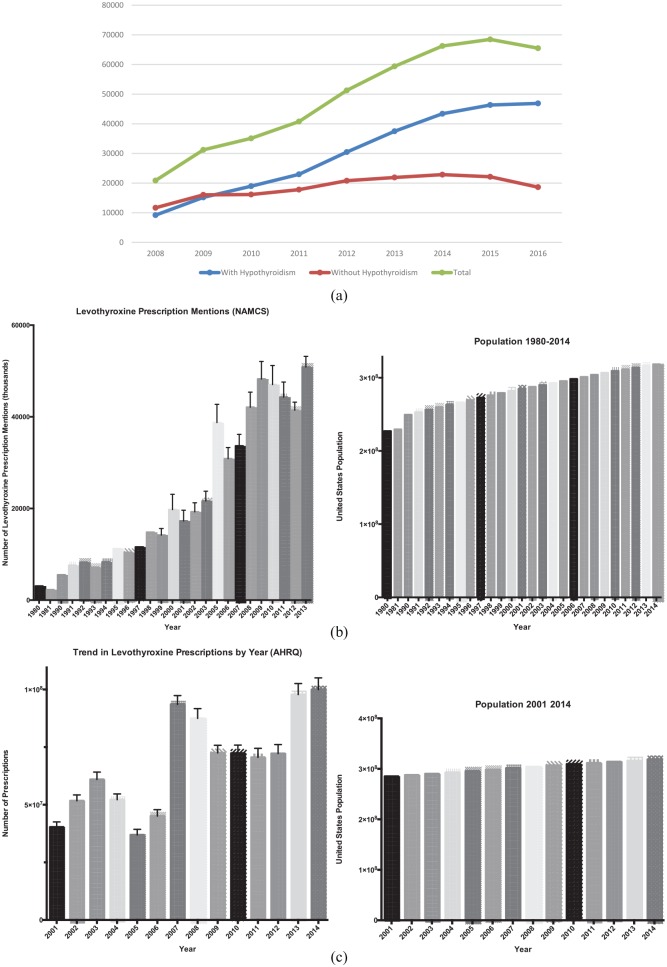
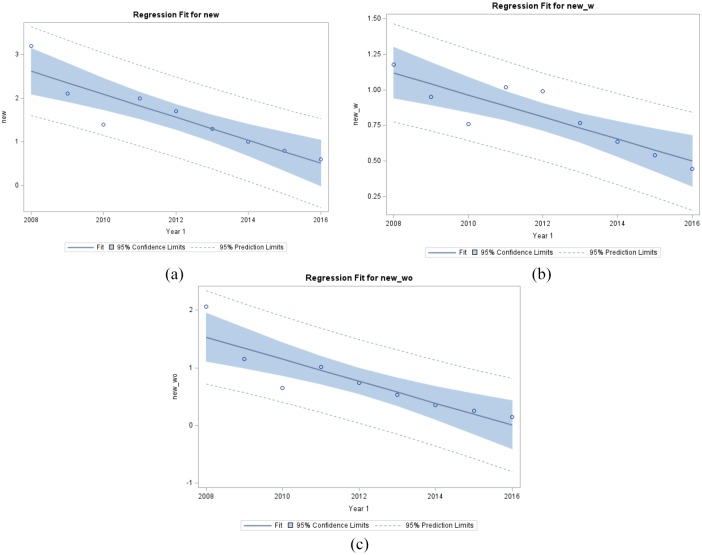
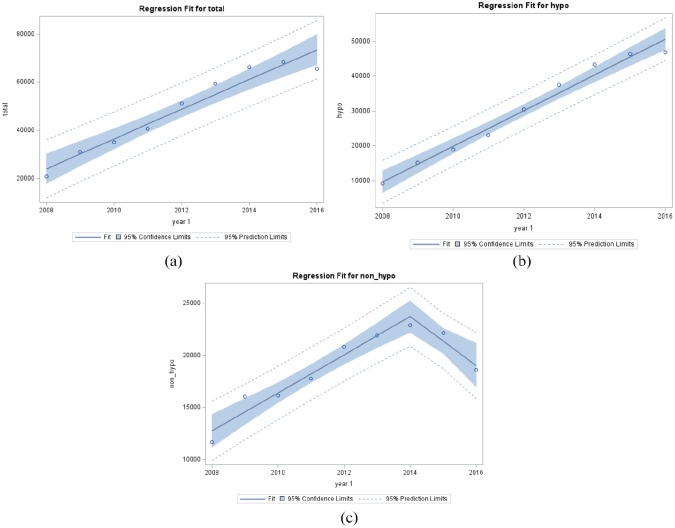
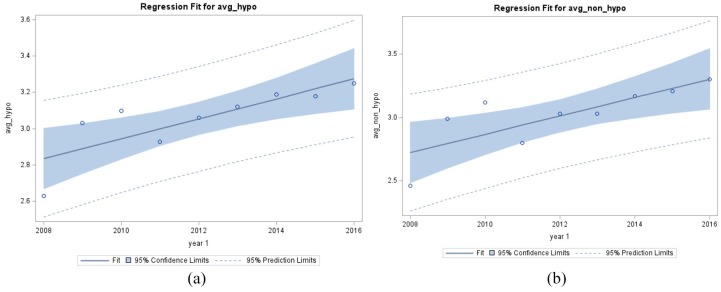
Results: Although the annual number of levothyroxine prescriptions increased during this time period, the percentage of patients in the database receiving levothyroxine for hypothyroidism initially increased and then decreased over time (2.5% to 3.2% to 2.5%). The percentage of prescriptions written for patients who did not appear to carry a diagnosis of hypothyroidism steadily declined (3.5% to 1.0%). Although the percentage of patients with existing prescriptions for hypothyroidism initially increased and then were maintained at steady levels (1.4% to 2.4% to 2.2%), a smaller percentage of patients with existing prescriptions were documented over time when there was no diagnosis of hypothyroidism (1.45% to 0.89%). The percentage of patients with new prescriptions declined over time for all groups. The number of annual 90-day period prescriptions increased over the time for patients with a diagnosis of hypothyroidism, but down-trended starting over the latter part of the time period for those patients without a diagnosis of hypothyroidism.

Conclusion: Taken together, these data suggest that there may be a stabilization, and even a down-trend in levothyroxine prescribing with the MedStar system. The decrease in levothyroxine prescribing appears to be accounted for by less use of levothyroxine without an established diagnosis of hypothyroidism, and less initiation of new prescriptions.

Keywords: hypothyroidism; levothyroxine; prescribing; prescriptions.


Conflict of interest statement

Conflict of interest: JJ has no disclosures. SD is a senior biostatistician for MedStar Health Research Institute.

Figures

Figure 1.
Figure 1.
Percentage of patients being prescribed levothyroxine between 2008 and 2016, divided according to whether they carried a diagnosis of hypothyroidism or not, and also divided by whether their prescription was a previously existing one or a new one. Rx, prescription.
Figure 2.
Figure 2.
(a) Total number of prescriptions per year in the MedStar database, with one prescription being defined as 90 tablets. (b) Total number of prescriptions mentions per year in the National Ambulatory Medical Care Survey (NAMCS) database, with no correction for prescription duration. (c) Total number of prescriptions per year in the Agency for Healthcare Research and Quality (AHRQ) database, with no correction for prescription duration.
Figure 3.
Figure 3.
(a) Percentage of patients receiving LT4 prescriptions for hypothyroidism fit to a model with a knot at year 2012 using spline regression analysis (95% confidence limits are displayed). (b) Percentage of patients receiving LT4 prescriptions given without a diagnosis of hypothyroidism fit to a linear model (95% confidence limits are displayed). Hypo, patients with a diagnosis of hypothyroidism; LT4, levothyroxine; Non-hypo, patients without a diagnosis of hypothyroidism.
Figure 4.
Figure 4.
(a) Percentage of all patients receiving existing LT4 prescriptions fit to a model with a knot at year 2012 using spline regression analysis (95% confidence limits are displayed). (b) Percentage of patients receiving existing LT4 prescriptions for a diagnosis of hypothyroidism fit to a model with a knot at year 2012 using spline regression analysis (95% confidence limits are displayed). (c) Percentage of patients receiving existing LT4 prescriptions without a diagnosis of hypothyroidism fit to a linear model (95% confidence limits are displayed). Existing, patients receiving existing LT4 prescriptions; Existing-w, patients with a diagnosis of hypothyroidism receiving existing LT4 prescriptions; Existing-wo, patients without a diagnosis of hypothyroidism receiving existing LT4 prescriptions; LT4, levothyroxine.
Figure 5.
Figure 5.
(a) Percentage of all patients receiving new LT4 prescriptions fit to a linear model (95% confidence limits are displayed). (b) Percentage of patients receiving new LT4 prescriptions with a diagnosis of hypothyroidism fit to a linear model (95% confidence limits are displayed). (c) Percentage of patients receiving new LT4 prescriptions without a diagnosis of hypothyroidism fit to a linear model (95% confidence limits are displayed). New, patients receiving new LT4 prescriptions; New-w, patients with a diagnosis of hypothyroidism receiving existing LT4 prescriptions; New-wo, patients without a diagnosis of hypothyroidism receiving existing LT4 prescriptions; LT4, levothyroxine.
Figure 6.
Figure 6.
(a) The total number of prescriptions written for LT4 on an annual basis. (b) The total number of prescriptions written for LT4 on an annual basis for those with a diagnosis of hypothyroidism. (c) The total number of prescriptions written for LT4 on an annual basis for those without a diagnosis of hypothyroidism. Hypo, total number of prescriptions written for a diagnosis of hypothyroidism; LT4, levothyroxine; Non-hypo, total number of prescriptions written without a diagnosis of hypothyroidism; Total, total number of prescriptions.
Figure 7.
Figure 7.
(a) The mean number of prescriptions per year per patient written for patients with a diagnosis of hypothyroidism. (b) The mean number of prescriptions per year per patient written for patients without a diagnosis of hypothyroidism. Avg-hypo, average number of prescriptions for patients with hypothyroidism; Avg-non-hypo, average number of prescriptions for patients without hypothyroidism.

References

    1. Top 25 Medicines by Dispensed Prescriptions (U.S.) Source: IMS Health, National Prescription Audit, Dec 2012. IMS Health, a healthcare information, services and technology company.
    1. Medicines Use and Spending Shifts. Report by the IMS Institute for Healthcare Informatics. Source: IMS Health, National Prescription Audit, Jan 2015. IMS Health, a healthcare information, services and technology company.
    1. Medicine Use and Spending in the U.S. A Review of 2017 and Outlook to 2022 Institute Report Apr 19, 2018. The IQVIA Institute; https://www.iqvia.com/insights/the-iqvia-institute/reports/medicine-use-... (accessed 15 April 2020).
    1. Medicine Use and Spending in the U.S. A Review of 2018 and Outlook to 2023 Institute Report May 09, 2019. The IQVIA Institute; https://www.iqvia.com/insights/the-iqvia-institute/reports/medicine-use-... (accessed 15 April 2020).
    1. Kantor ED, Rehm CD, Haas JS, et al. Trends in prescription drug use among adults in the United States from 1999-2012. JAMA 2015; 314: 1818–1831. - PMC - PubMed

LinkOut - more resources