Review
. 2020 Apr 16;10(10):4495-4514.
doi: 10.1002/ece3.6205. eCollection 2020 May.

Effects of ocean acidification on Antarctic marine organisms: A meta-analysis

Affiliations
Review

Effects of ocean acidification on Antarctic marine organisms: A meta-analysis

Alyce M Hancock et al. Ecol Evol. .

Abstract

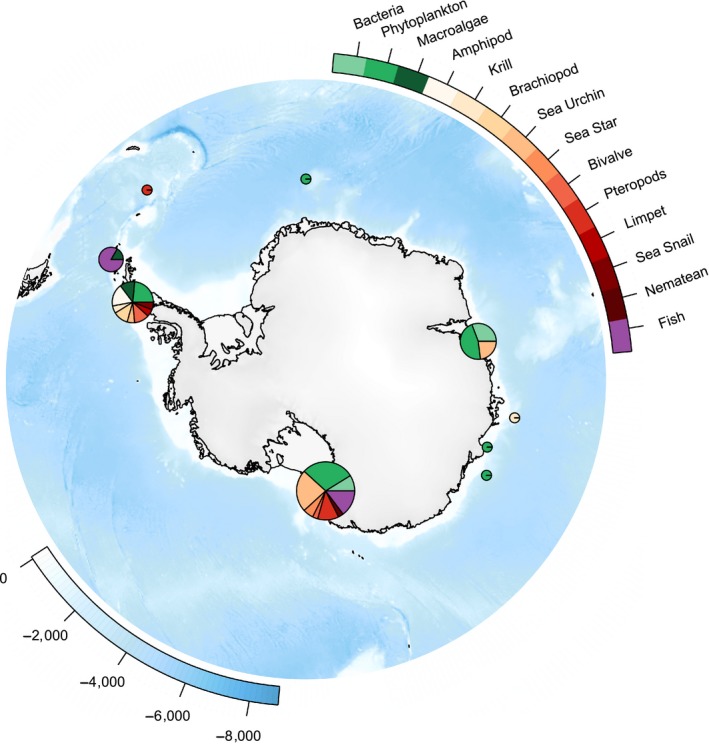
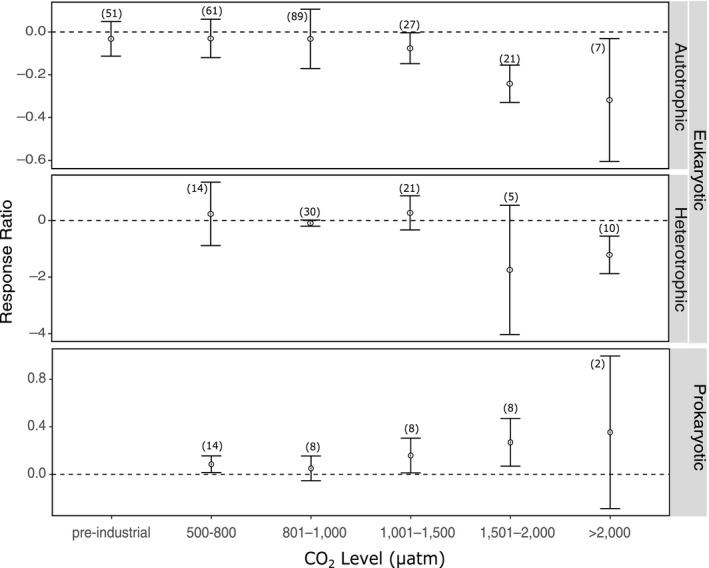
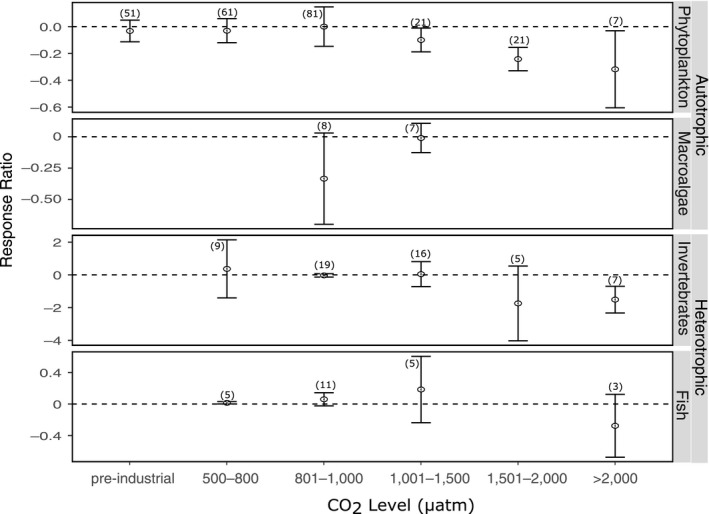
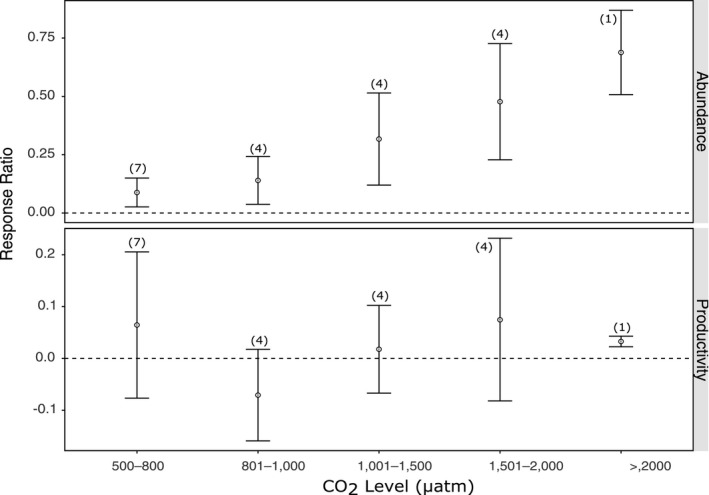
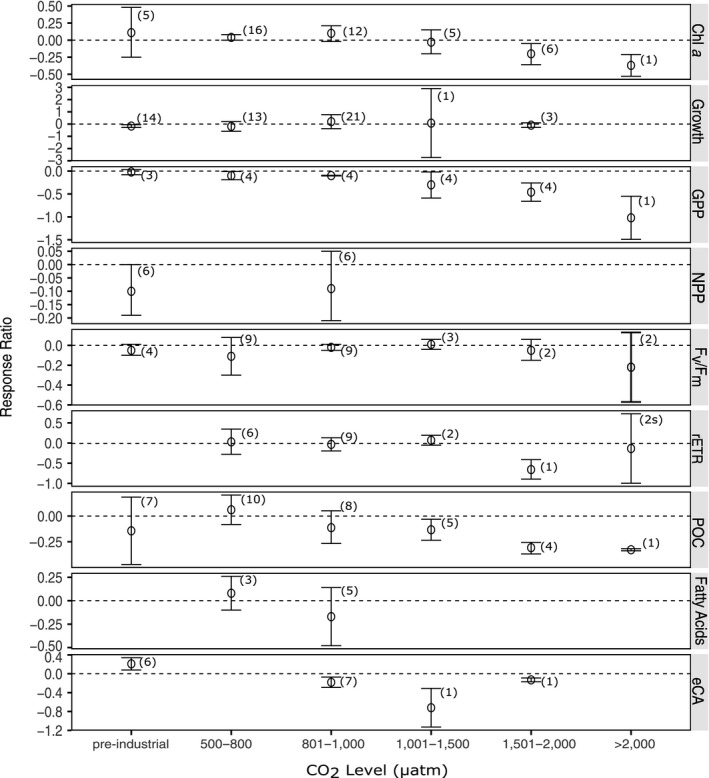
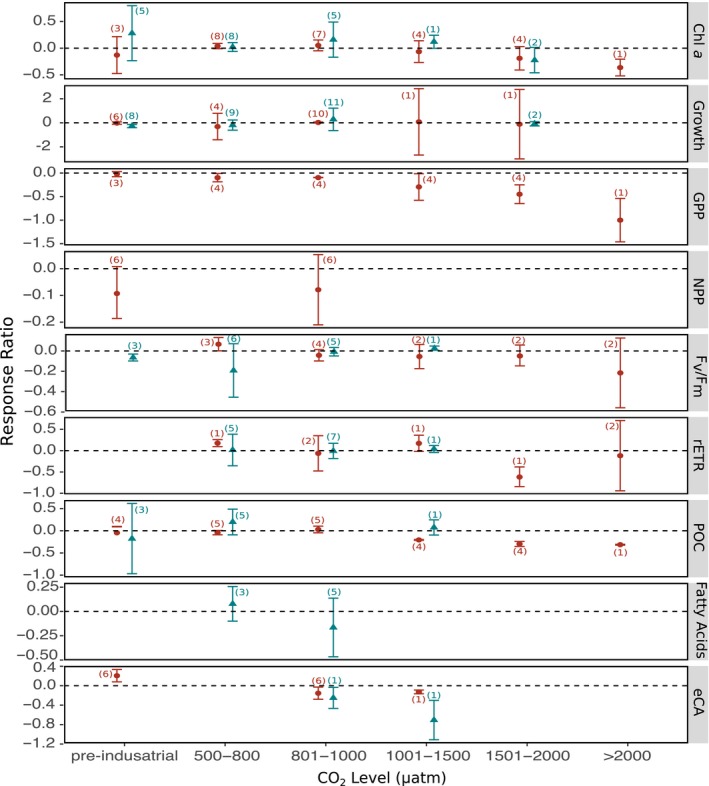
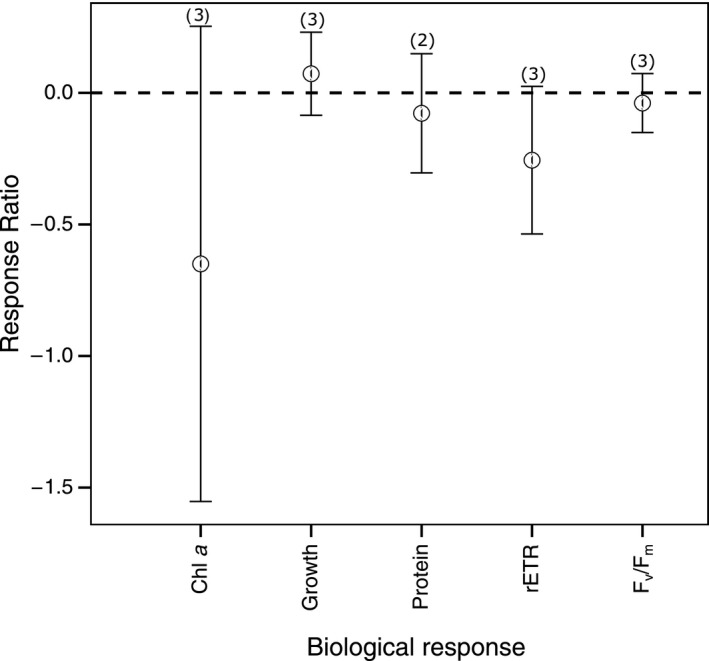
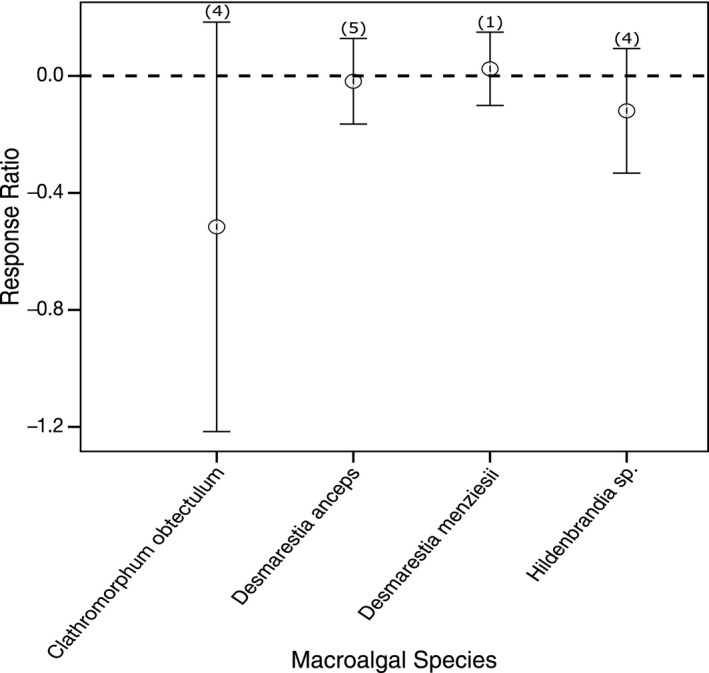
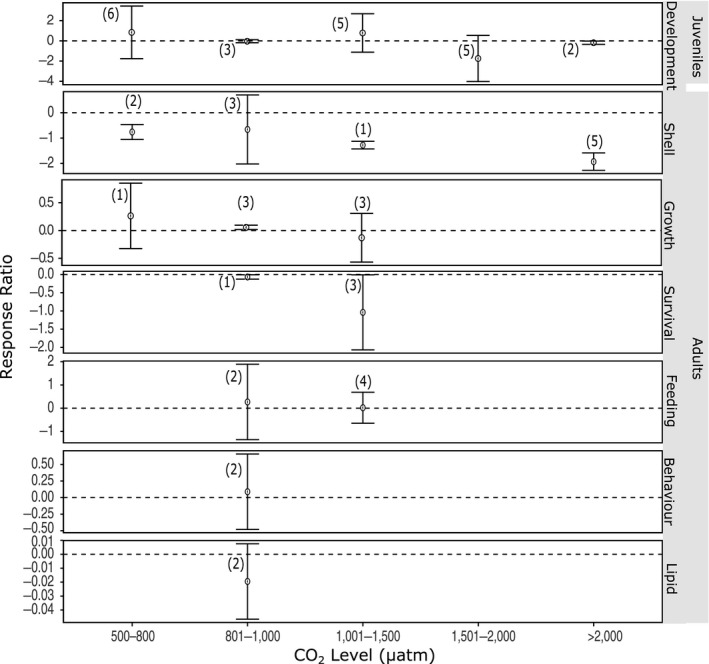
Southern Ocean waters are among the most vulnerable to ocean acidification. The projected increase in the CO2 level will cause changes in carbonate chemistry that are likely to be damaging to organisms inhabiting these waters. A meta-analysis was undertaken to examine the vulnerability of Antarctic marine biota occupying waters south of 60°S to ocean acidification. This meta-analysis showed that ocean acidification negatively affects autotrophic organisms, mainly phytoplankton, at CO2 levels above 1,000 μatm and invertebrates above 1,500 μatm, but positively affects bacterial abundance. The sensitivity of phytoplankton to ocean acidification was influenced by the experimental procedure used. Natural, mixed communities were more sensitive than single species in culture and showed a decline in chlorophyll a concentration, productivity, and photosynthetic health, as well as a shift in community composition at CO2 levels above 1,000 μatm. Invertebrates showed reduced fertilization rates and increased occurrence of larval abnormalities, as well as decreased calcification rates and increased shell dissolution with any increase in CO2 level above 1,500 μatm. Assessment of the vulnerability of fish and macroalgae to ocean acidification was limited by the number of studies available. Overall, this analysis indicates that many marine organisms in the Southern Ocean are likely to be susceptible to ocean acidification and thereby likely to change their contribution to ecosystem services in the future. Further studies are required to address the poor spatial coverage, lack of community or ecosystem-level studies, and the largely unknown potential for organisms to acclimate and/or adapt to the changing conditions.

Keywords: CO2; Southern Ocean; bacteria; climate change; fish; invertebrates; macroalgae; pH; phytoplankton.


Conflict of interest statement

None declared.

Figures

FIGURE 1
FIGURE 1
All studies on the effect of ocean acidification on marine organisms south of 60°S included in the meta‐analysis. Pie charts display the relative number of studies per organism at that location. The size of the pie reflects the total number of studies at that location. Figure created using the R package “SOmap” (Maschette, Sumner, & Raymond, 2018)
FIGURE 2
FIGURE 2
The effect of ocean acidification on heterotrophic and autotrophic eukaryotes, and prokaryotic organisms at different CO2 levels. Mean response ratios and 95% confidence intervals are shown, with the number of data points in each category given in brackets. A mean response ratio of zero (hashed line) indicates no effect
FIGURE 3
FIGURE 3
The effect of ocean acidification on phytoplankton, macroalgae, invertebrates, and fish at different CO2 levels. Mean response ratios and 95% confidence intervals are shown, with the number of data points in each category given in brackets. A mean response ratio of zero (hashed line) indicates no effect
FIGURE 4
FIGURE 4
The effect of ocean acidification on the biological responses of bacteria at different CO2 levels. Mean response ratios and 95% confidence intervals are shown, with the number of data points in each category in brackets. A mean response ratio of zero (hashed line) indicates no effect
FIGURE 5
FIGURE 5
The effect of ocean acidification on the biological responses of phytoplankton to increased CO2 levels. Mean response ratios and 95% confidence intervals are shown, with the number of data points in each category in brackets. A mean response ratio of zero (hashed line) indicates no effect. Refer to Table 1 for abbreviation definitions
FIGURE 6
FIGURE 6
The effect of ocean acidification on the biological responses of phytoplankton to increased CO2 levels, separating studies on single species (shown in blue triangles) from community‐level studies (shown in red circles). Mean response ratios and 95% confidence intervals are shown, with the number of data points in each category in brackets. A mean response ratio of zero (hashed line) indicates no effect. Refer to Table 1 for abbreviation definitions
FIGURE 7
FIGURE 7
The effect of ocean acidification on the biological responses of macroalgae. Mean response ratios and 95% confidence intervals are shown, with the number of data points in each category in brackets. A mean response ratio of zero (hashed line) indicates no effect. Refer to Table 1 for abbreviation definitions
FIGURE 8
FIGURE 8
The effect of ocean acidification on species of macroalgae. Mean response ratios and 95% confidence intervals are shown, with the number of data points in each category in brackets. A mean response ratio of zero (hashed line) indicates no effect
FIGURE 9
FIGURE 9
The effect of ocean acidification on the biological responses of invertebrates to increased CO2 levels. Mean response ratios and 95% confidence intervals are shown, with the number of data points in each category in level. A mean response ratio of zero (hashed line) indicates no effect. Refer to Table 1 for abbreviation definitions
FIGURE 10
FIGURE 10
The effect of ocean acidification on the biological responses of fish. Mean response ratios and 95% confidence intervals are shown, with the number of data points in each category in brackets. A mean response ratio of zero (hashed line) indicates no effect. Refer to Table 1 for abbreviation definitions

Similar articles

Cited by

References

    1. Agostini, S. , Harvey, B. P. , Wada, S. , Kon, K. , Milazzo, M. , Inaba, K. , & Hall‐Spencer, J. M. (2018). Ocean acidification drives community shifts towards simplified non‐calcified habitats in a subtropical‐temperate transition zone. Scientific Reports, 8(1), 11354. - PMC - PubMed
    1. Allgaier, M. , Riebesell, U. , Vogt, M. , Thyrhaug, R. , & Grossart, H.‐P. (2008). Coupling of heterotrophic bacteria to phytoplankton bloom development at different pCO2 levels: A mesocosm study. Biogeosciences, 5(1), 317–359.
    1. Amsler, C. D. , Rowley, R. J. , Laur, D. R. , Quetin, L. B. , & Ross, R. M. (1995). Vertical distribution of Antarctic Peninsular macroalgae: Cover, biomass and species composition. Phycologia, 34(5), 424–430.
    1. Andersson, A. , Mackenzie, F. , & Gattuso, J.‐P. (2011). Effects of ocean acidification on benthic processes, organisms, and ecosystems In Gattuso J.‐P., & Hansson L. (Eds.), Ocean acidification (pp. 122–150). New York, NY: Oxford University Press.
    1. Ansell, A. D. , & Harvey, R. (1997). Protected larval development in the Antarctic bivalve Laternula elliptica (King and Broderip) (Anomalodesmata: Laternulidae). Journal of Molluscan Studies, 63(2), 285–286.

LinkOut - more resources