

Divergent density feedback control of migratory predator recovery following sex-biased perturbations
- PMID: 32489623
- PMCID: PMC7244814
- DOI: 10.1002/ece3.6153
Divergent density feedback control of migratory predator recovery following sex-biased perturbations
Abstract
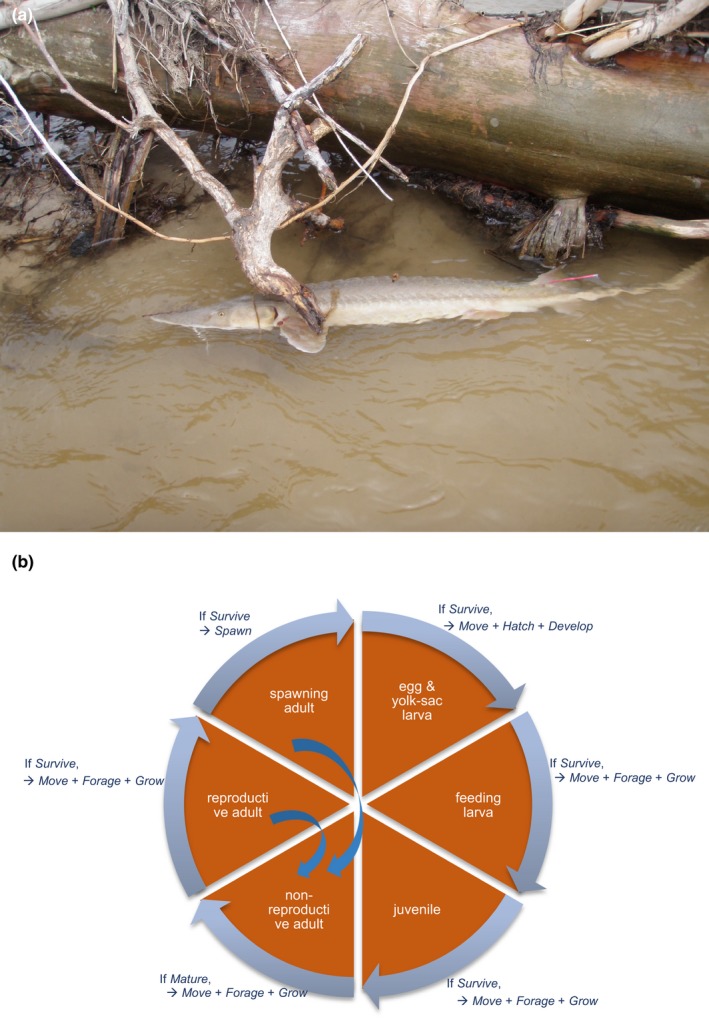
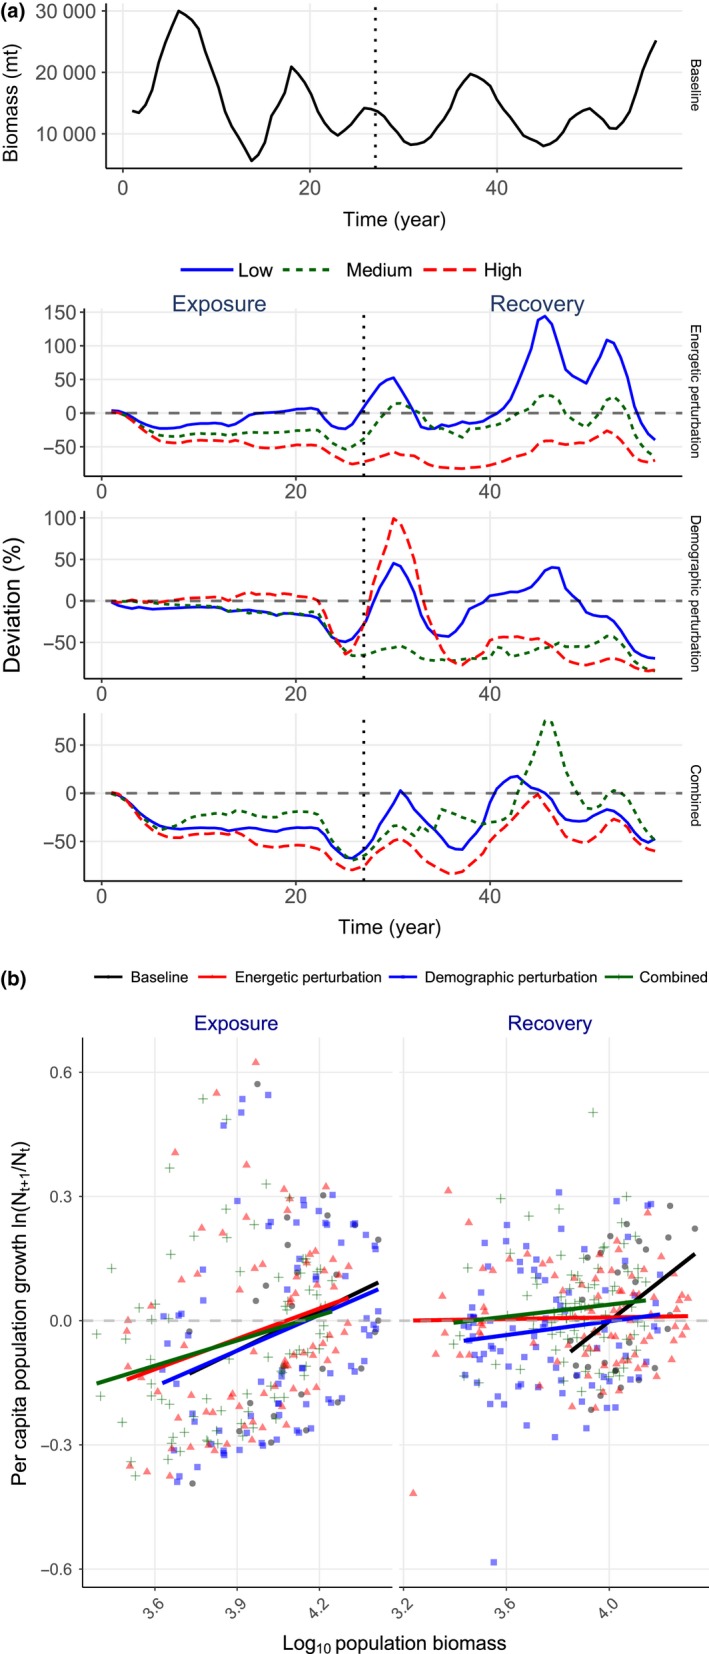
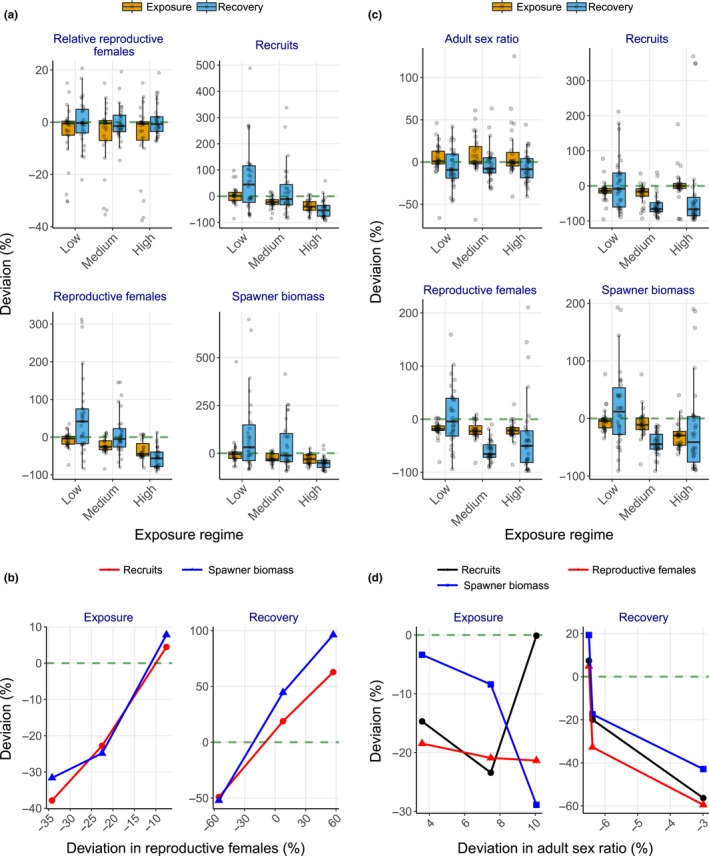
Uncertainty in risks posed by emerging stressors such as synthetic hormones impedes conservation efforts for threatened vertebrate populations. Synthetic hormones often induce sex-biased perturbations in exposed animals by disrupting gonad development and early life-history stage transitions, potentially diminishing per capita reproductive output of depleted populations and, in turn, being manifest as Allee effects. We use a spatially explicit biophysical model to evaluate how sex-biased perturbation in life-history traits of individuals (maternal investment in egg production and male-skewed sex allocation in offspring) modulates density feedback control of year-class strength and recovery trajectories of a long-lived, migratory fish-shovelnose sturgeon (Scaphirhynchus platorynchus)-under spatially and temporally dynamic synthetic androgen exposure and habitat conditions. Simulations show that reduced efficiency of maternal investment in gonad development prolonged maturation time, increased the probability of skipped spawning, and, in turn, shrunk spawner abundance, weakening year-class strength. However, positive density feedback disappeared (no Allee effect) once the exposure ceased. By contrast, responses to the demographic perturbation manifested as strong positive density feedback; an abrupt shift in year-class strength and spawner abundance followed after more than two decades owing to persistent negative population growth (a strong Allee effect), reaching an alternative state without any sign of recovery. When combined with the energetic perturbation, positive density feedback of the demographic perturbation was dampened as extended maturation time reduced the frequency of producing male-biased offspring, allowing the population to maintain positive growth rate (a weak Allee effect) and gradually recover. The emergent patterns in long-term population projections illustrate that sex-biased perturbation in life-history traits can interactively regulate the strength of density feedback in depleted populations such as Scaphirhynchus sturgeon to further diminish reproductive capacity and abundance, posing increasingly greater conservation challenges in chemically altered riverscapes.
Keywords: agent‐based modeling; alternative states; early life history; endangered species; endocrine disruptors; spatially explicit models.
© 2020 The Authors. Ecology and Evolution published by John Wiley & Sons Ltd.
Conflict of interest statement
None declared.
Figures
References
-
- Ankley, G. T. , Jensen, K. M. , Makynen, E. A. , Kahl, M. D. , Korte, J. J. , Hornung, M. W. , … Gray, L. E. (2003). Effects of the androgenic growth promoter 17‐β‐trenbolone on fecundity and reproductive endocrinology of the fathead minnow. Environmental Toxicology and Chemistry, 22, 1350–1360. - PubMed
-
- Arcand Hoy, L. D. , & Benson, W. H. (1998). Fish reproduction: An ecologically relevant indicator of endocrine disruption. Environmental Toxicology and Chemistry, 17, 49–57.
-
- Arukwe, A. , & Goksøyr, A. (1998). Xenobiotics, xenoestrogens and reproduction disturbances in fish. Sarsia, 83, 225–241.
-
- Beddington, J. (1975). Mutual interference between parasites or predators and its effect on searching efficiency. Journal of Animal Ecology, 331–340.
LinkOut - more resources
Full Text Sources
