. 2020 May 9;11(3):603-617.
doi: 10.14336/AD.2019.0529. eCollection 2020 May.

SRμCT Reveals 3D Microstructural Alterations of the Vascular and Neuronal Network in a Rat Model of Chronic Compressive Thoracic Spinal Cord Injury

Affiliations

SRμCT Reveals 3D Microstructural Alterations of the Vascular and Neuronal Network in a Rat Model of Chronic Compressive Thoracic Spinal Cord Injury

Liyuan Jiang et al. Aging Dis. .

Abstract

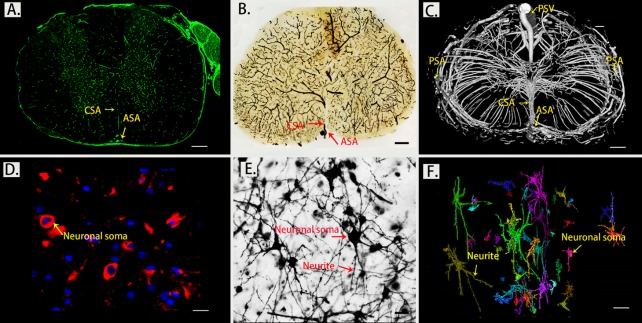
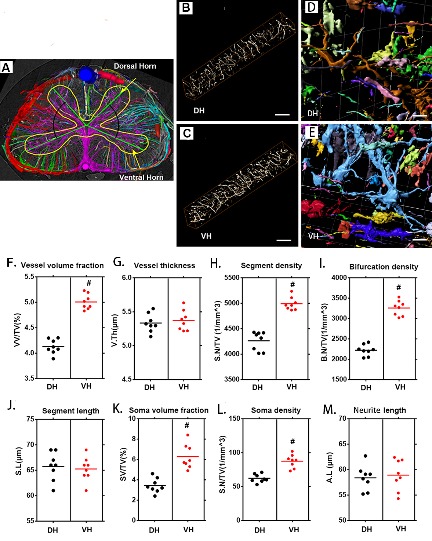
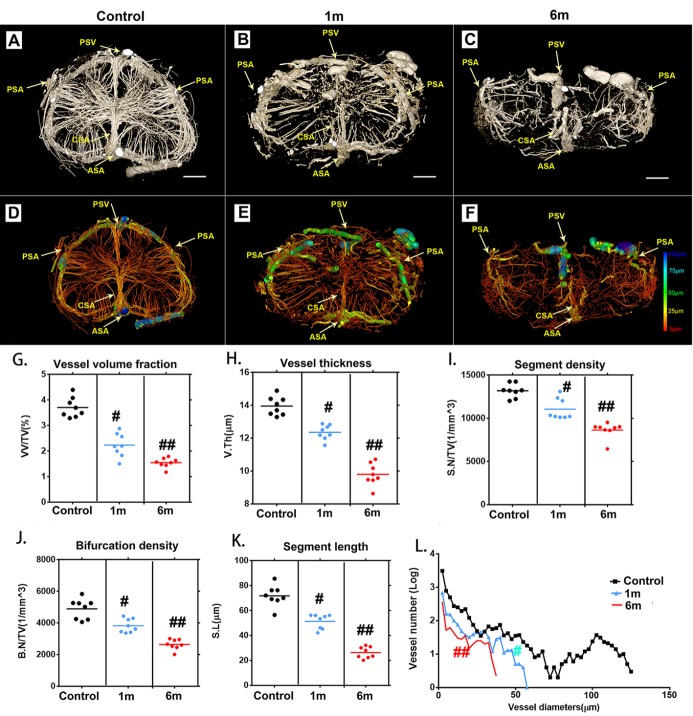
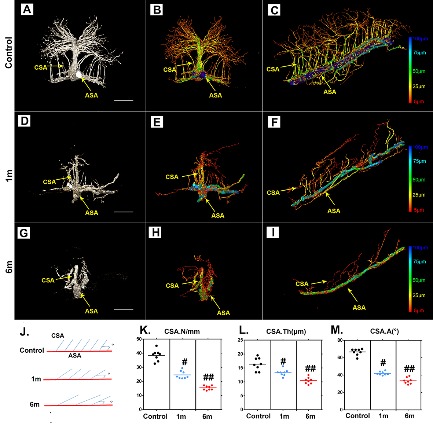
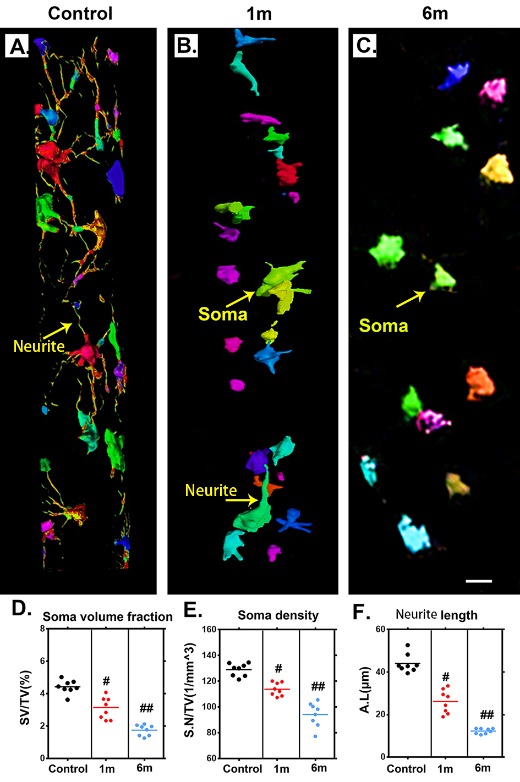
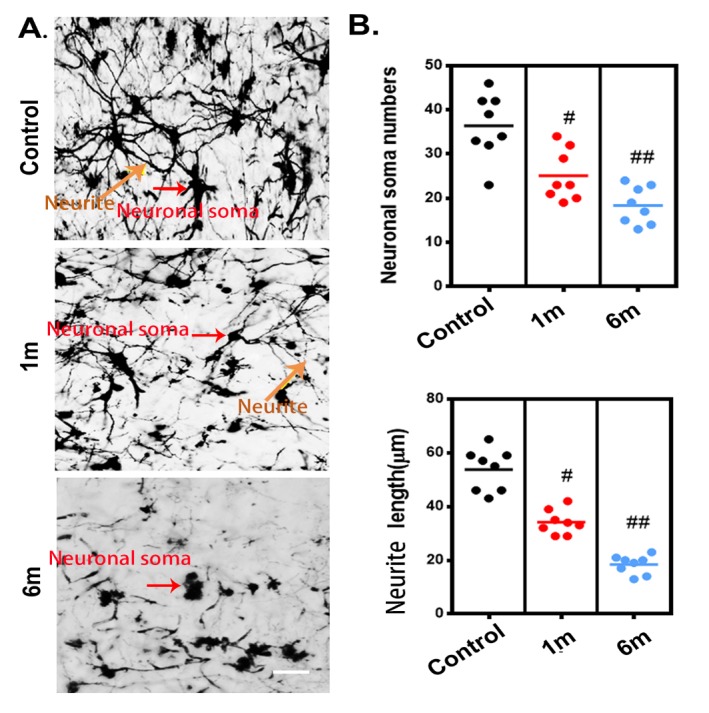
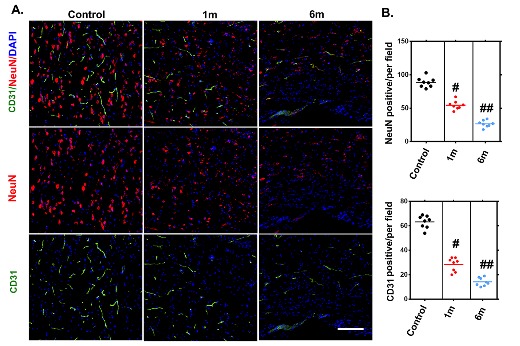
The complex pathology of chronic thoracic spinal cord compression involves vascular and neuroarchitectural repair processes that are still largely unknown. In this study, we used synchrotron radiation microtomography (SRμCT) to quantitatively characterize the 3D temporal-spatial changes in the vascular and neuronal network after chronic thoracic spinal cord compression in order to obtain further insights into the pathogenesis of this disease and to elucidate its underlying mechanisms. Direct 3D characterization of the spinal cord microvasculature and neural microstructure of the thoracic spinal cord was successfully reconstructed. The significant reduction in vasculature and degeneration of neurons in the thoracic spinal cord visualized via SRμCT after chronic compression were consistent with the changes detected by immunofluorescence staining. The 3D morphological measurements revealed significant reductions of neurovascular parameters in the thoracic spinal cord after 1 month of compression and became even worse after 6 months without relief of compression. In addition, the distinct 3D morphological twist and the decrease in branches of the central sulcal artery after chronic compression vividly displayed that these could be the potential triggers leading to blood flow reduction and neural deficits of the thoracic spinal cord. Our findings propose a novel methodology for the 3D analysis of neurovascular repair in chronic spinal cord compression, both qualitatively and quantitatively. The results indicated that compression simultaneously caused vascular dysfunction and neuronal network impairment, which should be acknowledged as concurrent events after chronic thoracic spinal cord injury. Combining neuroprotection with vasoprotection may provide promising therapeutic targets for chronic thoracic spinal cord compression.

Keywords: 3D; SRμCT; chronic spinal cord injury; neurovascular unit; spinal cord microvasculature.


Conflict of interest statement

Disclosure statement No competing financial interests exist.

Figures

Figure 1.
Figure 1.
Morphology of the spinal cord microvasculature and neuronal network detected by a histological technique and SRμCT. (A) Immunofluorescence staining of transverse sections with CD31, scale bar = 250 μm; (B) Thick sections detected with light microscopy for vessel visualization, scale bar = 250 μm; (C) 3D SRμCT images of thoracic spinal cord microvasculature, scale bar = 250 μm; (D) Immunofluorescence staining of transverse sections with NeuN, scale bar = 20 μm; (E) Golgi stained neurons in transverse sections of the spinal cord examined by light microscopy, scale bar=20 μm; (F) Pseudocolored images of 3D structures of the intrinsic neuronal network of the spinal cord visualized with SRμCT, scale bar = 20 μm. (PSV?=?posterior spinal vein; PSA= posterior spinal artery; ASA?=?anterior spinal artery; CSA?=?central sulcal artery)
Figure 2.
Figure 2.
3D qualitative and quantitative characterization of the vascular and neuronal networks in the dorsal and ventral horn of the thoracic spinal cord. (A) 3D image of the spinal cord microvasculature obtained by SRμCT, with different color coding based on vessel connectivity. The yellow line outlines the gray matter. (B, D) 3D images of the vascular network and its corresponding neuronal network randomly selected from the dorsal horn. (C, E) 3D images of the vascular network and its corresponding neuronal network randomly selected from the ventral horn. (G-K) Quantification of the morphological characteristics of the vascular and neuronal networks in the ventral horn and dorsal horn of the thoracic spinal cord. In gray-matter structures of the spinal cord, vessel volume fraction, segment density, bifurcation density, soma volume fraction, and soma density were greater in the ventral horn than in the dorsal horn, and vessel thickness, segment length, and neurite length were similar. VH = ventral horn, DH=Dorsal horn. Scale bar = 20 μm. One-way analysis of variance followed by the Dunn post hoc test was performed. #p?<?0.05, significant difference among different groups. Scale bar = 20 μm.
Figure 3.
Figure 3.
Characteristic 3D morphological alterations of the thoracic spinal cord microvasculature at different time points after surgery to induce chronic compression. (A-C) Representative 3D cross-sectional images of the spinal cord microvasculature after 1 and 6 months of chronic compression. (D-F) Pseudocolored image of the spinal cord microvasculature correlated with vessel thickness at the corresponding time point after compression surgery. (G-K) Quantification of morphological alterations in normal samples and after chronic thoracic spinal cord compression at different time points using network analysis. The vessel volume fraction (G), vessel thickness (H), segment density (I), bifurcation density (J) and segmental length (K) of the thoracic spinal cord significantly decreased after 1 month of chronic compression and worsened after 6 months, at the final follow-up. (L) Changes in the frequency distribution of vascular diameters in the normal and chronic compression groups after 1 and 6 months of compression. The pseudocolor bar in panel F indicates how vascular thickness was coded with different colors. (PSV?=?posterior spinal vein; PSA= posterior spinal artery; ASA?=?anterior spinal artery; CSA?=?central sulcal artery) Scale bar = 250 μm. One-way analysis of variance followed by the Dunn post hoc test was performed. #p?<?0.05, significant difference between the control group and 1 month postcompression. ##p?<?0.01, significant difference between the control group and 6 months postcompression.
Figure 4.
Figure 4.
Characteristic 3D morphological alterations of the thoracic CSA after chronic compression. (A, D and G) Representative original 3D cross-sectional images of the CSA after 1 and 6 months of chronic compression. (B, C, E, F, H, and I) Pseudocolored images of the CSA correlated with vessel thickness at different time points after compression. (J) Schematic depiction of the CSA for quantification. (K, L, and M) Quantification of morphological alterations of the CSA in normal conditions and after 1 and 6 months of chronic thoracic spinal cord compression. The pseudocolor bar in panels C, F, and I indicate the vascular thickness coded with different colors. (ASA?=?anterior spinal artery; CSA?=?central sulcal artery). Scale bar = 250 μm. One-way analysis of variance followed by the Dunn post hoc test was performed. #p?<?0.05, significant difference between the control group and 1 month postcompression. ##p?<?0.01, significant difference between the control group and 6 months postcompression.
Figure 5.
Figure 5.
Characteristic 3D morphological alterations of the neuronal network in the thoracic spinal cord after chronic compression. (A-C) Randomly selected 3D images of the neuronal network in the ventral horn before chronic compression and after 1 and 6 months of chronic compression. (D-F) Quantification of morphological alterations of the neuronal network in normal samples and after 1 and 6 months of chronic thoracic spinal cord compression using network analysis. The soma volume fraction, soma density, and neurite length decreased significantly and were even worse at the final follow-up. Scale bar = 20 μm. One-way analysis of variance followed by the Dunn post hoc test was performed. #p?<?0.05, significant difference between the control group and 1 month postcompression. ##p?<?0.01, significant difference between the control group and 6 months postcompression.
Figure 6.
Figure 6.
The histological morphological alterations of the neural network in the thoracic spinal cord after chronic compression, as detected using Golgi staining. (A) Representative images of the neural network randomly selected from longitudinal sections (30 μm) of the spinal cord in the control group and after 1 and 6 months of chronic thoracic spinal cord compression. Scale bar= 50 μm. (B) Quantification of morphological alterations of the neuronal network in normal samples and after 1 and 6 months of chronic thoracic spinal cord compression. A one-way analysis of variance followed by the Dunn post hoc test was performed. #p?<?0.05, significant difference between the control group and 1-month postcompression. ##p?<?0.01, significant difference between the control group and 6 months postcompression.
Figure 7.
Figure 7.
Histologically visualized morphological alterations of vascular and neuronal networks of the thoracic spinal cord after chronic compression. (A) Representative immunofluorescence images of the vascular and neuronal network, randomly selected from longitudinal sections of the spinal cord before and after 1 and 6 months of chronic compression. (B) Quantification of vascular and neuronal network changes in normal samples and after 1 and 6 months of chronic thoracic spinal cord compression. The NeuN- and CD31-positive cell numbers significantly decreased and were even worse at the final follow-up. Scale bar = 20 μm. One-way analysis of variance followed by the Dunn post hoc test was performed. #p?<?0.05, significant difference between the control group and 1 month postcompression. ##p?<?0.01, significant difference between the control group and 6 months postcompression.

References

    1. McKinley WO, Seel RT, Hardman JT (1999). Nontraumatic spinal cord injury: incidence, epidemiology, and functional outcome. Arch Phys Med Rehabil, 80:619-623. - PubMed
    1. Gupta A, Taly AB, Srivastava A, Murali T (2009). Non-traumatic spinal cord lesions: epidemiology, complications, neurological and functional outcome of rehabilitation. Spinal Cord, 47:307-311. - PubMed
    1. New PW, Sundararajan V (2008). Incidence of non-traumatic spinal cord injury in Victoria, Australia: a population-based study and literature review. Spinal Cord, 46:406-411. - PubMed
    1. Choi BW, Song KJ, Chang H (2011). Ossification of the posterior longitudinal ligament: a review of literature. Asian Spine J, 5:267-276. - PMC - PubMed
    1. Maiuri F, Iaconetta G, Gambardella A (2000). Ossification of the yellow ligament causing thoracic cord compression. Arch Orthop Trauma Surg, 120:346-348. - PubMed

LinkOut - more resources