. 2020 May 6:7:637-648.
doi: 10.1016/j.toxrep.2020.04.011. eCollection 2020.

Cadmium sulfide-induced toxicity in the cortex and cerebellum: In vitro and in vivo studies

Affiliations

Cadmium sulfide-induced toxicity in the cortex and cerebellum: In vitro and in vivo studies

Atefeh Varmazyari et al. Toxicol Rep. .

Erratum in

Abstract

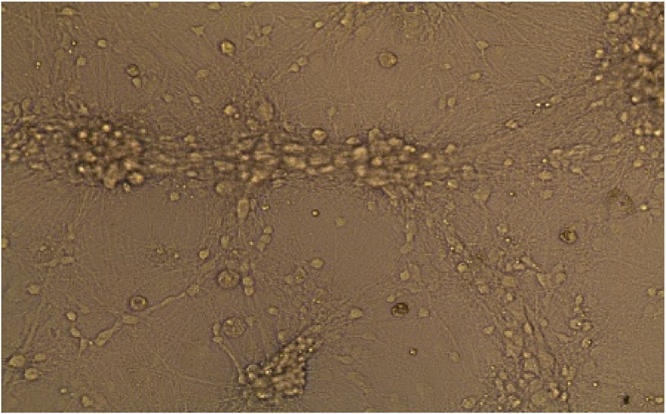
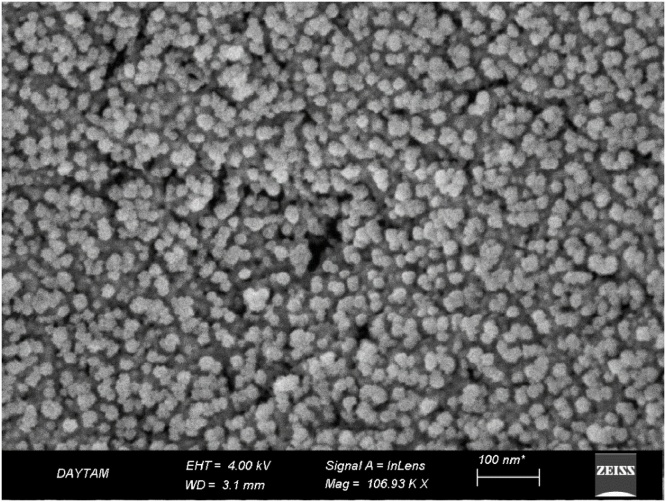
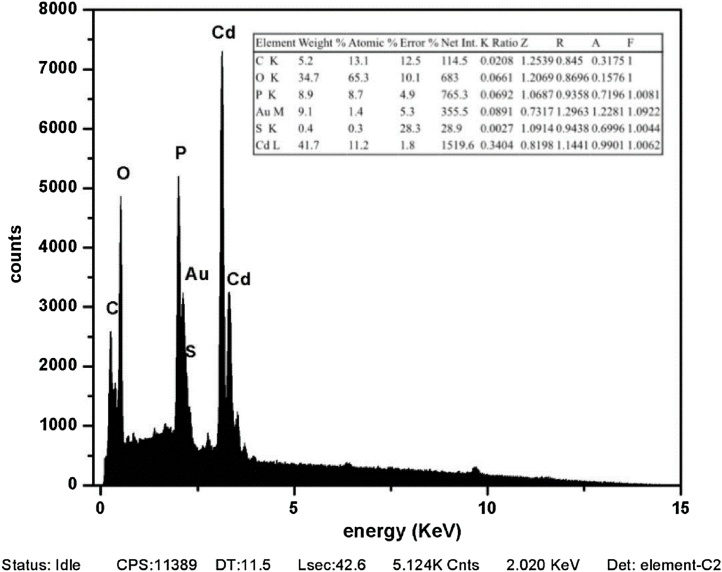
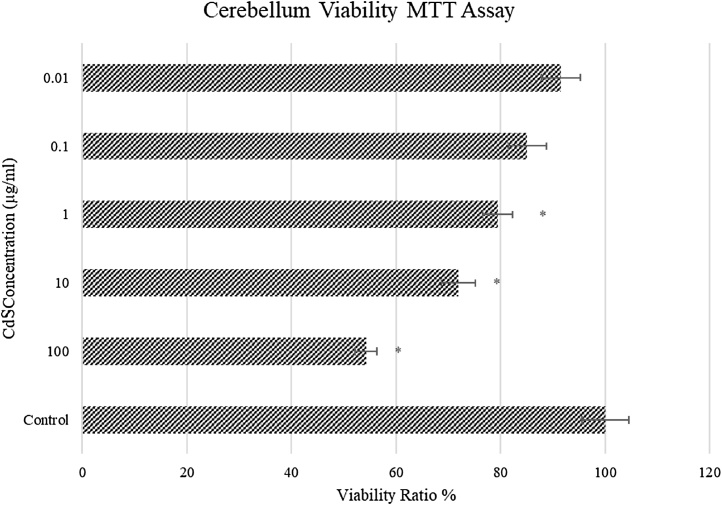
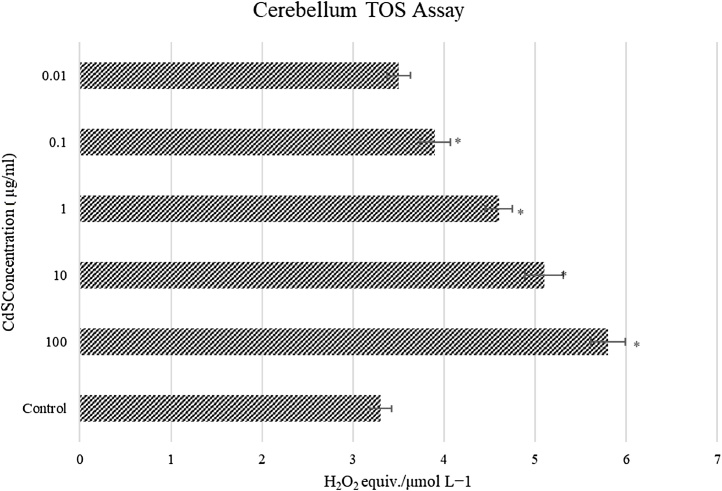
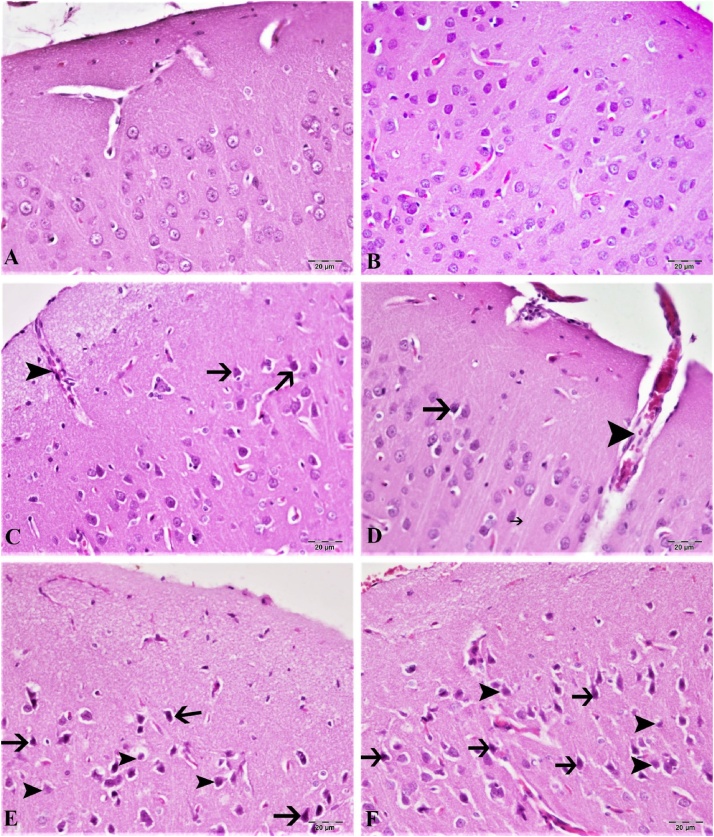
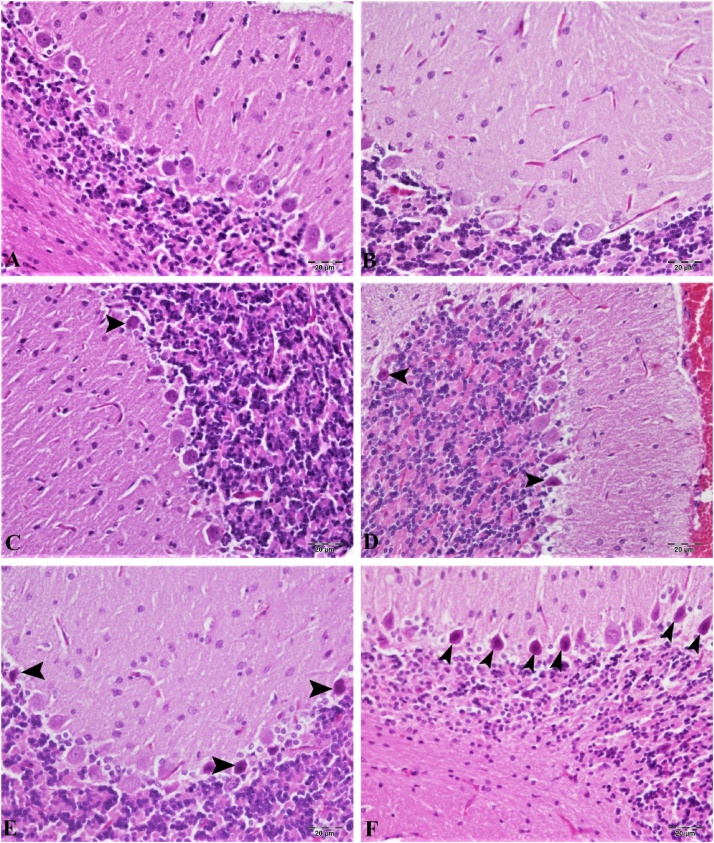
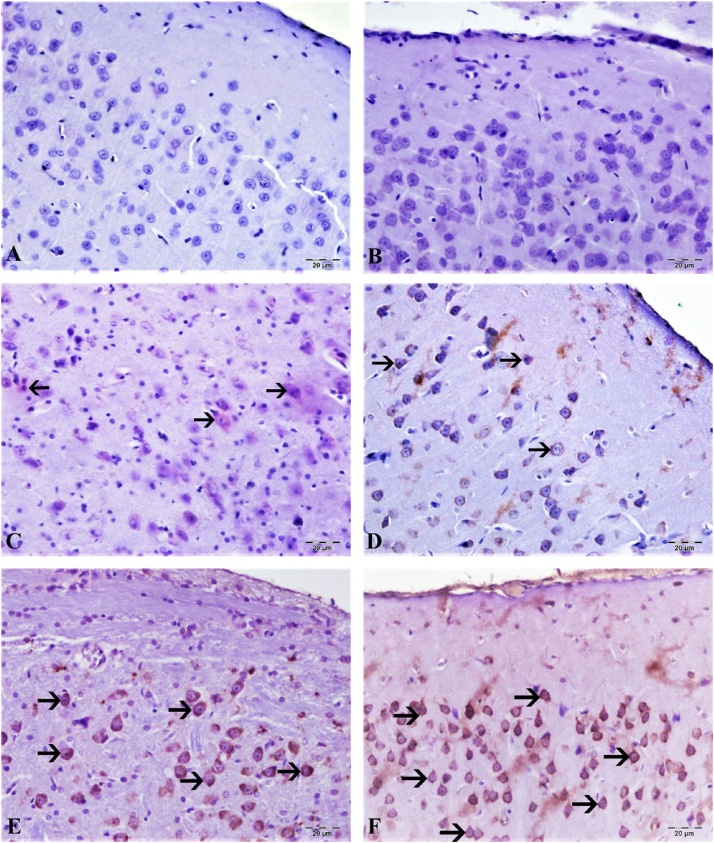
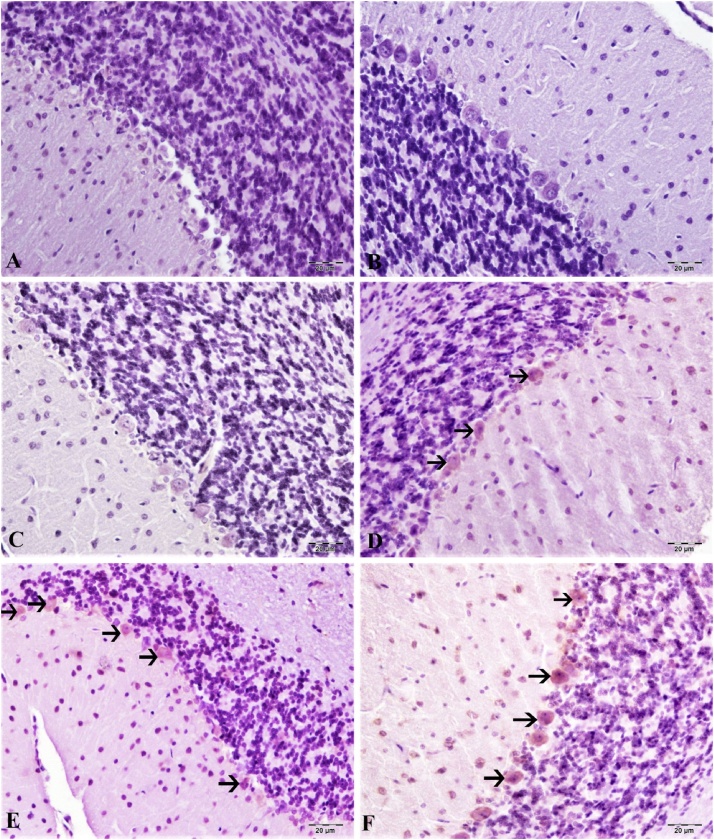
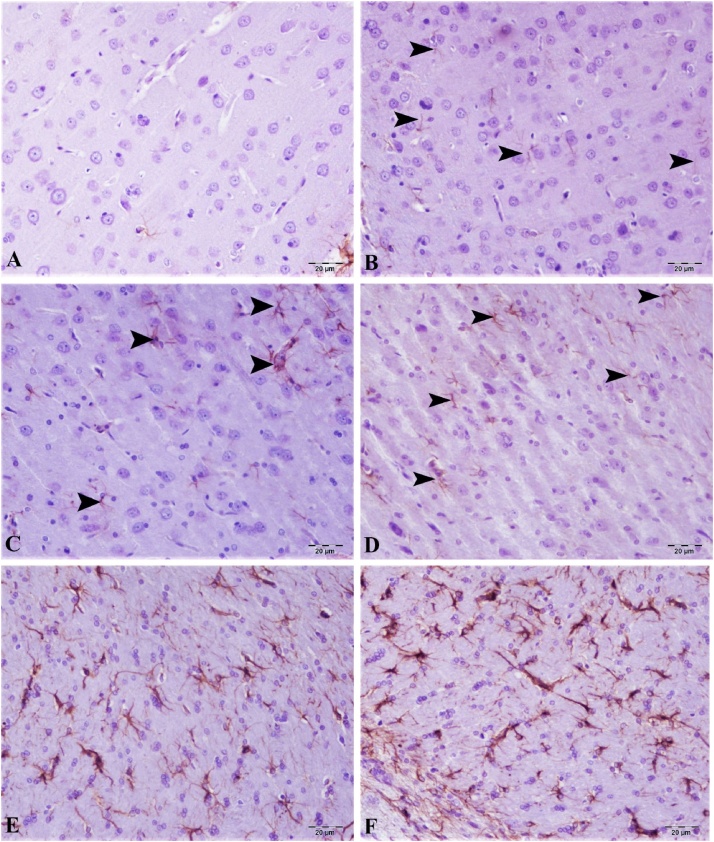
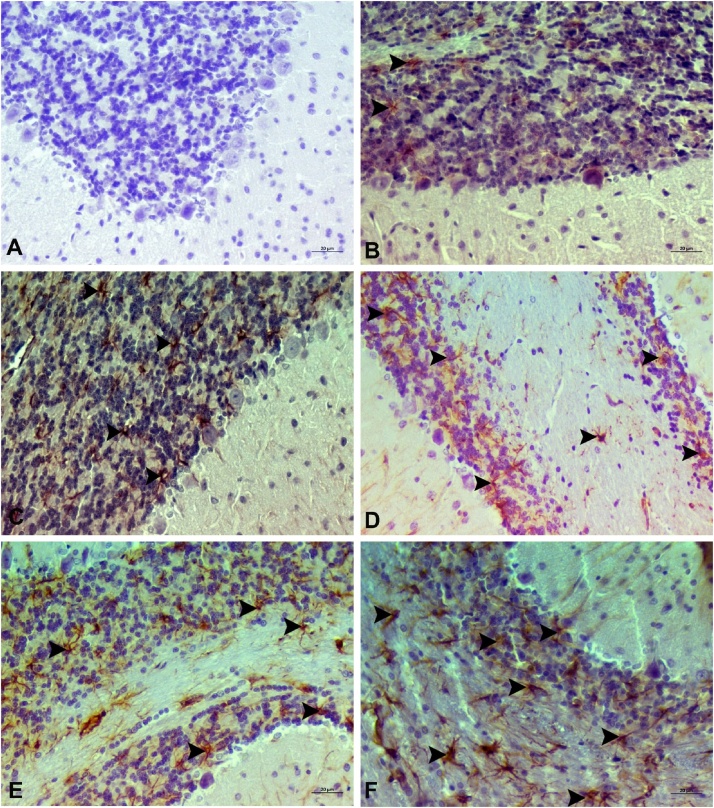
Living organisms have an innate ability to regulate the synthesis of inorganic materials, such as bones and teeth in humans. Cadmium sulfide (CdS) can be utilized as a quantum dot that functions as a unique light-emitting semiconductor nanocrystal. The increased use in CdS has led to an increased inhalation and ingestion rate of CdS by humans which requires a broader appreciation for the acute and chronic toxicity of CdS. We investigated the toxic effects of CdS on cerebellar cell cultures and rat brain. We employed a 'green synthesis' biosynthesis process to obtain biocompatible material that can be used in living organisms, such as Viridibacillus arenosi K64. Nanocrystal formation was initiated by adding CdCl2 (1 mM) to the cell cultures. Our in vitro results established that increased concentrations of CdS (0.1 μg/mL) lead to decreased cell viability as assessed using 3-[4,5-dimethylthiazole-2-yl]-2,5-diphenyltetrazolium bromide (MTT), total antioxidant capacity (TAC), and total oxidant status (TOS). The in vivo studies showed that exposure to CdS (1 mg/kg) glial fibrillary acidic protein (GFAP) and 8-hydroxy-2' -deoxyguanosine (8-OHdG) were increased. Collectively, we describe a model system that addresses the process from the synthesis to the neurotoxicity assessment for CdS both in vitro and in vivo. These data will be beneficial in establishing a more comprehensive pathway for the understanding of quantum dot-induced neurotoxicity.

Keywords: CdS; Cerebellum neuron; Green synthesis; Neurotoxicity; Quantum dots.


Conflict of interest statement

No potential conflict of interest was reported by the authors.

Figures

None
Graphical abstract
Fig. 1
Fig. 1
Harvested cell line (×10): Cerebellum neuron cells.
Fig. 2
Fig. 2
Scanning electron microscopy (SEM) images of CdS NPs shapes and sizes. (EHT = 4.00 kV).
Fig. 3
Fig. 3
EDX and elemental mapping of CdS nanoparticles. The estimated band gap value for CdS is 2.02 eV.
Fig. 4
Fig. 4
In vitro viability ratio of CdS (0.01 – 100 μg/mL) on cerebellum neuron cells (n = 6/group). * Significant differences at P < 0.05 compared to control group; ** Significant differences at P < 0.001 compared to control group.
Fig. 5
Fig. 5
In vitro TAC capacity of CdS (0.01–100 μg/mL) on cerebellum neuron cells (n = 6/group). * Significant differences at P < 0.05 compared to control group; ** Significant differences at P < 0.001 compared to control group.
Fig. 6
Fig. 6
In vitro TOS status of CdS (0.01 – 100 μg/mL) on cerebellum neuron cells (n = 6/group). * Significant differences at P < 0.05 compared to control group; ** Significant differences at P <  0.001 compared to control group.
Fig. 7
Fig. 7
Brain tissue, (A) control group, normal histological image, (B) 0.1 mg/kg group, mild hyperemia in the vessels, (C) 1 mg/kg group, hyperemia in the vessels, atrophy in very few neurons (arrow), (D) 5 mg/kg groups, severe hyperemia (arrowhead) in the veins, atrophy in the neuron (arrow), (E) 15 mg/kg groups, moderate atrophy in the neurons (arrow), degeneration and necrosis (arrowhead), hyperemia in the vessels, (F) 25 mg/kg groups, Severe hyperemia of the vessels, severe atrophy of neurons (arrow), degeneration and necrosis (arrowhead). H&E, Bar: 20 μm.
Fig. 8
Fig. 8
Cerebral tissue, (A) control group, normal histological image, (B) 0.1 mg/kg group, mild hyperemia in the veins, (C) 1 mg/kg group, atrophy in very few Purkinje cells (arrow), hyperemia in the vessels, (D) 5 mg/kg groups, atrophy in the neuron (arrow), severe hyperemia in the veins, (E) 15 mg/kg groups, moderate atrophy in the neurons (arrow), degeneration and necrosis (arrowhead), hyperemia in the vessels, (F) 25 mg/kg groups, severe hyperemia in the vessels, severe atrophy in neurons (arrow), degeneration and necrosis (arrowhead). H&E, Bar: 20 μm.
Fig. 9
Fig. 9
Brain tissue, (A) control group, 8-OHdG expression is negative, (B) 0.1 mg/kg group, 8- OHdG expression is negative, (C) 1 mg/kg group, very light neurons intracytoplasmic 8-OHdG expression (arrow), (D) 5 mg/kg groups 8 lightweight neurons, 8-OHdG expression (arrow), (E) 15 mg/kg groups, moderate intracytoplasmic expression in neurons 8-OHdG expression (arrow), (F) 25 mg/kg groups, severe intracytoplasmic 8-OHdG expression in neurons (arrow), Bar: 20 μm.
Fig. 10
Fig. 10
Cerebral tissue, (A) control group, 8-OHdG expression negative, (B) 0.1 mg/kg group, 8- OHdG expression negative, (C) 1 mg/kg group, 8-OHdG expression negative, (D) 5 mg/kg groups, mild Purkinje cells intracytoplasmic expression of 8-OHdG (arrow), (E) 15 mg/kg groups, moderately intracytoplasmic 8-OHdG expression in Purkinje cells (arrow), (F) 25 mg/kg groups, severe intracytoplasmic 8-OHdG expression in Purkinje cells (arrow), Bar: 20 μm.
Fig. 11
Fig. 11
Brain tissue, (A) control group, GFAP expression was very mild, (B) 0.1 mg/kg group, GFAP expression was very mild, (C) 1 mg/kg group, GFAP expression was mild (arrow), (D) 5 mg/kg groups, GFAP at the intermediate level, (E) 15 mg/kg groups, moderate/severe GFAP expression (arrow), (F) 25 mg/kg groups, severe GFAP expression (arrow), Bar: 20 μm.
Fig. 12
Fig. 12
Cerebellum tissue, (A) control group, GFAP expression is very mild, (B) 0,1 g, GFAP expression is very mild, (C) 1 group, GFAP expression is mild (arrowhead), (D) 5 groups, GFAP expression at intermediate level (arrowhead), (E) 15 groups, moderate/severe GFAP expression (arrowhead), (F) 25 groups, severe GFAP expression (arrowhead), H&E, Bar: 20 μm.

Similar articles

Cited by

References

    1. Engin A.B., Nikitovic D., Neagu M., Henrich-Noack P., Docea A.O., Shtilman M.I., Golokhvast K., Tsatsakis A.M. Mechanistic understanding of nanoparticles’ interactions with extracellular matrix: the cell and immune system. Part. Fibre Toxicol. 2017:14. - PMC - PubMed
    1. Taghizadehghalehjoughi A., Hacimuftuoglu A., Cetin M., Ugur A.B., Galateanu B., Mezhuev Y., Okkay U., Taspinar N., Taspinar M., Uyanik A., Gundogdu B., Mohammadzadeh M., Nalci K.A., Stivaktakis P., Tsatsakis A., Jung T.W., Jeong J.H., Abd El-Aty A.M. Effect of metformin/irinotecan-loaded poly-lactic-co-glycolic acid nanoparticles on glioblastoma: in vitro and in vivo studies. Nanomedicine. 2018;13:1595–1606. - PubMed
    1. Huang W.T., Ko Y.P., Kuo T.Y., Larsson M., Chang M.C., Jean R.D., Liu D.M. A new type of gadodiamide-conjugated amphiphilic chitosan nanoparticle and its use for MR imaging with significantly enhanced contrastability. Carbohydr. Polym. 2019;203:256–264. - PubMed
    1. Zeng Q., Shao D. The nanotoxicity investigation of optical nanoparticles to cultured cells in vitro. Toxicol. Rep. 2014;1:137–144. - PMC - PubMed
    1. Ji Y., Zhou Y. Jointed toxicity of TiO2 NPs and Cd to rice seedlings: NPs alleviated Cd toxicity and Cd promoted NPs uptake. Plant Physiol. Biochem. 2017;110:82–93. - PubMed

LinkOut - more resources