

Methods for Estimating Wet Bulb Globe Temperature From Remote and Low-Cost Data: A Comparative Study in Central Alabama
- PMID: 32490302
- PMCID: PMC7240860
- DOI: 10.1029/2019GH000231
Methods for Estimating Wet Bulb Globe Temperature From Remote and Low-Cost Data: A Comparative Study in Central Alabama
Abstract
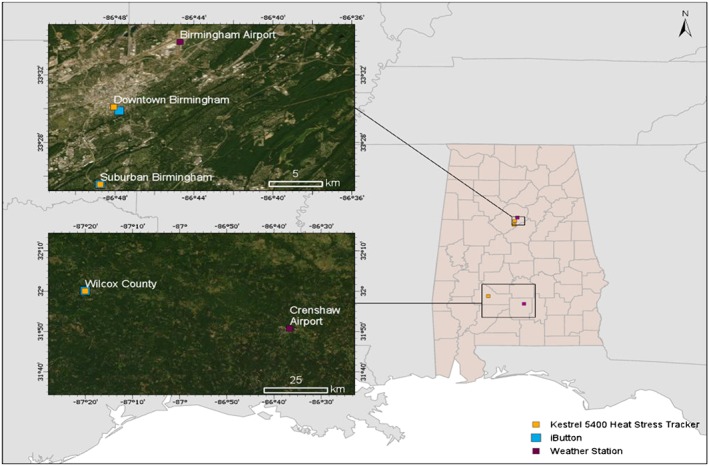
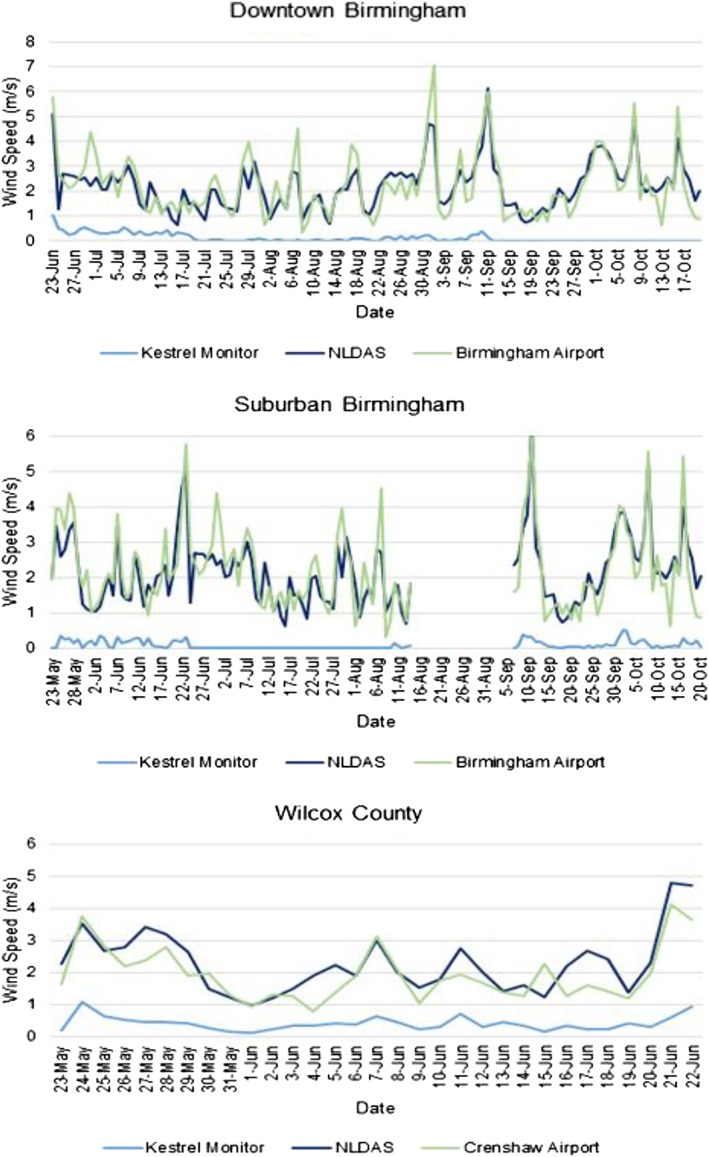
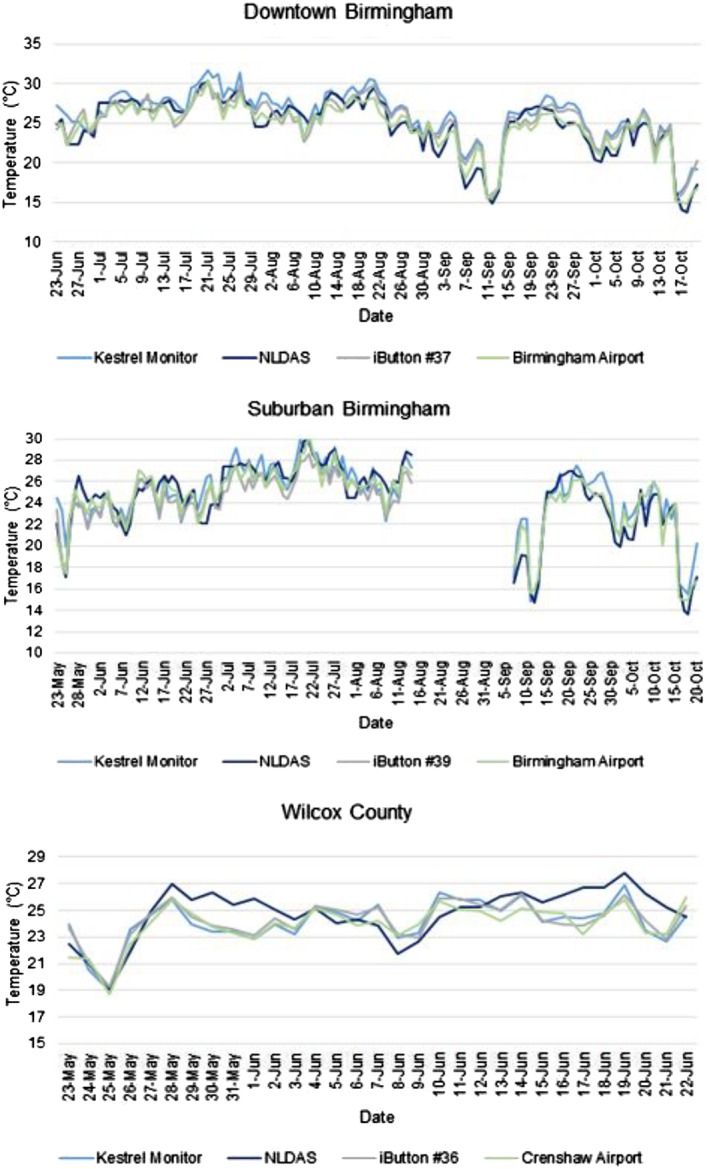
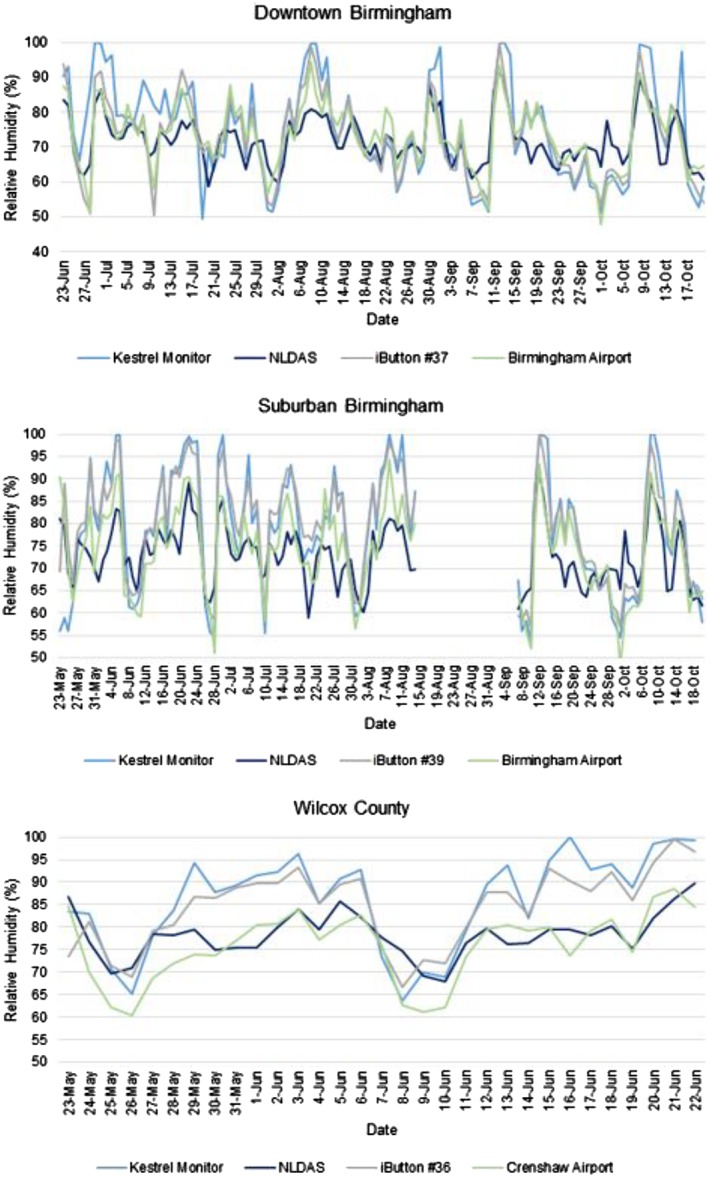
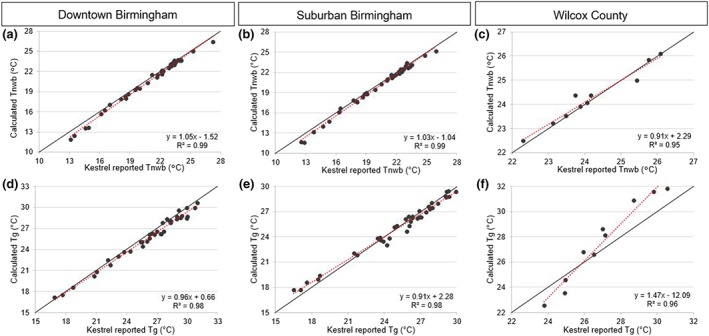
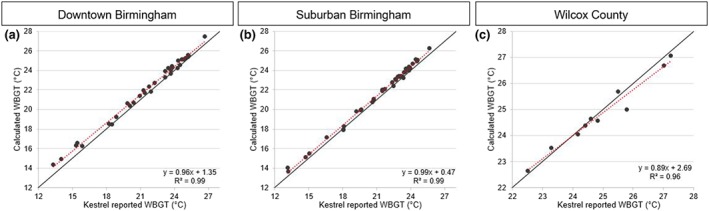
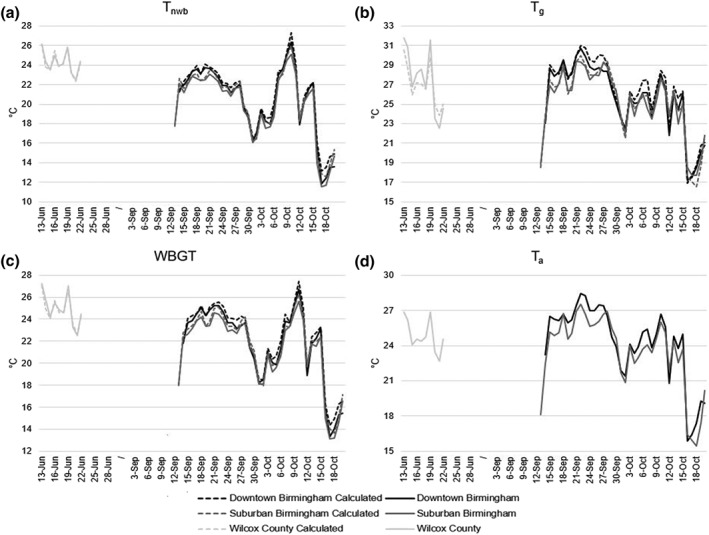
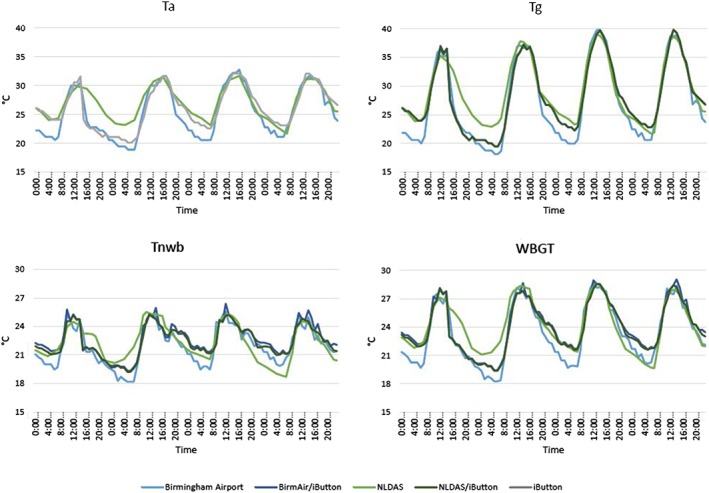
Heat stress is a significant health concern that can lead to illness, injury, and mortality. The wet bulb globe temperature (WBGT) index is one method for monitoring environmental heat risk. Generally, WBGT is estimated using a heat stress monitor that includes sensors capable of measuring ambient, wet bulb, and black globe temperature, and these measurements are combined to calculate WBGT. However, this method can be expensive, time consuming, and requires careful attention to ensure accurate and repeatable data. Therefore, researchers have attempted to use standard meteorological measurements, using single data sources as an input (e.g., weather stations) to calculate WBGT. Building on these efforts, we apply data from a variety of sources to calculate WBGT, understand the accuracy of our estimated equation, and compare the performance of different sources of input data. To do this, WBGT measurements were collected from Kestrel 5400 Heat Stress Trackers installed in three locations in Alabama. Data were also drawn from local weather stations, North American Land Data Assimilation System (NLDAS), and low cost iButton hygrometers. We applied previously published equations for estimating natural wet bulb temperature, globe temperature, and WBGT to these diverse data sources. Correlation results showed that WBGT estimates derived from all proxy data sources-weather station, weather station/iButton, NLDAS, NLDAS/iButton-were statistically indistinguishable from each other, or from the Kestrel measurements, at two of the three sites. However, at the same two sites, the addition of iButtons significantly reduced root mean square error and bias compared to other methods.
Keywords: WBGT; health; heat stress.
© 2020. The Authors.
Conflict of interest statement
The authors declare no conflicts of interest relevant to this study.
Figures
References
-
- ACGIH (American Conference of Governmental Industrial Hygienists) (2017). TLVs and BEIs Based on Documentation of Threshold Limit Values for Chemical Substances and Physical Agents & Biological Exposure Indices. Cincinnati, OH: ACGIH.
-
- Acker, J. G. , & Leptoukh, G. (2007). Online analysis enhances use of NASA earth science data. Eos, Transactions American Geophysical Union, 88(2), 14–17.
-
- Allen, R. G. , Pereira, L. S. , Raes, D. , & Smith, M. (1998). FAO Irrigation and Drainage Paper No.56 Crop Evapotranspiration. Rome, Italy: Food and agriculture Organization of the United Nations.
-
- Arguez, A. , Durre, I. , Appleguist, S. , Squires, M. , Vose, R. , Yin, X. , & Bilotta, R. (2010). NOAA's U.S. Climate Normals (1981‐2010). NOAA National Centers for environmental information. Retrieved from (25 October 2018) 10.7289/V5PN93JP - DOI
LinkOut - more resources
Full Text Sources