. 2020 May 22:22:100355.
doi: 10.1016/j.eclinm.2020.100355. eCollection 2020 May.

Cost-effectiveness analysis of pre-ART HIV drug resistance testing in Kenyan women

Affiliations

Cost-effectiveness analysis of pre-ART HIV drug resistance testing in Kenyan women

Horacio A Duarte et al. EClinicalMedicine. .

Abstract

Background: The prevalence of pre-treatment drug resistance (PDR) to non-nucleoside reverse-transcriptase inhibitor (NNRTI) agents is increasing in sub-Saharan Africa, which may decrease the effectiveness of efavirenz-based antiretroviral therapy (ART) programs. However, due to recent safety concerns, there has been hesitancy to replace efavirenz-based ART with dolutegravir in women of reproductive potential. Our objective was to evaluate whether PDR testing for women not initiating dolutegravir-based ART would be a cost-effective strategy to address the challenges posed by PDR.

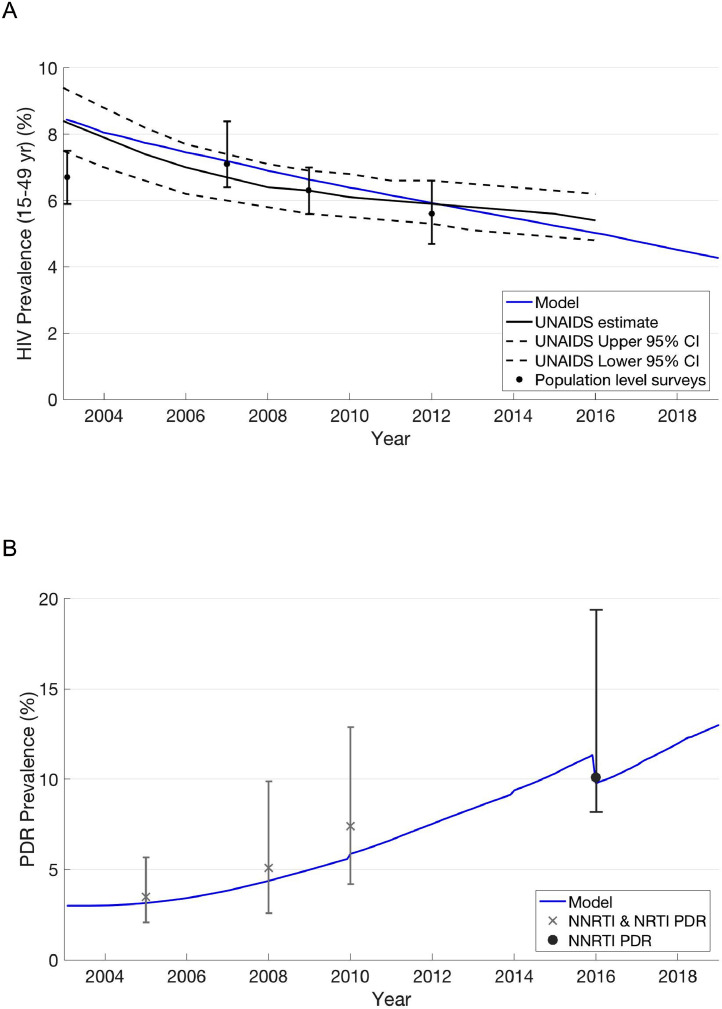
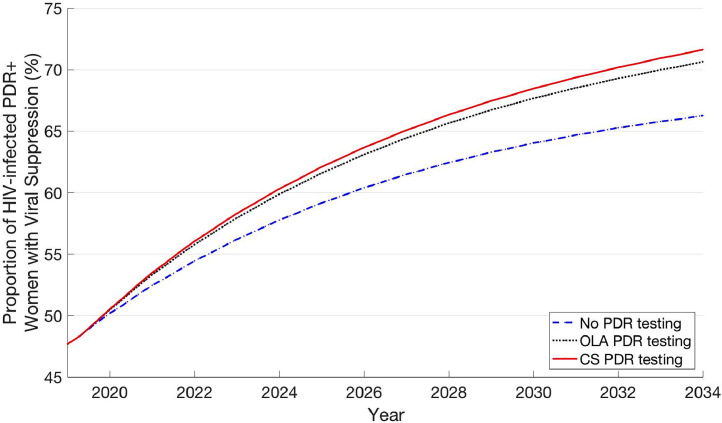
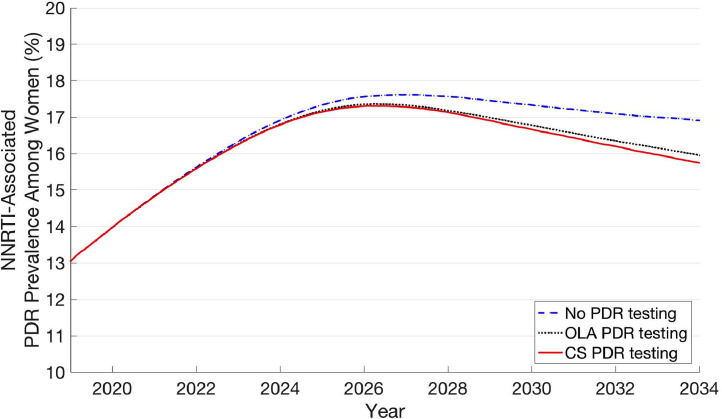
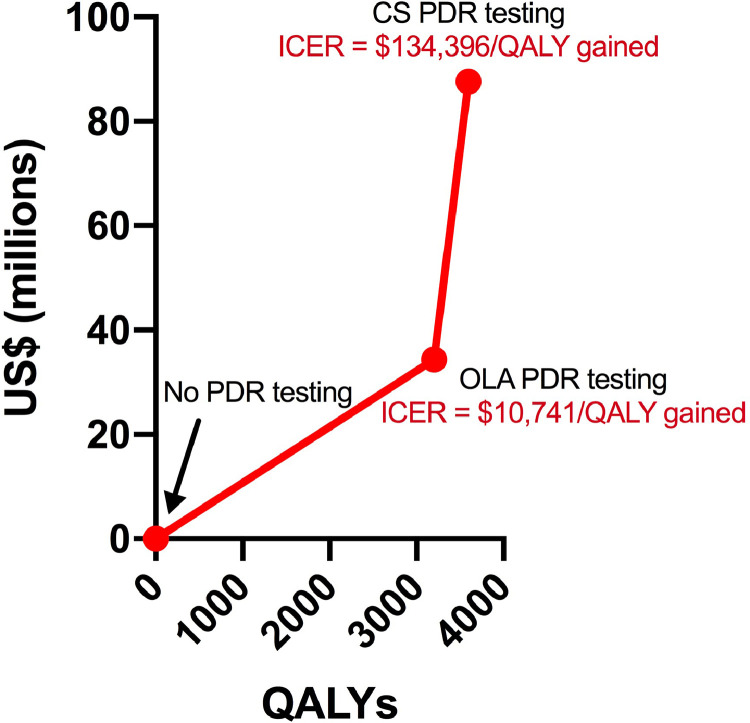
Methods: We developed an HIV drug resistance model that simulates the emergence and transmission of resistance mutations, calibrated to the Kenyan epidemic. We modeled three care strategies for PDR testing among women not initiating dolutegravir-based ART: no PDR testing, PDR testing with a low-cost point mutation assay, known as oligonucleotide ligation assay (OLA), and PDR testing with consensus sequencing. Using a health sector perspective, this model was used to evaluate the health outcomes, lifetime costs, and cost-effectiveness under each strategy over a 15-year time horizon starting in 2019.

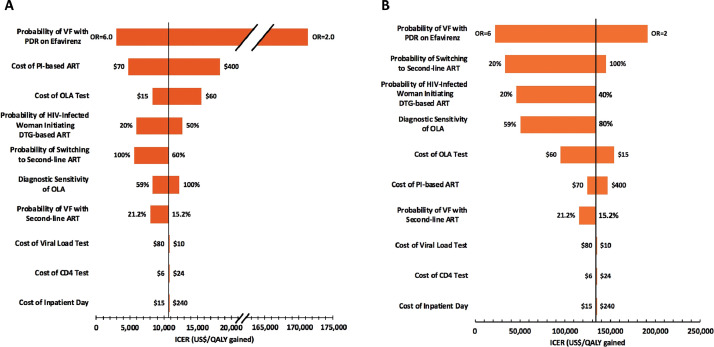
Findings: OLA and CS PDR testing were projected to have incremental cost-effectiveness ratios (ICER) of $10,741/QALY gained and $134,396/QALY gained, respectively, which are not cost-effective by national income standards. Viral suppression rates among women at 12 months after ART initiation were 87·8%, 89·0%, and 89·3% with no testing, OLA testing, and CS testing, respectively. PDR testing with OLA and CS were associated with a 0.5% and 0.6% reduction in incidence rate compared to no PDR testing. Initial PDR prevalence among women was 13.1% in 2019. By 2034, this prevalence was 17·6%, 17·4%, and 17·3% with no testing, OLA testing, and CS testing, respectively.

Interpretation: PDR testing for women is unlikely to be cost-effective in Kenya whether one uses a low-cost assay, such as OLA, or consensus sequencing.

Funding: National Institutes of Health, Gilead Sciences.

Keywords: Africa; Cost-effectiveness analysis; Dolutegravir-based ART; Drug resistance testing; Efavirenz-based ART; HIV; Pretreatment drug resistance; Resource-limited setting.


Conflict of interest statement

JBB and LGP report personal fees from Roche Molecular Systems outside the submitted work. EE reports personal fees from ViiV Healthcare outside the submitted work. RWS has received grants from Janssen Pharmaceuticals, Vela Diagnostics, and InSilixa, outside the submitted work. All other authors declare no competing interests.

Figures

Fig 1
Fig. 1
HIV and PDR prevalence trends and model output. (A) HIV Prevalence: population-level survey estimates are from the Kenya Demographic and Health Survey (2003 and 2009) and the Kenya AIDS Indicator Survey (2007 and 2012) (see Appendix for references). (B) PDR Prevalence: empirical estimates of PDR prevalence for 2005, 2008, and 2010 include NNRTI and NRTI mutations in ART-naïve individuals in East Africa . 2016 estimate includes only NNRTI mutations in both ART-naïve individuals and those reporting prior exposure to ART who are initiating first-line ART . Model estimate discontinuities in 2010, 2014, and 2016 result from ART coverage expansion and stochastic dynamics, explained in detail in Appendix Section 3C.
Fig 2
Fig. 2
Proportion of HIV-infected, PDR+ women with viral suppression over time.
Fig 3
Fig. 3
Prevalence of PDR among HIV-infected women over time.
Fig 4
Fig. 4
Incremental costs and health benefits of PDR testing strategies compared to current policy. Incremental costs and health benefits are scaled-up to the entire adult Kenyan population over a 15-year time horizon starting in 2019.
Fig 5
Fig. 5
One-way sensitivity analyses of key model parameters. (A) OLA PDR testing. ICER values are for OLA PDR testing compared to no PDR testing; the vertical bar represents the OLA PDR testing ICER from the base-case ($10,741/QALY gained). (B) CS PDR Testing. ICER values are for CS PDR testing compared to OLA PDR testing; the vertical bar represents the CS PDR testing ICER from the base-case ($134,396/QALY gained). VF = virologic failure; OR = odds ratio. Each horizontal bar represents the range of ICER values found for the specified range of values for the corresponding parameter. For each parameter, numbers to the right and left of the horizontal bar indicate the parameter value that corresponds to the high end and low end, respectively, of the ICER range that resulted from the one-way sensitivity analysis (range of values explored for each parameter value defined in Table 1). The ICERs corresponding to each of these parameter values can be found by finding the x-axis value that corresponds to the ends of each bar. In the one-way sensitivity analysis of “probability of VF with PDR on efavirenz”, the odds ratio refers to the ratio of the odds of virologic failure for those with PDR on efavirenz-based ART compared to those with either no PDR on efavirenz-based ART or those with PDR on PI-based ART (“PDR to no PDR odds ratio”). We varied the “probability of VF with PDR on efavirenz-based ART” while holding constant the “probability of VF for patients without PDR on efavirenz-based ART”. The probability of VF with PDR on efavirenz-based ART for cases with an OR equal to 2·0 and 6·0 were 23·9 and 48·6%, respectively.

References

    1. UNAIDS. UNAIDS global AIDS Update. 2016. http://www.unaids.org/en/resources/documents/2016/Global-AIDS-update-2016 (accessed 1 September 2018).
    1. Gupta R.K., Jordan M.R., Sultan B.J. Global trends in antiretroviral resistance in treatment-naive individuals with HIV after rollout of antiretroviral treatment in resource-limited settings: a global collaborative study and meta-regression analysis. Lancet. 2012;380(9849):1250–1258. - PMC - PubMed
    1. Chung M.H., Beck I.A., Dross S. Oligonucleotide ligation assay detects HIV drug resistance associated with virologic failure among antiretroviral-naive adults in Kenya. J Acquir Immune Defic Syndr. 2014;67(3):246–253. - PMC - PubMed
    1. Hamers R.L., Schuurman R., Sigaloff K.C. Effect of pretreatment HIV-1 drug resistance on immunological, virological, and drug-resistance outcomes of first-line antiretroviral treatment in sub-Saharan Africa: a multicentre cohort study. Lancet Infect Dis. 2012;12(4):307–317. - PubMed
    1. Zash R., Makhema J., Shapiro R.L. Neural-tube defects with dolutegravir treatment from the time of conception. N Engl J Med. 2018;379(10):979–981. - PMC - PubMed

LinkOut - more resources