. 2020 Aug 3;217(8):e20191920.
doi: 10.1084/jem.20191920.

Accumulation of long-chain fatty acids in the tumor microenvironment drives dysfunction in intrapancreatic CD8+ T cells

Affiliations

Accumulation of long-chain fatty acids in the tumor microenvironment drives dysfunction in intrapancreatic CD8+ T cells

Teresa Manzo et al. J Exp Med. .

Abstract

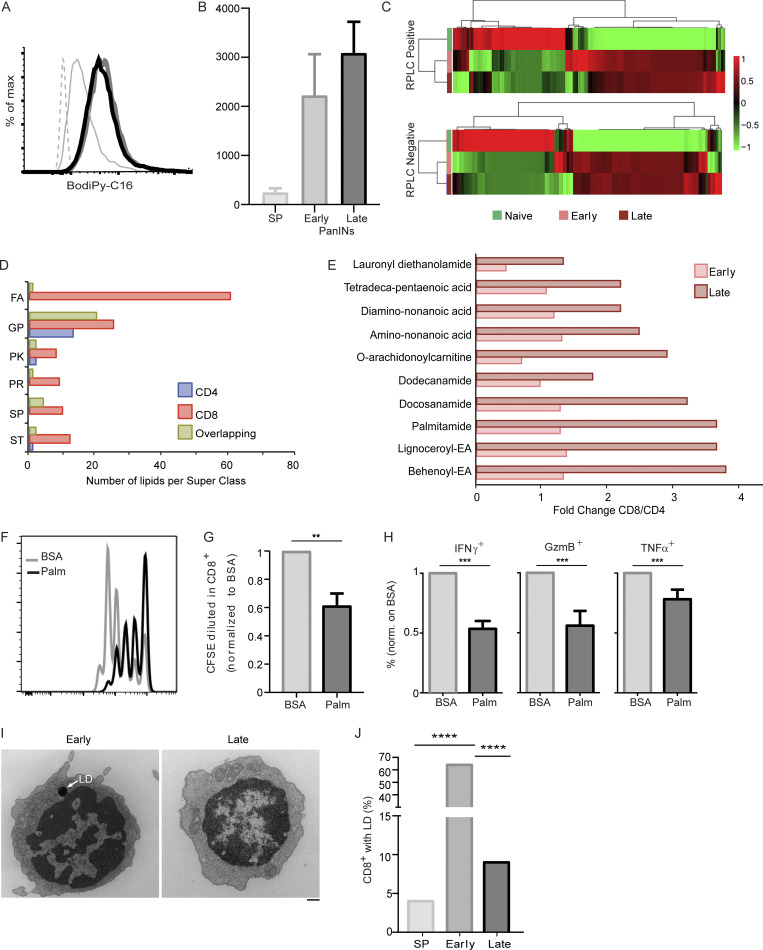
CD8+ T cells are master effectors of antitumor immunity, and their presence at tumor sites correlates with favorable outcomes. However, metabolic constraints imposed by the tumor microenvironment (TME) can dampen their ability to control tumor progression. We describe lipid accumulation in the TME areas of pancreatic ductal adenocarcinoma (PDA) populated by CD8+ T cells infiltrating both murine and human tumors. In this lipid-rich but otherwise nutrient-poor TME, access to using lipid metabolism becomes particularly valuable for sustaining cell functions. Here, we found that intrapancreatic CD8+ T cells progressively accumulate specific long-chain fatty acids (LCFAs), which, rather than provide a fuel source, impair their mitochondrial function and trigger major transcriptional reprogramming of pathways involved in lipid metabolism, with the subsequent reduction of fatty acid catabolism. In particular, intrapancreatic CD8+ T cells specifically exhibit down-regulation of the very-long-chain acyl-CoA dehydrogenase (VLCAD) enzyme, which exacerbates accumulation of LCFAs and very-long-chain fatty acids (VLCFAs) that mediate lipotoxicity. Metabolic reprogramming of tumor-specific T cells through enforced expression of ACADVL enabled enhanced intratumoral T cell survival and persistence in an engineered mouse model of PDA, overcoming one of the major hurdles to immunotherapy for PDA.


Conflict of interest statement

Disclosures: Dr. Manzo, Dr. Anderson, Dr. Bates, Dr. Greenberg, and Dr. Nezi reported a patent to US Application No. 62/756,467 pending. Dr. McLean reported a patent to US application pending. Our laboratory is a Waters Center of Innovation (Waters Corporation) and an Agilent Thought Leader laboratory. These relationships did not influence the research described in the present manuscript. Dr. Wargo reported "other" from Genentech, GlaxoSmithKline, BMS, Merck, Illumina, and personal fees from AstraZeneca outside the submitted work; in addition, Dr. Wargo had a patent to PCT/US17/53.717 issued, "MD Anderson." Dr. Greenberg reported grants from Juno Therapeutics and personal fees from Juno Therapeutics during the conduct of the study; personal fees from Rapt Therapeutics, Elpiscience, Celsius, and Nextech outside the submitted work; and had a patent to Juno Therapeutics licensed. Dr. Draetta reported personal fees from Biovelocita, Nurix, Blueprint Medicines, Frontier Medicines, Orionis Biosciences, Tessa Therapeutics, Helsinn, Forma Therapeutics, Symphogen, Alligator, Taiho Pharmaceutical Co., and FIRC Institute of Molecular Oncology outside the submitted work. No other disclosures were reported.

Figures

Figure S1.
Figure S1.
Lipids accumulate in PDA TME while glucose and H6Ps decreases during PDA progression. Related to Fig. 1. (A) Quantification by immunofluorescence of CK19+ area at indicated time points expressed as percentage over the total tissue area. Results are expressed as mean ± SE of three different areas on three independent pancreatic samples. (B) Representative images of Red Oil staining of murine early (left) and late (right) PanINs (n = 3). Red arrowheads highlight Red Oil–positive areas. Scale bar = 2 mm (left); 0.5 mm (right). (C) Quantification by immunofluorescence of neutral lipids area at indicated time points expressed as percentage of LipidTOX-positive over total tissue or tumor (CK19+) area. Results are indicative of three different areas on three independent pancreatic samples. (D) IMS workflow. Frozen pancreata were sectioned at 10-µm thickness on a gold-coated stainless steel target for IMS. IMS was performed on either a 15T or 9.4T SolariX FT-ICR mass spectrometer in positive or negative ion mode from m/z 500 to 2,000 with a 75-µm raster step, generating a mass spectrum at each pixel. The data were segmented in SCiLS through k-means clustering and a segment that best matched CD8+ staining. A mean spectrum was then generated for these segments. The peak list of each segment was searched against the LIPID MAPS database, and mean intensity values for each accurate mass lipid identification were extracted. Through a home-built script in R, data were filtered for visualization by retaining only those lipids with sufficient signal-to-noise ratios and that represented large fold changes between time points. This was done by filtering out log2(intensity) values between −1 and 1 and intensity values <0.3 of the quantile in the control group. Data were then visualized in a heatmap format sorted by head group, fatty acyl chain length, and level of fatty acyl chain unsaturation. (E) Heatmap representations of a series of PEs and PIs showing changes in lipid intensity in KC mice at early and late stages of disease compared with the pancreas of a control mouse. (F–H) Bar plots show the relative fraction of lipids of various FA chain lengths detected at the different disease time points for the indicated lipids (FAs for the three lipid types were summed). The scale for color code is above. (I) Quantification of extracellular glucose in murine early (black) and late (gray) PanINs. Free glucose was measured using a colorimetric-based assay and then normalized based on the weight of the fresh tissue. Each group includes 10 mice. Error bars represent mean ± SEM. Statistics were calculated using an unpaired two-tailed Student’s t test; *, P ≤ 0.05–0.01. (J) IMS intensity distributions on the same tissues presented in Fig. 1 A show that H6Ps (false-color rainbow images displayed without normalization) decrease moving from earlier to late time points (n = 2). Scale bar = 2 mm.
Figure 1.
Figure 1.
Neutral lipids and LC glycerophospholipids accumulate in the TME during PDA progression. (A) Spatial analysis of the pancreatic microenvironment by IMS (right panels, false-color rainbow images displayed without normalization) coregistered with consecutive tissue sections stained with H&E (left panel) at indicated time points (n = 2). Scale bar = 2 mm. (B) Spatial analysis of the pancreatic microenvironment by IMS (left panels) coregistered with CD8 T cell localization as detected by confocal imaging on consecutive tissue sections (right panels). IMS intensity distributions show that PEs with LCFAs (left panel, false-color rainbow images displayed without normalization) are colocalized with CD8+ T cells (yellow). Nuclei (blue) were stained with DAPI. Representative images (orange quadrants) are sixfold magnifications of the areas indicated in A at the respective time points (n = 2). Insets in the right panels (magenta quadrants) show CD8+ T cells at the indicated areas at fourfold magnification. Scale bar = 300 µm; inset = 70 µm. (C and D) Bar plots showing the relative fraction of lipids of various FA chain length detected at the different disease time points for PE (C) and PI (D) lipids (FAs for the two lipid types were summed together here, except for PI(38:4), which had an extreme intensity that distorted the bar plot). Dotted lines highlight differences in longer lipid species. (E and F) Quantification of IMS data for the indicated selected species inside the PE (E) and PI (F) classes. Y axes indicate intensity. The representation reflects the heterogeneity of selected lipids within each disease time point. Data are expressed as mean ± SE. Intensities for some of the species were multiplied as indicated.
Figure 2.
Figure 2.
Intrapancreatic CD8 T cells become functionally impaired during PDA progression. (A) Confocal images of formalin-fixed, paraffin-embedded murine pancreatic samples displaying CD4+ (upper panels) or CD8+ (lower panels) T cell infiltration in early (left) versus late (right) PanINs. CD4+ or CD8+ (red), aSMA (green) and E-cad (white) were detected by indirect immunofluorescence, and nuclei (blue) were stained with DAPI. Inserts show magnified views of representative subregions. Scale bar = 100 µm; insets = 25 µm. Images are representative of one experiment with three mice in each group. (B) Quantification by immunofluorescence of FoxP3+ T reg cells (blue) and CD8+ T cells (red) on pancreata from early versus late PanINs. Results are indicative of at least five different fields on three independent mice. (C) Percentages of CD8+ or CD4+ T cells inside CD3+CD45+ gate from pancreata of mice with early and late PanIN lesions (n = 25). (D) Kinetic showing infiltration of T cells in spleen (gray) and pancreata (black) at indicated time points. Numbers indicate percentages of CD3+CD45+ cells (n = 25). (E) Representative dot plots of intrapancreatic CD8+ T cells expressing the indicated exhaustion markers. WT spleen (left), early (center), and late (right) PanINs are shown. Numbers indicate percentage of CD8+ T cells that are double-positive T cells. (F) Quantification of PD1+, TIM3+ or PD1+TIM3+ T cells inside CD3+CD8+ gate from pancreata of mice with early (n = 4) and late (n = 5) PanIN lesions. (G and H) Representative histograms (G) and quantification (H) of effector functions of CD8+ T cells infiltrating early (gray, n = 8) and late (black, n = 10) PanINs assessed as IFNγ and Granzyme β production measured by ex vivo intracellular cytokine staining. Results are expressed as MFI and shown as normalized to control splenic CD8+ T cells. In all graphs, error bars represent mean ± SEM. Statistics were calculated using unpaired two-tailed Student’s t test; *, P ≤ 0.05–0.01; **, P ≤ 0.01–0.001; ***, P ≤ 0.001–0.0001.
Figure 3.
Figure 3.
Intrapancreatic CD8+ T cells accumulate VLCFAs. (A) Representative histogram of in vivo Bodipy-C16 uptake in early (bold gray line) and late (bold black line) PanINs infiltrating CD8+ T cells compared with control splenic CD8+ T cells (gray line). For fluorescence minus one (FMO control), mice were not injected with fluorescent analogous (dotted shaded line). (B) Bar graph showing the quantification of the Bodipy-C16 MFI. Data are mean of three mice per group and representative of three independent experiments. (C) Heatmap providing direct visualization of the relative levels of individual lipids. Samples (columns) are clustered by group average, and rows are colored according to relative feature abundance across different groups, ranging from low (green) to high (red). It was constructed by Metaboanalyst 4.0 software using Pearson average clustering algorithm unsupervised clustering of relative levels of individual lipids (RPLC mode indicated on the left). Color code indicated in the legend. (D) Annotation of statistically different lipid metabolic compounds detected in CD4+ (blue), CD8+ (red), and both (green) T cell types sorted from late PanINs (GP, glycerophospholipids; PK, polyketides; PR, prenols; SP, sphingolipids; ST, sterols). (E) Bar graphs showing fold changes of the indicated lipid compounds in CD8+ compared with CD4+ T cells in early (light red) and late (dark red) PanIN lesions. (F–H) T cells activated with αCD3/αCD28 with 100 µM BSA-palmitate (black) or BSA (as control, gray) for 72 h. CFSE profile (F) and bar graph showing the relative quantification of percentage of CFSE diluted cells (G) and IFNγ-, Granzyme β–, and TNFα-producing cells (H) in BSA-palmitate–treated CD8+ T cells normalized (norm.) on BSA control cells. Data are representative of 10 independent experiments. (I) Representative TEM image of LDs from CD8+ T cells infiltrating early (left) and late (right) PanINs. (J) Bar graph showing percentage of CD8+ T cells containing LDs in FACS-sorted naive (light gray bar), early (dark gray bar), and late (black bar) T cells as determined by TEM analysis. Data are representative of one experiment with ≥100 cells counted in each experimental condition. In all graphs, error bars represent mean ± SEM. Statistics were calculated using a two-tailed Student’s t test; *, P ≤ 0.05–0.01; **, P ≤ 0.01–0.001; ***, P ≤ 0.001–0.0001; ****, P ≤ 0.0001.
Figure S2.
Figure S2.
VLCFA accumulation in intrapancreatic CD8+ T cells. Related to Fig. 3. (A) Bar graph shows the quantification of the 2-NBDG used to monitor in vivo glucose uptake in early (gray bar, n = 6) and late (black bar, n = 8) PanINs infiltrating CD8+ T cells compared with control splenic CD8+ T cells (white bar, n = 9). Numbers indicate the MFI. (B) CD36 expression in early (gray bar, n = 13) and late (black bar, n = 9) PanINs infiltrating CD8+ T cells compared with control splenic CD8+ T cells (white bar, n = 9). Numbers indicate percentages of CD36+ cells inside the CD3+CD8+ gate. (C) Bar graph showing the quantification of the Bodipy-C16 in CD4+, CD8+, CD45+CD3 cells infiltrating early (gray bar, n = 3) and late (black bar, n = 9) PanINs compared with relative control splenic populations (white bar, n = 9). Numbers indicate MFI. (D) Supervised PCA (partial least squares discriminant analysis) plots from liquid chromatography–MS performed on intrapancreatic CD8+ and CD4+ T cells flow-sorted from early (n = 3) and late (n = 3) PanINs. Naive T cells were used as control (n = 3). Results from RPLC-positive (upper) and negative (bottom) mode are represented. Partial least squares discriminant analysis plots (univariate scaling, performed in EZ Info from data generated in Progenesis QI v2) use abundance levels for all metabolite species within a sample across to determine the principal axes of abundance variation. Presenting the abundance data in PC space allows us to distinguish different metabolic profiles between the three sample groups. (E and F) Volcano plot representing changes of detected compounds in early versus late PanINs in intrapancreatic CD8+ (E) and CD4+ (F) T cells. Numbers of peaks that met significant criteria (P ≤ 0.05, fold change ≥|2|) are indicated. Total number of compounds detected: 1,157 (RPLC-positive mode) and 1,302 (RPLC-negative mode). (G) Statistically different lipid metabolic compounds detected in CD8+ T cells over the time course of disease progression, suggesting a general increase of lipids (at the superclass level), and in particular FAs. The positive and negative data were coupled together and filtered by significance criteria, and redundancy was removed from the compound identification (m/z_RT) and from the chemical formula to narrow down to one lipid compound (level 3) identification. See legend for color code. (H–J) T cells activated with αCD3/αCD28 with 100 µM hexanoic (H, black; n = 5) or BSA-linoleic acid (I and J, black; n = 10) or BSA (as control, gray) for 72 h. Data were normalized on BSA. (I and J) Carboxyfluorescein succinimidyl ester profile (I) and bar graphs (H and J) showing percentages of effector cytokines in Lino-treated (J) or hexanoic acid–treated (H) CD8+ T cells normalized on BSA control cells. (K) Representative images of CD8+ T cells treated with BSA-linoleic (right) or BSA-palmitic (left). After cytospin, cells were stained with Red Oil to highlight neutral lipids. Red arrowheads indicate LDs. Scale bar = 100 μm. (L) Quantification of neutral lipids by LipidTOX staining on CD8+ T cells treated with BSA-linoleic (right) or BSA-palmitic (left). BSA-treated cells were used as controls. Results are indicative of three independent experiments with a total of eight different mice. (M) Quantification by LipidTOX immunofluorescence of neutral lipids at indicated time points expressed as percentage of CD8+ T cells that contain at least one LD. Results are indicative of three different areas on three independent pancreatic samples. Scale bar = 20 µm. In all graphs, error bars represent mean ± SEM. Statistic was calculated using a two-tailed Student’s t test; **, P ≤ 0.01–0.001; ***, P ≤ 0.001–0.0001; ns, not significant.
Figure 4.
Figure 4.
Intrapancreatic CD8+ T cells are metabolically exhausted in the lipid-rich PDA TME. (A and B) Representative histogram of MitoTracker Orange CMTMRos performed on αCD3/αCD28 activated CD8+ T cells in the presence of palmitic (A, n = 15) or linoleic (B, n = 15) acid. Control BSA-treated cells are indicated in gray (n = 15). Dotted light gray line represents fluorescence minus one (FMO control). (C) TEM of CD8+ and CD4+ T cells FACS sorted from spleen or early and late PanIN lesions. Representative image of TEM on CD8+ T cells from the indicated organ and time points. Inserts show magnification of representative normal (a), swollen (b), and hypercondensed (c) mitochondria. (D) Pie chart showing the results of mitochondrial morphometric analysis of CD4+ and CD8+ T cells from spleen and early and late PanIN lesions. Grading from normal (white) to swollen (gray) and hypercondensed (black) follows worsening of abnormalities (see Materials and methods for details). Numbers indicate percentages of the relative grading per cell. Data are from one experiment with ≥50 cells per group. (E and F) Bar graphs showing quantification of MitoTracker Green (E, n = 7) and MitoTracker Orange CMTMRos (F, n = 17) from CD8+ (red) or CD4+ (blue) T cells infiltrating late PanINs. Numbers indicate MFI. (G and H) Bar graphs showing mitochondrial staining in BodiPy-C16+ (G) or LipidTOX+ (H) on CD8+ T cells activated in the presence of palmitic (n = 8) or linoleic (n = 8) acid. Results show Mitotracker MFI normalized on BSA-treated cells used as a control (n = 8). (I) Representative overlay of dot plot for CD8+ (red) and CD4+ (blue) T cells showing in vivo BodiPy-C16 uptake and mitochondrial function measurements. (J) Bar graphs show percentages of BodiPy-C16–positive and MitoTracker Orange CMTMRos–negative cells gated on CD8+ (red) and CD4+ (blue) T cells or CD45+/CD3 (gray) cells from late PanINs (n = 6). (K–M) Real-time analysis of OXPHOS (L) and quantification of OCR (K) and ratio of OCR to ECAR in T cells (M) on CD8+ (red) and CD4+ (blue) T cells sorted from early (n = 3) and late (n = 3) PanINs measured in a Seahorse extracellular flux analyzer. Naive and T cells activated for 48 h with αCD3/αCD28 antibodies are included as control (n = 8, green and gray bars, respectively). In all graphs, error bars represent mean ± SEM. Statistics were calculated using a two-tailed Student’s t test; *, P ≤ 0.05–0.01; **, P ≤ 0.01–0.001; ***, P ≤ 0.001–0.0001; ns, not significant.
Figure S3.
Figure S3.
Intrapancreatic CD8+ T cells from early and late lesions are transcriptionally distinct. Related to Fig. 5. (A) PCA of the transcriptome of intrapancreatic CD8+ T cells flow sorted from WT or KC mice at indicated ages (n = 3, see color code in the figure). (B) Gene ontology analysis was performed against the Molecular Signatures Database, using Investigate Gene Sets web program under GSEA. Prediction of activated (UP, red) or inactivated (DOWN, blue) signatures are indicated for early (pink) and late (brown) PanINs. Scale indicates P values. (C) Nonsupervised hierarchical clustering of the entire dataset (n = 84) to display a heatmap with dendrograms indicating coregulated genes across the indicated groups (n = 2). Green, minimal expression; black, average expression; red, maximal expression. (D) Scatter plots comparing the normalized expression of every gene on the array between the two indicated groups. The central line indicates unchanged gene expression, and the dotted lines indicate the fold regulation threshold (1.3). Data points beyond dotted lines in the upper left (yellow) and lower right (blue) sections meet the selected fold regulation threshold. (E) ACADVL expression expressed as ΔCt across the different indicated groups.
Figure 5.
Figure 5.
ACADVL deficiency in CD8+ T cells infiltrating late PanINs. (A) Unsupervised clustering analysis of the transcriptome of intrapancreatic CD8+ T cells flow sorted from WT or KC mice at indicated ages (n = 3; see legend for color code). Top 3,000 most variable genes were used to plot the heatmap. (B) Volcano plot showing genes differentially regulated in CD8+ T cells infiltrating late versus early PanINs. Significantly differentially regulated genes related to lipid (red), mitochondria (blue), and peroxisomes/ER stress (magenta) are highlighted. Comparison between 30- and 13-wk samples; with absolute log2 fold change > 1 and false discovery rate (FDR) < 0.05. (C and D) Representative confocal images of multicolor immunofluorescence staining displaying ACADVL expression in CD8+ (C) or CD4+ (D) T cells infiltrating early (left panels) versus late (right panels) PanINs. ACADVL is in green, CD8+ and CD4+ T cells in red; nuclei (blue) were stained with DAPI. Scale bar = 100 µm; insets = 20 µm. (E) ACADVL expression quantification shown as arbitrary fluorescence unit (AFU). Each dot represents one cell, and the expression level of ≥50 cells per condition were quantified on three independent samples using a built-in NIS Element tool. Error bars represent mean ± SEM. Statistics were calculated using a two-tailed Student’s t test; ***, P ≤ 0.001–0.0001.
Figure 6.
Figure 6.
Tumor-specific T cells engineered to express ACADVL are empowered with a better metabolic fitness. (A) Design of TCR1045 and ACADVL-TCR1045 constructs. (B) Bar graphs show quantification of VLCAD enzymatic activity from TCR1045 and ACADVL-TCR1045 T cells sorted on live, CD8+ Thy1.1+ Vβ9+ T cells (n = 8). (C and D) Representative histogram (C) and bar graphs (D) showing quantification of MitoTracker Orange staining in TCR1045 and ACADVL-TCR1045 T cells. Data are mean of four independent experiments. (E and F) Basal OCR (E) and spare respiratory capacity (the difference between maximal OCR and basal OCR rates, F) were evaluated using Seahorse analysis of TCR1045 and ACADVL-TCR1045 T cells. The data represent analysis of the results of four experiments using a two-tailed Student’s t test. (G) Cotransfer schema. Equal numbers of live CD8+ Vβ9+ TCR1045 and ACADVL-TCR1045 T cells were sorted and transferred into KPC recipient mice harboring at least one pancreatic tumor detectable as 2–5 mm3 in diameter (measured by ultrasound). (H) Ratio of ACADVL-TCR1045 to TCR1045 CD8+ T cell numbers pretransfer (day 0) and isolated from KPC tumors 10 and 21 d after transfer. Proportions of cotransferred TCR1045 T (red) and ACADVL-TCR1045 T cells (blue) 21 d after transfer in the tumor, gated on live CD8+ Thy1.1+ cells. Data are from four independent experiments (n = 4 mice per group). In all graphs, error bars represent mean ± SEM. Statistics were calculated using a two-tailed Student’s t test; *, P ≤ 0.05–0.01; **, P ≤ 0.01–0.001; ***, P ≤ 0.001–0.0001; ****, P ≤ 0.0001.
Figure S4.
Figure S4.
ACADVL overexpression confers enhanced metabolic fitness. Related to Fig. 6. (A) Transduction efficiency, gated on live CD8+ Thy1.1+. (B) Expression of the indicated activation receptors on transduced cells, gated on live CD8+ Thy1.1+ Vβ9+ cells. The gray histogram represents naive P14 staining, the red histogram represents TCR1045-transduced T cells, and the blue histogram represents ACADVL-TCR1045 transduced T cells. Data are representative of three independent experiments. (C) Production of IFNγ and TNFα by TCR1045 T (red) and ACADVL-TCR1045 T cells (blue) 7 d after activation and transduction, stimulated with Msln406–414 peptide for 5 h. (D) Proportions of cotransferred TCR1045 T (red) and ACADVL-TCR1045 T cells (blue) before and after transfer (day 21) in tumor, blood, or spleen, gated on live CD8+ Thy1.1+ cells. Plots are representative of four independent experiments. (E) Inhibitory receptor expression on engineered cells isolated from tumor at day 10, gated on live CD8+ Thy1.1+ Vβ9+ cells. The gray histogram represents naive P14 staining, and the blue histogram represents ACADVL-TCR1,045–transduced T cells. (F) Ex vivo production of IFNγ and TNFα by TCR1045 T (red) and ACADVL-TCR1045 T cells (blue) isolated from the spleen (SP) or tumor (tum) 10 d after transfer and stimulated for 5 h with Msln406–414 peptide. Data are representative of four independent experiments. In all graphs, error bars represent mean ± SEM. Statistic was calculated using a two-tailed Student’s t test; ns, not significant.
Figure S5.
Figure S5.
Lipid accumulation and ACADVL dysfunction in human CD8+ T cells infiltrating PDA. Related to Fig. 7. (A) Representative images of Red Oil staining of seven matched human PDA and normal adjacent tissue. Bar = 100 µm. (B) Bar plots showing the relative fraction of lipids of various FA chain lengths detected at the different disease time points for phosphatidylserine (upper), PC (center), and sphingomyelins (lower; FAs for the three lipid types were summed). (C) t-Distributed stochastic neighbor embedding (tSNE) plot of intrapancreatic CD8+ (red) and CD4+ (blue) T cells from human PDA samples (dark color, n = 4) and adjacent normal tissues (light color, n = 4). (D) Unsupervised clustering analysis of the single-cell transcriptome of human intrapancreatic CD8+ T cells from human PDA samples (dark red, n = 4) and adjacent normal tissues (light red, n = 4) showing how intratumoral CD8+ T cells cluster together. Each column represents a cell. (E) Box-and-whiskers plot representing ACADVL expression in human intrapancreatic CD8+ (red) and CD4+ (blue) T cells from human PDA samples (dark colors, n = 4) and adjacent normal tissues (colors, n = 4). Only actual values from cells expressing the gene are included. Permutation test from median differences highlights significant differences between CD8+ groups (P = 0.00033) but not for CD4+ groups (P = 0.347). (F) Exhaustion score based on previously published transcriptomic signature (Wherry et al., 2007). Wilcoxon test for tumor versus normal comparison: P = 0.00028 for CD8+ T cells and P = 0.6422 for CD4+ T cells.
Figure 7.
Figure 7.
Lipid accumulation and ACADVL dysfunction in human CD8+ T cells infiltrating PDA. (A) H&E staining (left panel) and intensity distribution of a representative m/z species by IMS (right panel) in seven matched human PDA (T) and normal adjacent tissue (N). N tissue from patient 3 was not available. Scale bar = 2 mm. (B) Bar plots showing the relative fraction of lipids of various FA chain length detected at the different disease time points for PE (upper) and PI (lower) lipids (FAs for the two lipid types were summed). (C) First two principal components of the transcriptome of intrapancreatic CD8+ T cells from human PDA samples (dark red, n = 4) and adjacent normal tissues (light red, n = 4). (D) Volcano plot of differentially expressed genes in human PDA samples (dark red, n = 4) and adjacent normal tissues (light red, n = 4); P < 0.005. (E and F) Representative imaging (E) of immunofluorescence staining of pancreatic disease spectrum tissue array using fluorophore-conjugated specific antibodies targeting human CD8 (red), CD3 (green), and ACADVL (white). Nuclei were stained with DAPI (blue). The TMA included 84 cores of PDA and 44 of chronic pancreatitis. Scale bar = 100 µm; insets = 50 µm. (F) Quantification of ACADVL expression as absolute fluorescence unit (AFU) in segmented human CD8+ T cells infiltrating PDA versus chronic pancreatitis. Egrror bars represent mean ± SEM. Statistics were calculated using unpaired Student’s t test; *, P ≤ 0.05–0.01.

References

    1. Angelin A., Gil-de-Gómez L., Dahiya S., Jiao J., Guo L., Levine M.H., Wang Z., Quinn W.J. III, Kopinski P.K., Wang L., et al. . 2017. Foxp3 Reprograms T Cell Metabolism to Function in Low-Glucose, High-Lactate Environments. Cell Metab. 25:1282–1293.e7. 10.1016/j.cmet.2016.12.018 - DOI - PMC - PubMed
    1. Aon M.A., and Camara A.K.. 2015. Mitochondria: hubs of cellular signaling, energetics and redox balance. A rich, vibrant, and diverse landscape of mitochondrial research. Front. Physiol. 6:94 10.3389/fphys.2015.00094 - DOI - PMC - PubMed
    1. Aon M.A., Bhatt N., and Cortassa S.C.. 2014. Mitochondrial and cellular mechanisms for managing lipid excess. Front. Physiol. 5:282 10.3389/fphys.2014.00282 - DOI - PMC - PubMed
    1. Bailey P., Chang D.K., Nones K., Johns A.L., Patch A.M., Gingras M.C., Miller D.K., Christ A.N., Bruxner T.J., Quinn M.C., et al. ; Australian Pancreatic Cancer Genome Initiative . 2016. Genomic analyses identify molecular subtypes of pancreatic cancer. Nature. 531:47–52. 10.1038/nature16965 - DOI - PubMed
    1. Beatty G.L., and Moon E.K.. 2014. Chimeric antigen receptor T cells are vulnerable to immunosuppressive mechanisms present within the tumor microenvironment. OncoImmunology. 3 e970027 10.4161/21624011.2014.970027 - DOI - PMC - PubMed

Publication types

MeSH terms