. 2020 Sep;201(3):328-340.
doi: 10.1111/cei.13473. Epub 2020 Jul 6.

Cladribine modifies functional properties of microglia

Affiliations

Cladribine modifies functional properties of microglia

L Ø Jørgensen et al. Clin Exp Immunol. 2020 Sep.

Abstract

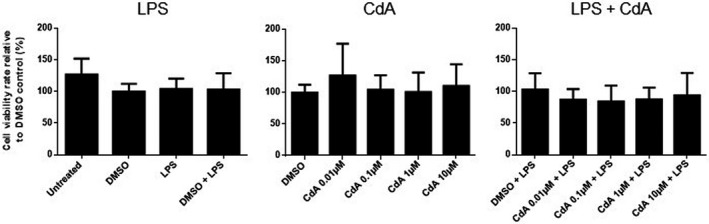
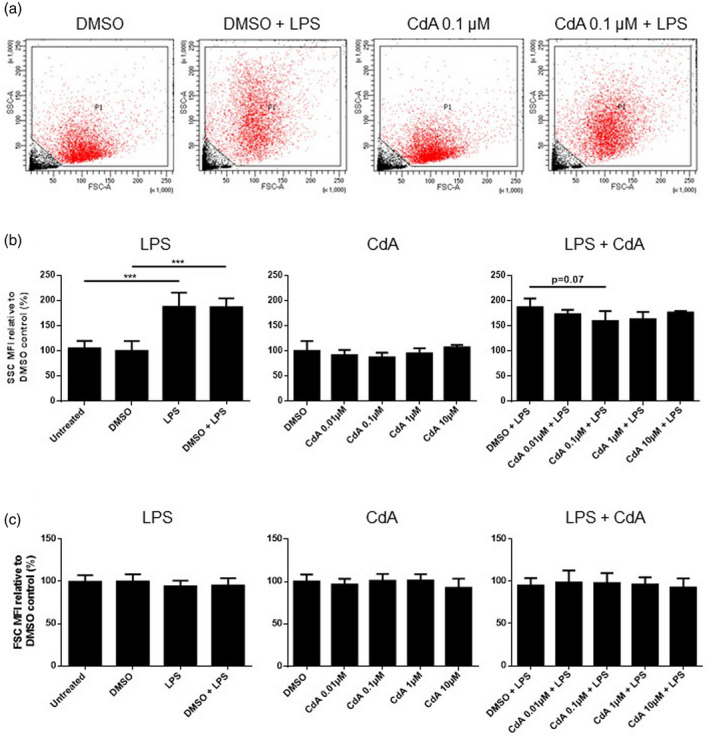
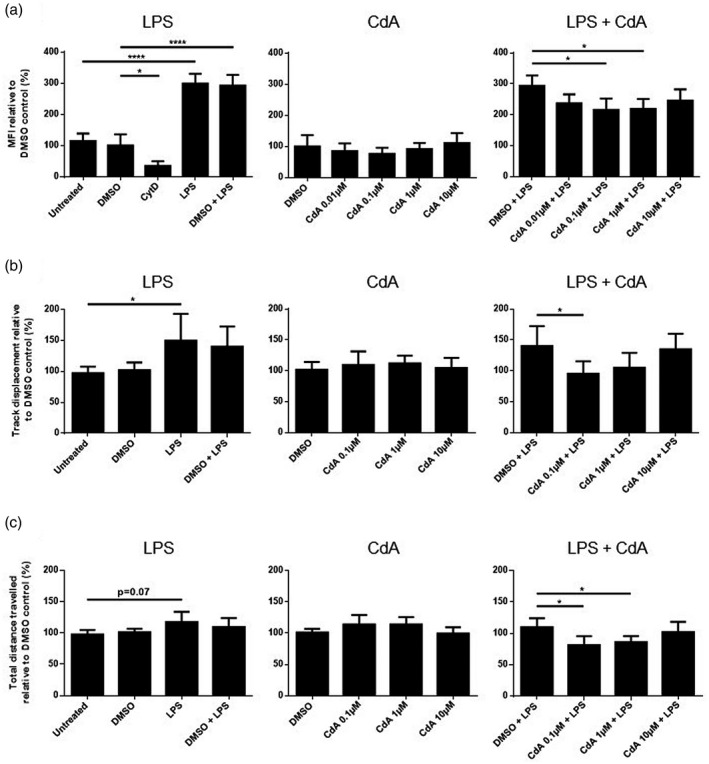
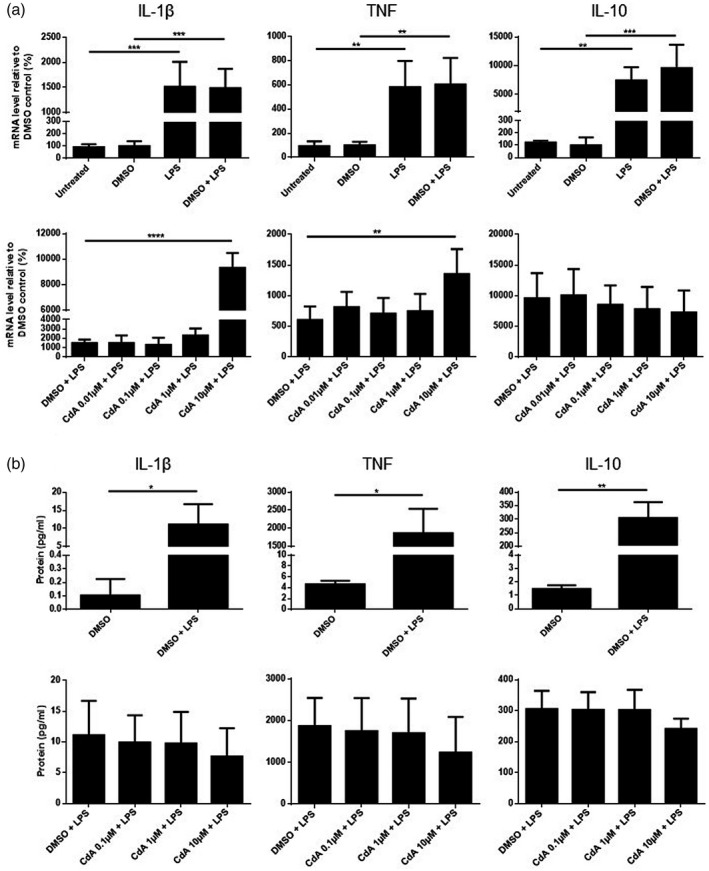
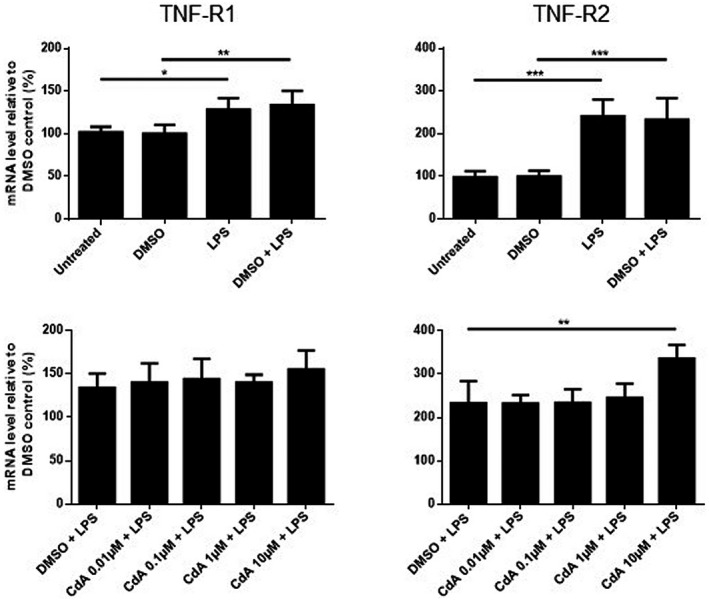
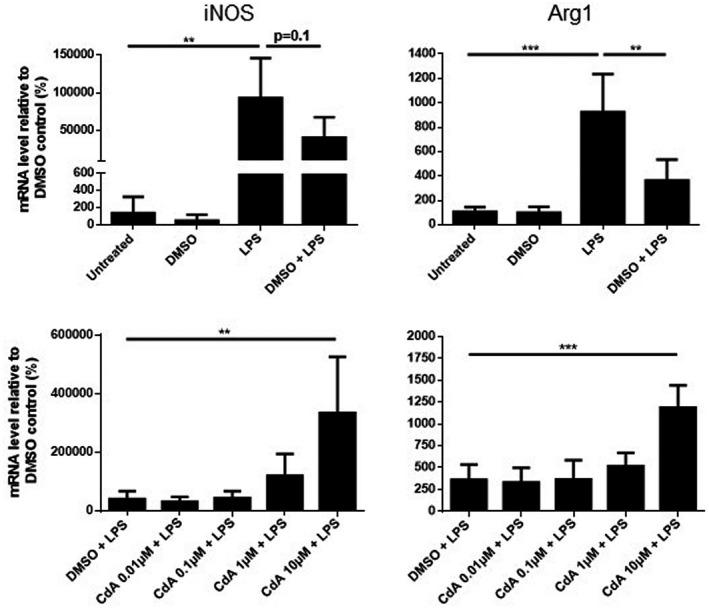
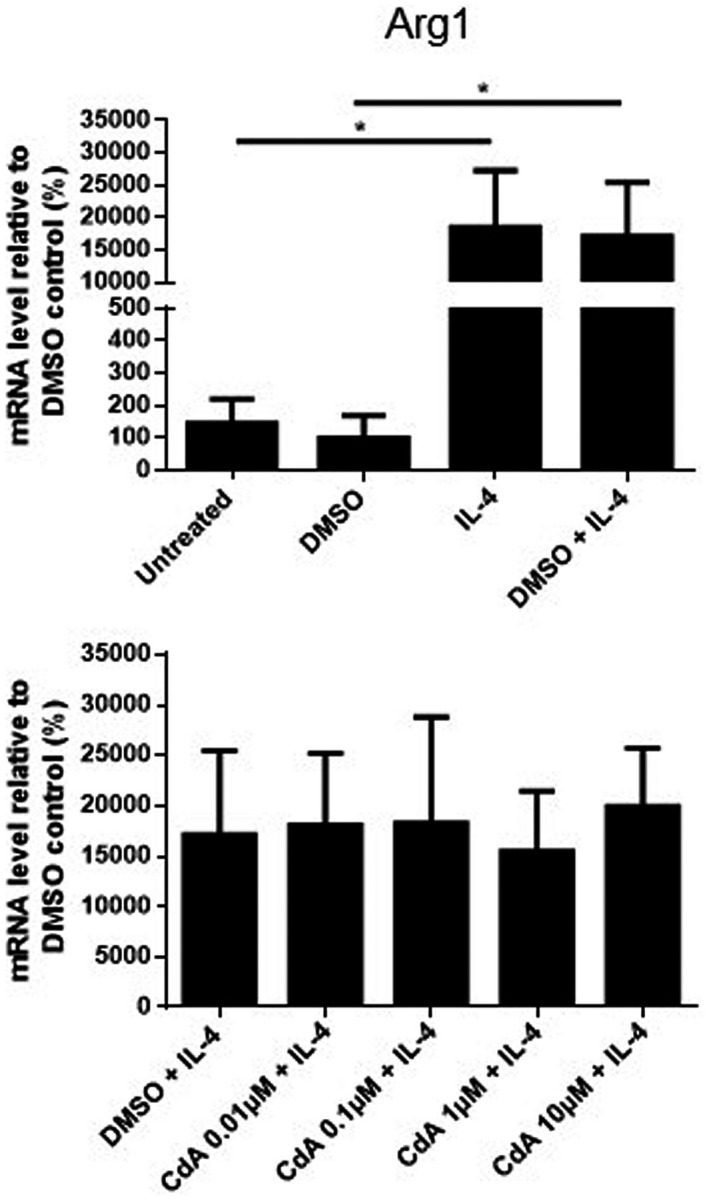
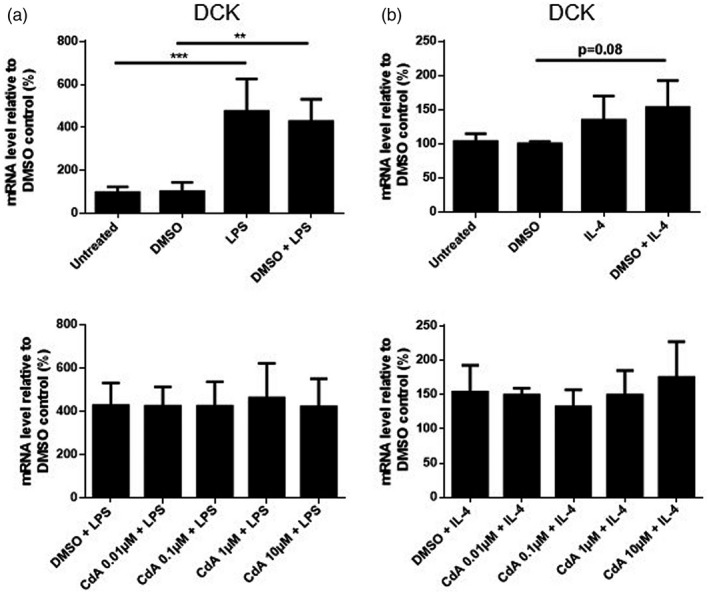
Cladribine (CdA), an oral prodrug approved for the treatment of relapsing multiple sclerosis, selectively depletes lymphocytes. CdA passes the blood-brain barrier, suggesting a potential effect on central nervous system (CNS) resident cells. We examined if CdA modifies the phenotype and function of naive and activated primary mouse microglia, when applied in the concentrations 0·1-1 μM that putatively overlap human cerebrospinal fluid (CSF) concentrations. Primary microglia cultures without stimulation or in the presence of proinflammatory lipopolysaccharide (LPS) or anti-inflammatory interleukin (IL)-4 were treated with different concentrations of CdA for 24 h. Viability was assessed by MTT [3-(4,5-dimethylthiazol-2-yl)-2,5-diphenyltetrazolium bromide] assay. Phagocytotic ability and morphology were examined by flow cytometry and random migration using IncuCyte Zoom and TrackMate. Change in gene expression was examined by quantitative polymerase chain reaction (qPCR) and protein secretion by Meso Scale Discovery. We found that LPS and IL-4 up-regulated deoxycytidine kinase (DCK) expression. Only activated microglia were affected by CdA, and this was unrelated to viability. CdA 0·1-1 μM significantly reduced granularity, phagocytotic ability and random migration of activated microglia. CdA 10 μM increased the IL-4-induced gene expression of arginase 1 (Arg1) and LPS-induced expression of IL-1β, tumor necrosis factor (TNF), inducible nitric oxide synthase (iNOS) and Arg1, but protein secretion remained unaffected. CdA 10 μM potentiated the increased expression of anti-inflammatory TNF receptor 2 (TNF-R2) but not TNF-R1 induced by LPS. This suggests that microglia acquire a less activated phenotype when treated with 0·1-1 μM CdA that putatively overlaps human CSF concentrations. This may be related to the up-regulated gene expression of DCK upon activation, and suggests a potential alternative mechanism of CdA with direct effect on CNS resident cells.

Keywords: cladribine; deoxycytidine kinase; microglia; migration; multiple sclerosis; phagocytosis; viability.


Conflict of interest statement

L. Ø. J. received support for congress participation from Merck. M. L. E. received a speaker fee from Merck. A. E. P. was affiliated with Merck during conductance of the study, and A. E. P. is now an employee with Almirall, but the work is unrelated to this employment. A. E. P. also hosts a guest affiliation with University of Copenhagen. Z. I. has served on scientific advisory boards, served as a consultant, received support for congress participation, received speaker honoraria and received research support, among others, from Biogen, Merck‐Serono, Sanofi‐Genzyme, Novartis, Roche and Lundbeckfonden. Å. F. S., A. B. W. and K. H. H. have nothing to declare.

Figures

Fig. 1
Fig. 1
The effect of cladribine on the viability of naive and lipopolysaccharide (LPS)‐stimulated microglia. Microglia were treated with dimethylsulfoxide (DMSO) (0·2%), LPS (10 ng/ml), DMSO and LPS, different concentrations of cladribine (CdA) (0·01 μM, 0·1 μM, 1 μM and 10 μM) and different concentrations of CdA together with LPS for 24 h, followed by an MTT [3‐(4,5‐dimethylthiazol‐2‐yl)‐2,5‐diphenyltetrazolium bromide] assay. The results [mean ± standard deviation (s.d.)] are shown relative to DMSO control. n = 4–5 in each group, one‐way analysis of variance (ANOVA) followed by multiple comparison tests.
Fig. 2
Fig. 2
The effect of cladribine on microglia granularity and size. Microglia were treated with dimethylsulfoxide (DMSO) (0·2%), lipopolysaccharide (LPS) (10 ng/ml), DMSO and LPS, different concentrations of cladribine (CdA) (0·01 μM, 0·1 μM, 1 μM and 10 μM), and different concentrations of CdA together with LPS for 24 h. (a) A representative example of size [forward‐scatter (FSC)] and granularity [side‐scatter (SSC)] of microglia by flow cytometry. (b) The effect of CdA on the granularity (SSC) of naive and LPS‐stimulated microglia relative to DMSO control. (c) The effect of CdA on the size (FSC) of naive and LPS‐stimulated microglia relative to DMSO control. ***≤ 0·001, n = 3–4 in each group, one‐way analysis of variance (ANOVA) followed by multiple comparison tests, mean ± standard deviation (s.d.).
Fig. 3
Fig. 3
The effect of cladribine on the phagocytotic ability and random migration of microglia. (a) Phagocytosis was quantified after microglia were treated with dimethylsulfoxide (DMSO) (0·2%), lipopolysaccharide (LPS) (10 ng/ml), DMSO and LPS, different concentrations of cladribine (CdA) (0·01 μM, 0·1 μM, 1 μM and 10 μM), and different concentrations of CdA together with LPS for 24 h. Fluorescent latex beads were added to the cell media for 40 min. As negative control, microglia were treated with cytochalasin D (5 μg/ml) for 30 min before addition of latex beads. The cells were analyzed by flow cytometry, and the phagocytotic ability was quantified by mean fluorescent intensity (MFI) and presented relative to DMSO control. (b) Track displacement was quantified by analysis of timelapse videos using TrackMate after microglia were treated with DMSO (0·2%), LPS (10 ng/ml), DMSO and LPS, different concentrations of CdA (0·1 μM, 1 μM and 10 μM) and different concentrations of CdA together with LPS for 24 h. The results are shown relative to DMSO control. (c) Total distance travelled was quantified by analysis of timelapse videos using TrackMate after microglia were treated with DMSO (0·2%), LPS (10 ng/ml), DMSO and LPS, different concentrations of CdA (0·1 μM, 1 μM and 10 μM) and different concentrations of CdA together with LPS for 24 h. The results are shown relative to DMSO control. *P ≤ 0·05, ****P ≤ 0·0001, n = 3–5 in each group, one‐way analysis of variance (ANOVA) followed by multiple comparison tests, mean ± standard deviation (s.d.).
Fig. 4
Fig. 4
The effect of cladribine on the mRNA expression and protein secretion of cytokines by lipopolysaccharide (LPS)‐stimulated microglia. (a) mRNA expression of interleukin (IL)‐1β, tumor necrosis factor (TNF) and IL‐10 was quantified by quantitative polymerase chain reaction (qPCR) after microglia were treated with dimethylsulfoxide (DMSO) (0·2%), LPS (10 ng/ml), DMSO and LPS and different concentrations of cladribine (CdA) (0·01 μM, 0·1 μM, 1 μM and 10 μM) together with LPS for 24 h. The expression is shown relative to DMSO control. (b) The protein concentration of IL‐1β, TNF and IL‐10 in the microglia cell culture supernatant was quantified by Meso Scale. The microglia were treated with DMSO (0·2%), DMSO and LPS, and different concentrations of CdA (0·1 μM, 1 μM and 10 μM) together with LPS for 24 h. *P ≤ 0·05, **P ≤ 0·01, ***P ≤ 0·001, ****P ≤ 0·0001, n = 4 in each group, unpaired t‐test with Welch’s correction and one‐way analysis of variance (ANOVA) followed by Dunnett’s multiple comparison test, mean ± standard deviation (s.d.).
Fig. 5
Fig. 5
The effect of cladribine on the mRNA expression of tumor necrosis factor receptors (TNF‐R) in lipopolysaccharide (LPS)‐stimulated microglia. mRNA expression of TNF‐R1 and TNF‐R2 was quantified by quantitative polymerase chain reaction (qPCR) after microglia were treated with dimethylsulfoxide (DMSO) (0·2%), LPS (10 ng/ml), DMSO and LPS, and different concentrations of cladribine (CdA) (0·01 μM, 0·1 μM, 1 μM and 10 μM) together with LPS for 24 h. The expression is shown relative to DMSO control. *P ≤ 0·05, **P ≤ 0·01, ***P ≤ 0·001, n = 4 in each group, one‐way analysis of variance (ANOVA) followed by multiple comparison tests, mean ± standard deviation (s.d.).
Fig. 6
Fig. 6
The effect of cladribine on the mRNA expression of arginase 1 (Arg1) and inducible nitric oxide synthase (iNOS) in lipopolysaccharide (LPS)‐stimulated microglia. mRNA expression of arginase 1 and iNOS was quantified by quantitative polymerase chain reaction (qPCR) after microglia were treated with dimethylsulfoxide (DMSO) (0·2%), LPS (10 ng/ml), DMSO and LPS and different concentrations of cladribine (CdA) (0·01 μM, 0·1 μM, 1 μM and 10 μM) together with LPS for 24 h. The expression is shown relative to DMSO control. **P ≤ 0·01, ***P ≤ 0·001, n = 4 in each group, one‐way analysis of variance (ANOVA) followed by multiple comparison tests, mean ± standard deviation (s.d.).
Fig. 7
Fig. 7
The effect of cladribine on the mRNA expression of arginase 1 (Arg1) in interleukin (IL)‐4‐stimulated microglia. mRNA expression of arginase 1 was quantified by quantitative polymerase chain reaction (qPCR) after microglia were treated with dimethylsulfoxide (DMSO) (0·2%), IL‐4 (20 ng/ml), DMSO and IL‐4, and different concentrations of cladribine (CdA) (0·01 μM, 0·1 μM, 1 μM and 10 μM) together with IL‐4 for 24 h. The expression is shown relative to DMSO control. *P ≤ 0·05, n = 3–4 in each group, one‐way analysis of variance (ANOVA) followed by multiple comparison tests, mean ± standard deviation (s.d.).
Fig. 8
Fig. 8
The effect of cladribine on the mRNA expression of deoxycytidine kinase (DCK) in lipopolysaccharide (LPS)‐ and interleukin (IL)‐4‐stimulated microglia. mRNA expression of DCK was quantified by quantitative polymerase chain reaction (qPCR) and is shown relative to dimethylsulfoxide (DMSO) control. (a) Microglia were treated with DMSO (0·2%), LPS (10 ng/ml), DMSO and LPS, and different concentrations of cladribine (CdA) (0·01 μM, 0·1 μM, 1 μM and 10 μM) together with LPS for 24 h. (b) Microglia were treated with DMSO (0·2%), IL‐4 (20 ng/ml), DMSO and IL‐4 and different concentrations of CdA (0·01 μM, 0·1 μM, 1 μM and 10 μM) together with IL‐4 for 24 h. **P ≤ 0·01, ***P ≤ 0·001, n = 3–4 in each group, one‐way analysis of variance (ANOVA) followed by multiple comparison tests, mean ± standard deviation (s.d.).

References

    1. Sipe JC. Cladribine tablets: a potential new short‐course annual treatment for relapsing multiple sclerosis. Expert Rev Neurother 2010; 10:365–75. - PubMed
    1. Giovannoni G. Cladribine to treat relapsing forms of multiple sclerosis. Neurotherapeutics 2017; 14:874–87. - PMC - PubMed
    1. Warnke C, Leussink VI, Goebels N et al Cladribine as a therapeutic option in multiple sclerosis. Clin Immunol 2012; 142:68–75. - PubMed
    1. Giovannoni G, Comi G, Cook S et al A placebo‐controlled trial of oral cladribine for relapsing multiple sclerosis. N Engl J Med 2010; 362:416–26. - PubMed
    1. Comi G, Cook S, Rammohan K et al Long‐term effects of cladribine tablets on MRI activity outcomes in patients with relapsing‐remitting multiple sclerosis: the CLARITY Extension study. Ther Adv Neurol Disord 2018; 11:1756285617753365. - PMC - PubMed

Publication types

Substances