. 2020 Jul 9;182(1):59-72.e15.
doi: 10.1016/j.cell.2020.05.032. Epub 2020 May 28.

Proteomic and Metabolomic Characterization of COVID-19 Patient Sera

Affiliations

Proteomic and Metabolomic Characterization of COVID-19 Patient Sera

Bo Shen et al. Cell. .

Abstract

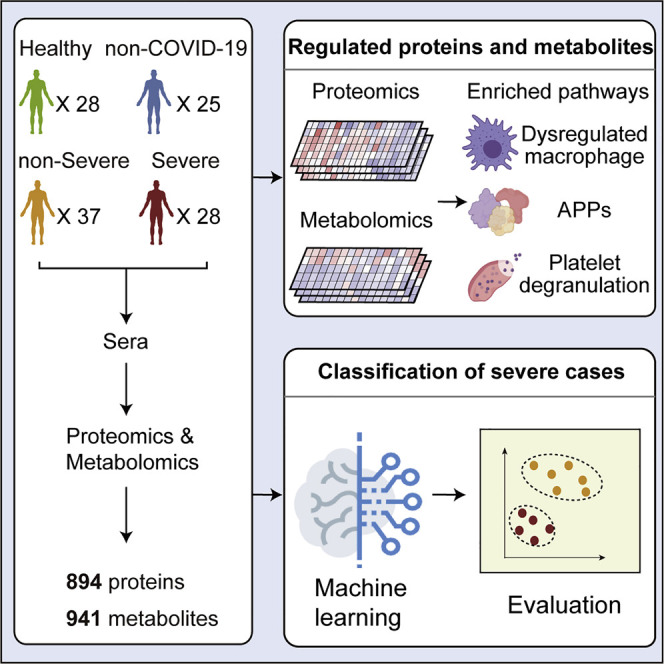
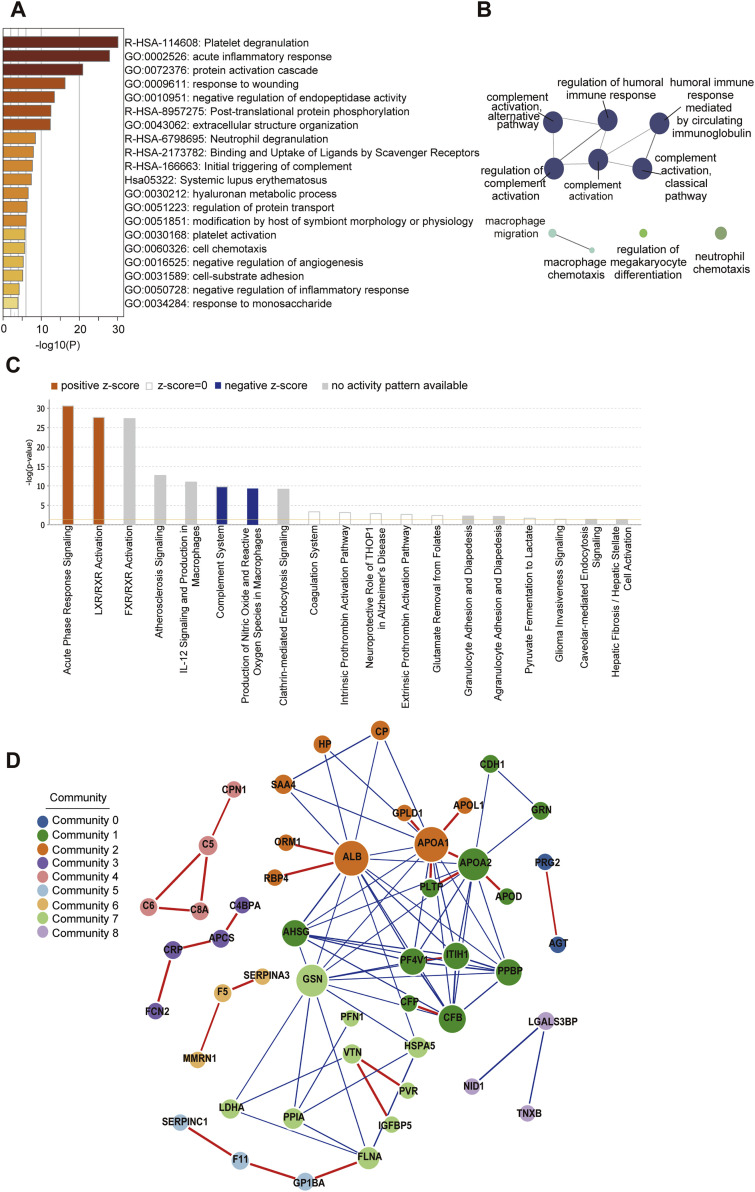
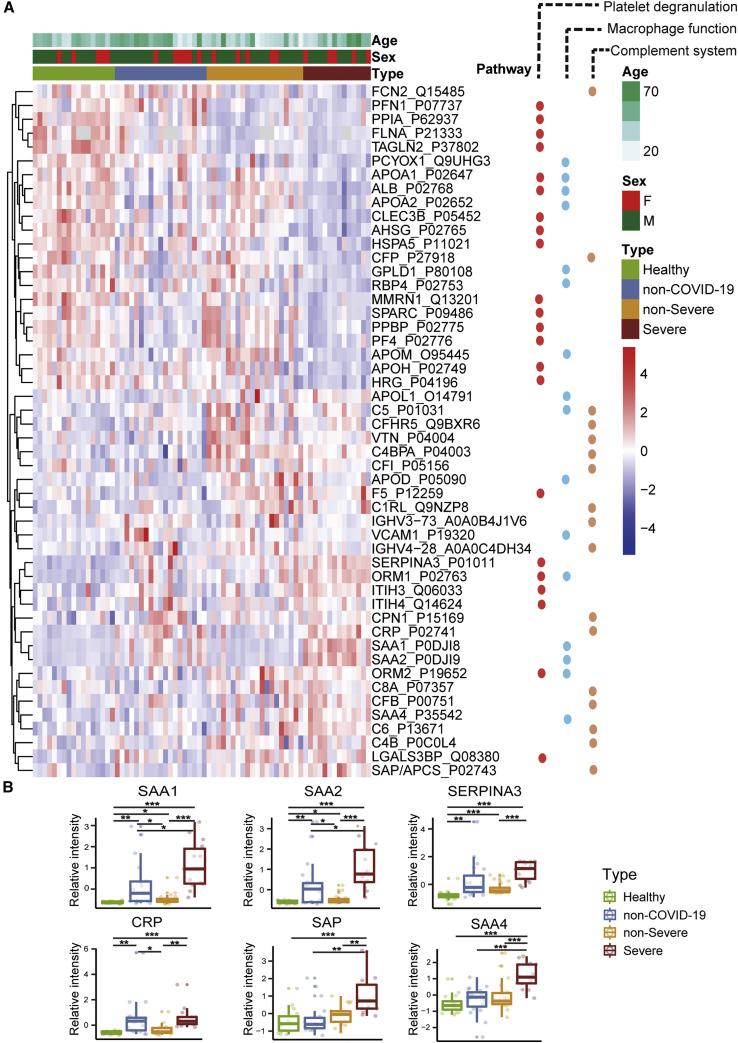
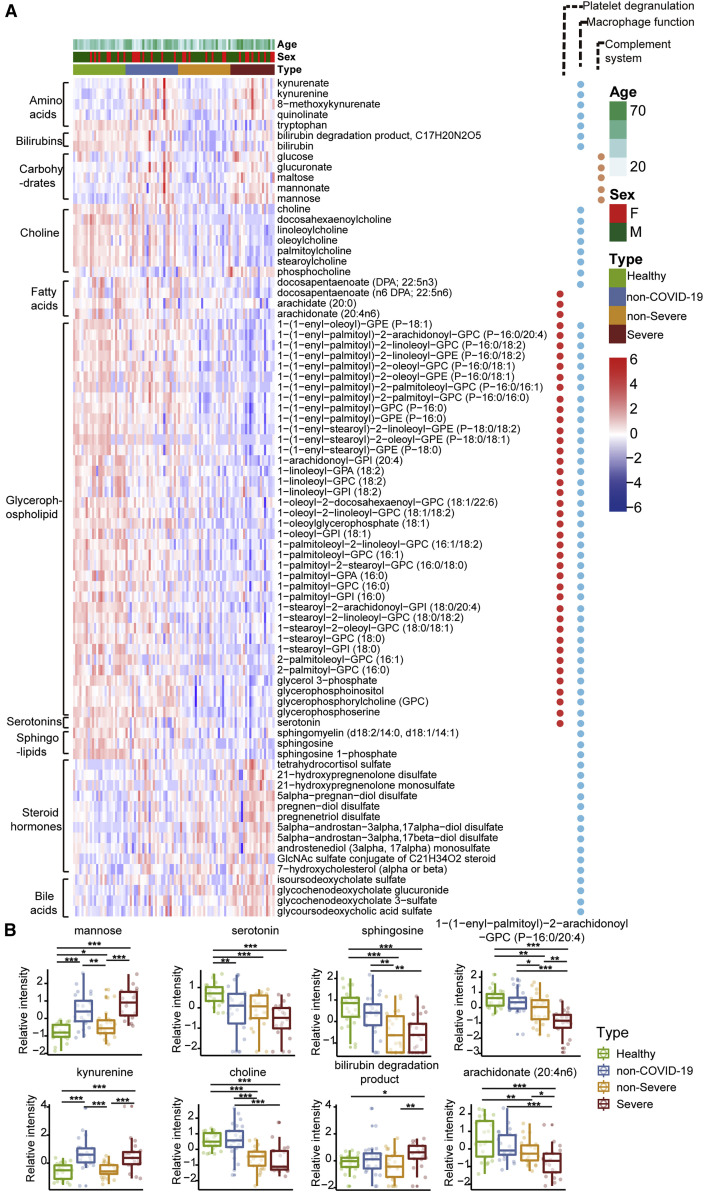
Early detection and effective treatment of severe COVID-19 patients remain major challenges. Here, we performed proteomic and metabolomic profiling of sera from 46 COVID-19 and 53 control individuals. We then trained a machine learning model using proteomic and metabolomic measurements from a training cohort of 18 non-severe and 13 severe patients. The model was validated using 10 independent patients, 7 of which were correctly classified. Targeted proteomics and metabolomics assays were employed to further validate this molecular classifier in a second test cohort of 19 COVID-19 patients, leading to 16 correct assignments. We identified molecular changes in the sera of COVID-19 patients compared to other groups implicating dysregulation of macrophage, platelet degranulation, complement system pathways, and massive metabolic suppression. This study revealed characteristic protein and metabolite changes in the sera of severe COVID-19 patients, which might be used in selection of potential blood biomarkers for severity evaluation.

Keywords: COVID-19; metabolomics; proteomics; serum; severity.


Conflict of interest statement

Declaration of Interests The research group of T.G. is partly supported by Tencent, Thermo Fisher Scientific, SCIEX, and Pressure Biosciences Inc. C.Z., Z. Kong, Z. Kang, and S.Q. are employees of DIAN Diagnostics.

Figures

None
Graphical abstract
Figure 1
Figure 1
Summary of COVID-19 Patients and Machine Learning Design (A) Summary of COVID-19 patients, including non-severe (n = 37) and severe (n = 28) patients with more details in Table S1. Patients labeled in red (y axis) indicate chronic infection of hepatitis B virus. (B) Study design for machine-learning-based classifier development for severe COVID-19 patients. We first procured samples in a training cohort (C1) for proteomic and metabolomic analysis. The classifier was then validated in an independent test cohort (C2), followed by a second test cohort (C3).
Figure S1
Figure S1
Twelve Clinical Parameters of COVID-19 Patients and Non-COVID-19 Patients, Related to Figure 1 Significance indicated by the asterisks (unpaired two-sided Welch’s t test. p value: , < 0.05; ∗∗, < 0.01; ∗∗∗, < 0.001.)
Figure S2
Figure S2
Quality Control of Proteomic and Metabolomic Data, Related to Figure 1 (A) Coefficient of variation (CV) of the proteomic data is calculated by the proteins quantified in six quality control (QC) samples using the pooled samples from all samples in training cohort. CV of the metabolomic data is calculated by twelve QC samples using a set of isotopic internal spiked-in standards. (B) Uniform Manifold Approximation and Projection (UMAP) of sera samples using 791 measured proteins in the training cohort. (C) UMAP of sera samples using 847 metabolites excluding drugs. (D) UMAP analysis of the COVID-19 patients using 791 measured proteins. (E) UMAP analysis of the COVID-19 patients using 847 metabolites. In D and E, patients labeled in red received serum test before they were diagnosed as severe. Inside the brackets are the sex, age, time from disease onset to admission and time from sampling to diagnose of severe case in sequence.
Figure 2
Figure 2
Separation of Severe and Non-severe COVID-19 Patients by Machine Learning of Proteomic and Metabolomic Features (A) Top 22 proteins and 7 metabolites prioritized by random forest analysis ranked by the mean decrease in accuracy. (B) Network of prioritized proteins appeared in the classifier. Red and green nodes indicate upregulated and downregulated molecules, respectively. White nodes represent molecules not detected in our dataset. (C) Receiver operating characteristic (ROC) of the random forest model in the training cohort (C1). (D) Performance of the model in the test cohort (C2) of 10 COVID-19 patients. (E) Performance of the model in the test cohort (C3) containing 19 COVID-19 patients. Patients labeled in red received serum test before they were diagnosed as severe.
Figure S3
Figure S3
Differentially Expressed Proteins and Metabolites in Different Patient Groups in the Training Cohort, Related to Figure 4 and 5 (A-D) Volcano plots compare four pairs of patient groups as indicated in the plot. Proteins with log2 (fold-change) beyond 0.25 or below −0.25 with adjusted p value lower than 0.05 were considered as significantly differential expression. (E-H) Volcano plots for the metabolomics data. Number of significantly down- (blue) and up- (red) regulated proteins were shown on the top.
Figure S4
Figure S4
Proteins and Metabolites Regulated in COVID-19 Patients but Not in Non-COVID-19 Patients, Related to Figure 4 and 5 Venn diagrams showing the overlaps between significantly regulated proteins (A) and metabolites (B) as identified in volcano plots. Proteins and metabolites labeled in red are the shortlisted molecules which differentially expressed in the COVID-19 patients but not in the non-COVID-19 patients.
Figure S5
Figure S5
Identification of Specific Clusters of Proteins and Metabolites in COVID-19 Patients, Related to Figure 4 and 5 791 proteins (A) and 941 metabolites (B) were clustered using mFuzz into significant discrete clusters, respectively, to illustrate the relative expression changes of the proteomics and metabolomics data. The groups in proteomics and metabolomics data: 1: Healthy; 2: non-COVID-19; 3: non-Severe COVID-19; 4: Severe COVID-19.
Figure S6
Figure S6
Pathway Analysis of 93 Differentially Expressed Proteins in COVID-19 Patients, Related to Figure 4 and 5 (A) The Gene Ontology (GO) processes enriched by Metascape. (B) The GO terms enriched using the Cytoscape plug-in ClueGO. (C) Ingenuine pathway analysis of most significantly relevant pathways with the predicted activation or inhibition state. (D) Functional network analysis by GeNet identifies several communities.
Figure 3
Figure 3
Dysregulated Proteins in COVID-19 Sera (A) Heatmap of 50 selected proteins whose regulation concentrated on three enriched pathways. (B) The expression level change (Z-scored original value) of six selected proteins with significant difference between non-severe and severe cases. Asterisks indicate statistical significance based on unpaired two-sided Welch’s t test. p value: , < 0.05; ∗∗, < 0.01; ∗∗∗, < 0.001.
Figure 4
Figure 4
Dysregulated Metabolites in COVID-19 Sera (A) Heatmap of 80 regulated metabolites belonging to 10 major classes as indicated. (B) The expression level change (Z-scored log 2-scaled original value) of eight selected regulated metabolites with significant difference between non-severe and severe cases. Asterisks indicate statistical significance as described in Figure 3.
Figure 5
Figure 5
Key Proteins and Metabolites Characterized in Severe COVID-19 Patients in a Working Model SARS-CoV-2 may target alveolar macrophages via ACE2 receptor, leading to an increase of secretion of cytokines including IL-6 and TNF-α, which subsequently induce the elevation of various APPs such as SAP, CRP, SAA1, SAA2, and C6, which are significantly upregulated in the severe group. Proteins involved in macrophage, lipid metabolism, and platelet degranulation were indicated with their corresponding expression levels in four patient groups.

References

    1. Aebersold R., Mann M. Mass-spectrometric exploration of proteome structure and function. Nature. 2016;537:347–355. - PubMed
    1. Arabi Y.M., Mandourah Y., Al-Hameed F., Sindi A.A., Almekhlafi G.A., Hussein M.A., Jose J., Pinto R., Al-Omari A., Kharaba A., Saudi Critical Care Trial Group Corticosteroid Therapy for Critically Ill Patients with Middle East Respiratory Syndrome. Am. J. Respir. Crit. Care Med. 2018;197:757–767. - PubMed
    1. Assinger A. Platelets and infection - an emerging role of platelets in viral infection. Front. Immunol. 2014;5:649. - PMC - PubMed
    1. Auerbach D.J., Lin Y., Miao H., Cimbro R., Difiore M.J., Gianolini M.E., Furci L., Biswas P., Fauci A.S., Lusso P. Identification of the platelet-derived chemokine CXCL4/PF-4 as a broad-spectrum HIV-1 inhibitor. Proc. Natl. Acad. Sci. USA. 2012;109:9569–9574. - PMC - PubMed
    1. Baganz N.L., Blakely R.D. A dialogue between the immune system and brain, spoken in the language of serotonin. ACS Chem. Neurosci. 2013;4:48–63. - PMC - PubMed

Publication types

LinkOut - more resources